| Param | Original file | Final file |
|---|---|---|
| Filename | modeM0/AS1A09_022T01_9000003702_25290cztM0_level2.evt | modeM0/AS1A09_022T01_9000003702_25290cztM0_level2_quad_clean.evt |
| Size (bytes) | 643,089,600 | 100,385,280 |
| Size | 613.3 MB | 95.7 MB |
| Events in quadrant A | 8,242,337 | 607,652 |
| Events in quadrant B | 3,276,348 | 678,856 |
| Events in quadrant C | 3,172,811 | 658,912 |
| Events in quadrant D | 4,342,863 | 639,189 |
| Mode M9 | |||
|---|---|---|---|
| Quadrant | BADHDUFLAG | Total packets | Discarded packets |
| A | 0 | 9 | 0 |
| B | 0 | 9 | 0 |
| C | 0 | 9 | 0 |
| D | 0 | 9 | 0 |
| Mode M0 | |||
|---|---|---|---|
| Quadrant | BADHDUFLAG | Total packets | Discarded packets |
| A | 0 | 28869 | 0 |
| B | 0 | 13948 | 0 |
| C | 0 | 13489 | 0 |
| D | 0 | 17194 | 0 |
| Quadrant | Total seconds | Saturated seconds | Saturation percentage |
|---|---|---|---|
| A | 6531 | 1765 | 27.024958% |
| B | 6531 | 61 | 0.934007% |
| C | 6531 | 95 | 1.454601% |
| D | 6531 | 238 | 3.644159% |
Noise dominated data is calculated using 1-second bins in cleaned event files. If a bin has >2000 counts, and if more than 50% of those come from <1% of pixels, then it is considered to be noise-dominated and hence unusable.
| Quadrant | # 1 sec bins | Bins with >0 counts | Bins with >2000 counts | High rate bins dominated by noise | Noise dominated (total time) | Noise dominated (detector-on time) | Marked lightcurve |
|---|---|---|---|---|---|---|---|
| A | 7356 | 6532 | 1534 | 1534 | 20.85% | 23.48% | 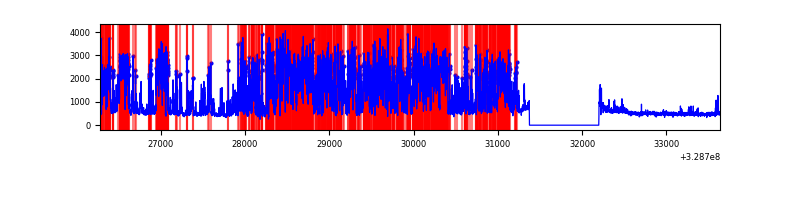 |
| B | 7356 | 6532 | 2 | 2 | 0.03% | 0.03% | 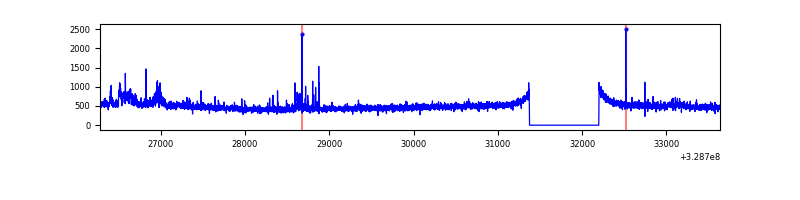 |
| C | 7356 | 6532 | 0 | 0 | 0.00% | 0.00% | 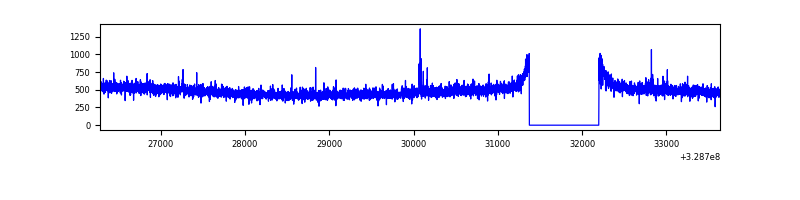 |
| D | 7356 | 6532 | 187 | 187 | 2.54% | 2.86% | 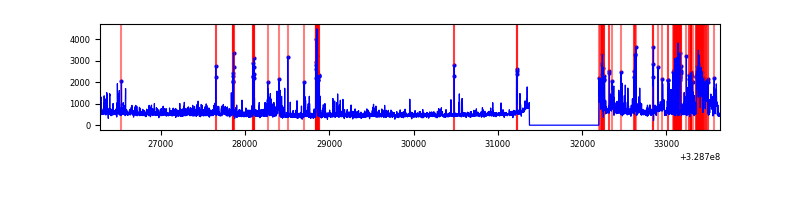 |
Top three noisy pixels from each quadrant. If the there are fewer than three noisy pixels in the level2.evt file, extra rows are filled as -1
| Pixel properties | Quadrant properties | ||||||
|---|---|---|---|---|---|---|---|
| Quadrant | DetID | PixID | Counts | Sigma | Mean | Median | Sigma |
| A | 6 | 16 | 5403543 | 37264.31 | 731 | 717 | 145.0 |
| A | 15 | 173 | 19084 | 126.68 | 731 | 717 | 145.0 |
| A | 13 | 254 | 9582 | 61.14 | 731 | 717 | 145.0 |
| B | 15 | 33 | 67014 | 449.81 | 793 | 775 | 147.3 |
| B | 0 | 229 | 51512 | 344.54 | 793 | 775 | 147.3 |
| B | 3 | 112 | 51394 | 343.74 | 793 | 775 | 147.3 |
| C | 14 | 238 | 124342 | 685.11 | 775 | 778 | 180.4 |
| C | 9 | 54 | 11820 | 61.22 | 775 | 778 | 180.4 |
| C | 0 | 207 | 8571 | 43.21 | 775 | 778 | 180.4 |
| D | 1 | 52 | 588402 | 3140.88 | 778 | 757 | 187.1 |
| D | 12 | 233 | 367337 | 1959.32 | 778 | 757 | 187.1 |
| D | 8 | 195 | 278430 | 1484.12 | 778 | 757 | 187.1 |
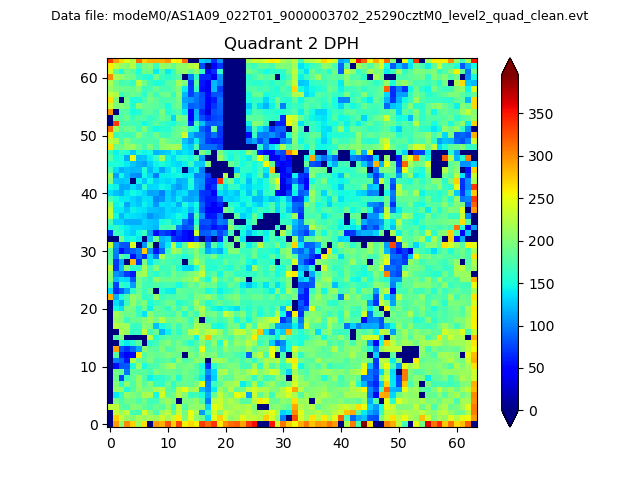
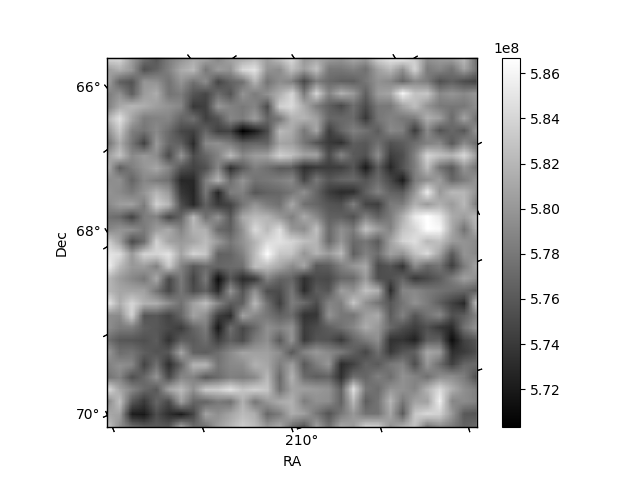
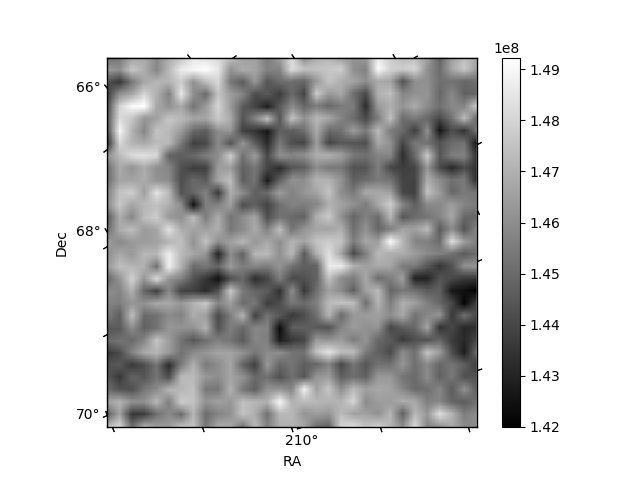
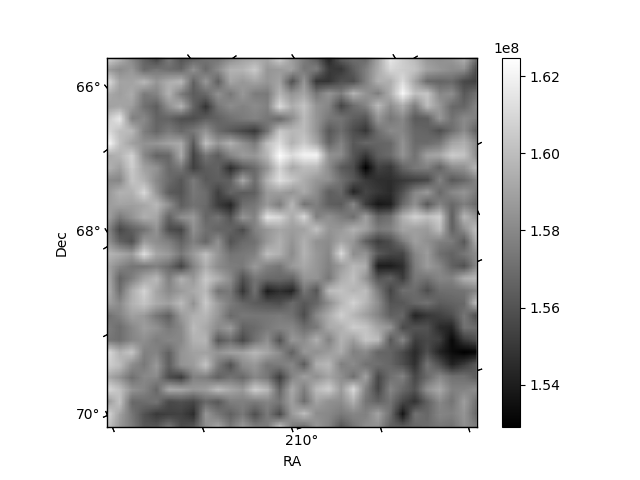
Histogram calculated using DETX and DETY for each event in the final _common_clean file
| Quadrant A | 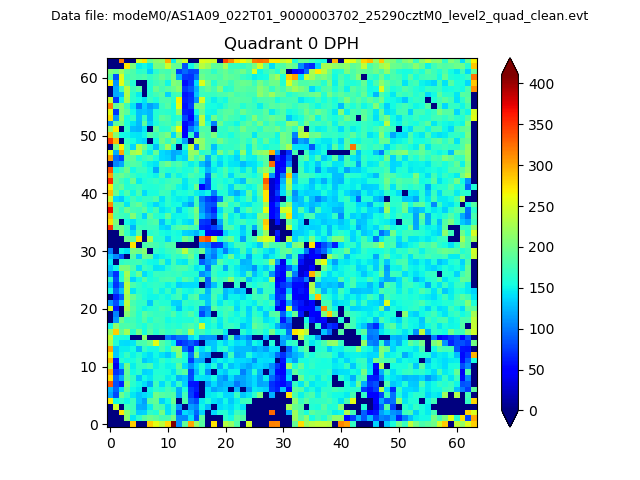 |
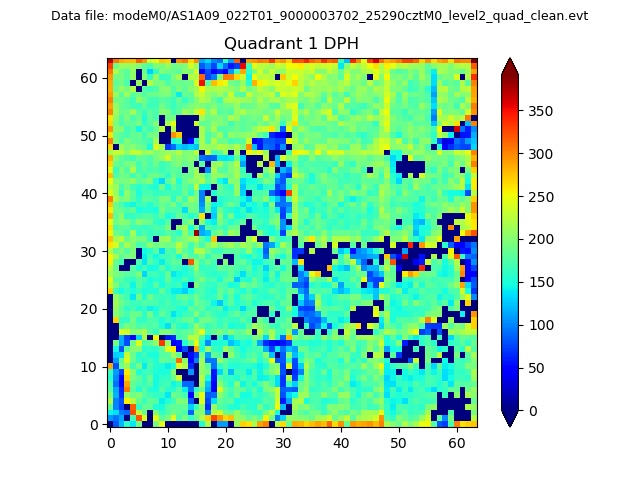 |
Quadrant B |
|---|---|---|---|
| Quadrant D | 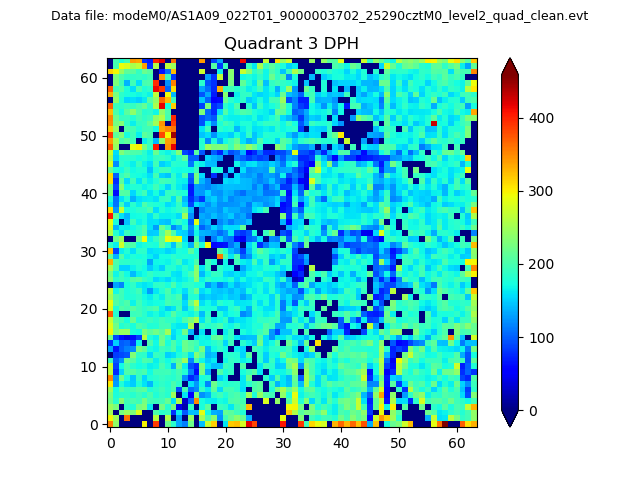 |
 |
Quadrant C |
| Plot type | Count rate plots | Images |
|---|---|---|
| Comparison with Poisson distribution Blue bars denote a histogram of data divided into 1 sec bins. Red curve is a Poisson curve with rate = median count rate of data. |
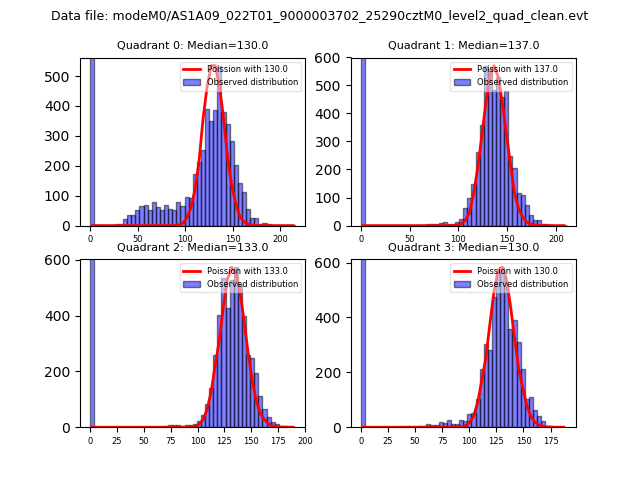 |
 |
| Quadrant-wise count rates Data is divided into 100 sec bins |
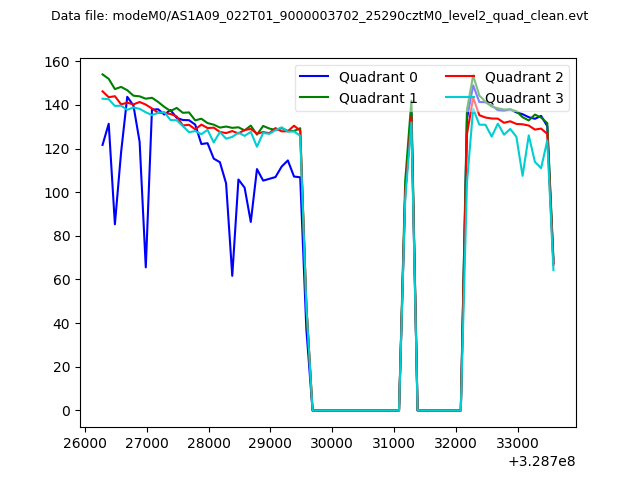 |
|
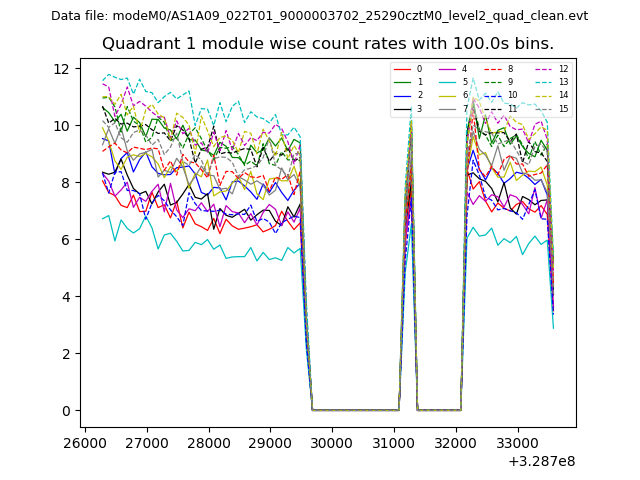
| Module-wise count rates for Quadrant A Data is divided into 100 sec bins |
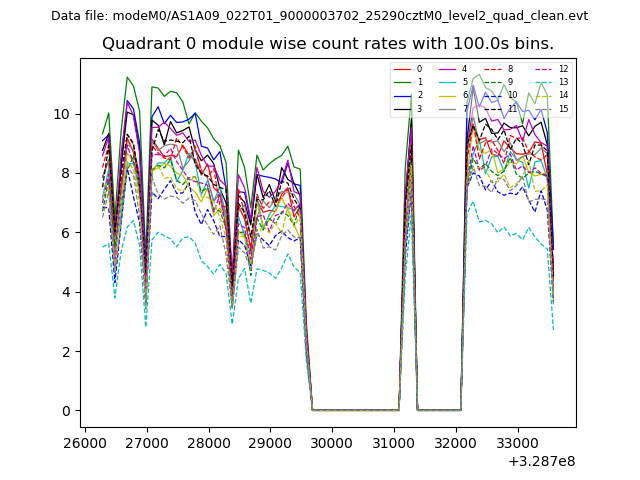 |
 |
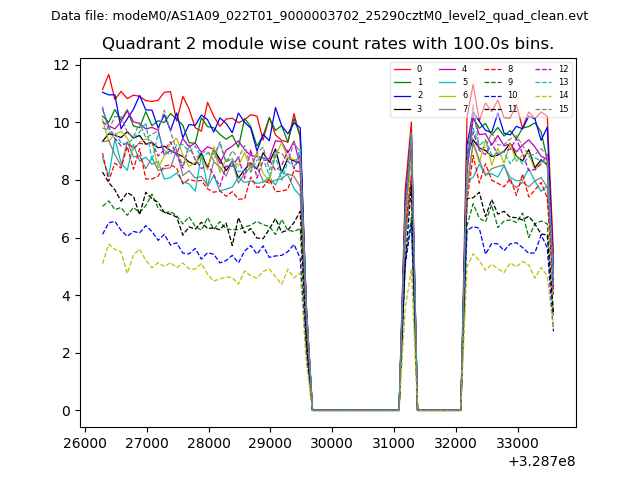
| Module-wise count rates for Quadrant B Data is divided into 100 sec bins |
 |
 |
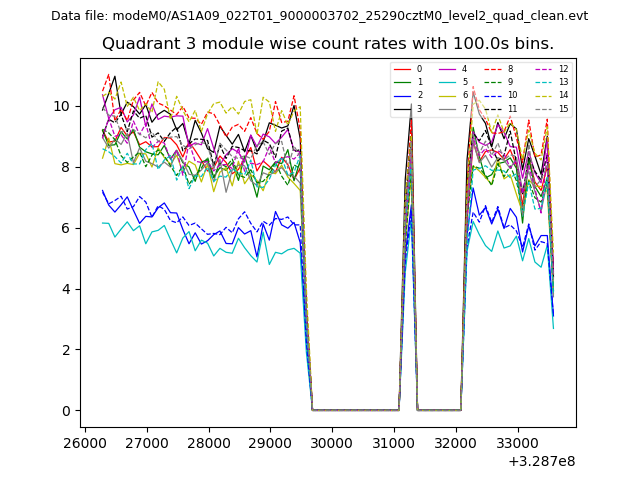
| Module-wise count rates for Quadrant C Data is divided into 100 sec bins |
 |
 |
| Module-wise count rates for Quadrant D Data is divided into 100 sec bins |
 |
 |
| Parameter | Plot |
|---|---|
| CZT HV Monitor | 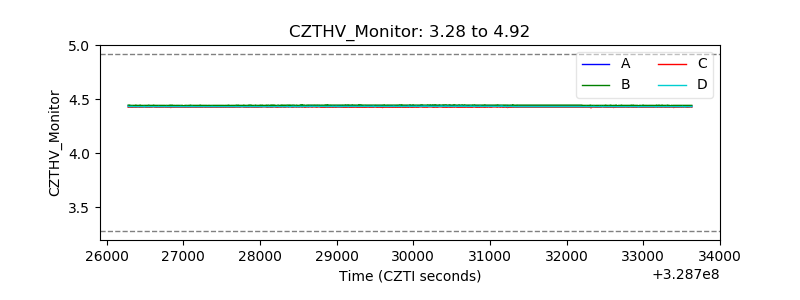 |
| D_VDD | 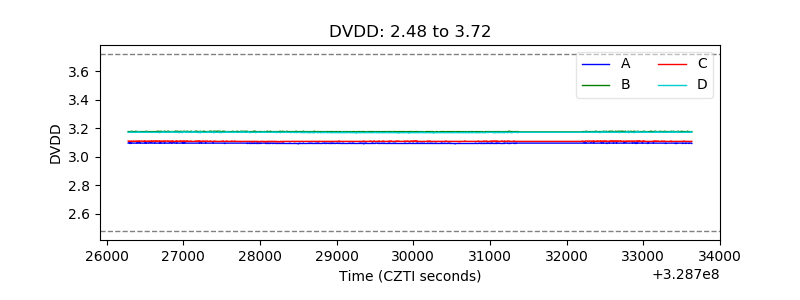 |
| Temperature 1 | 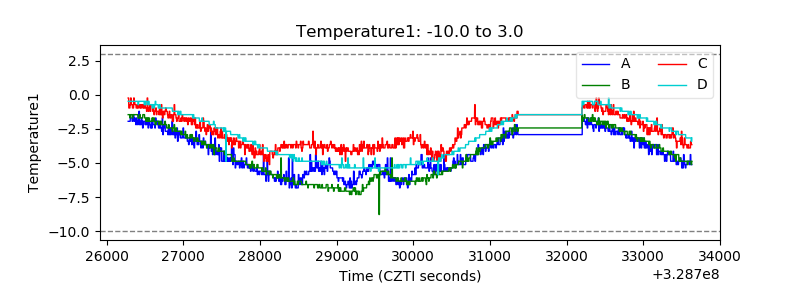 |
| Veto HV Monitor | 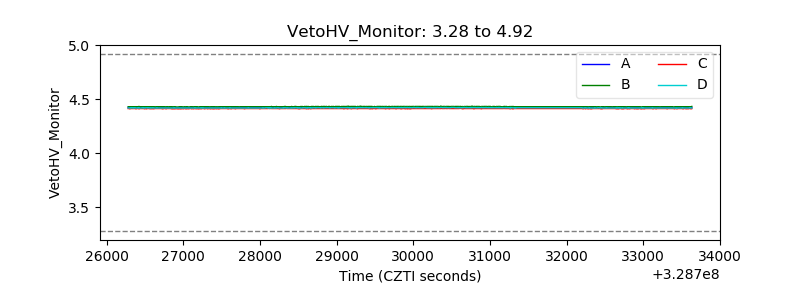 |
| Veto LLD | 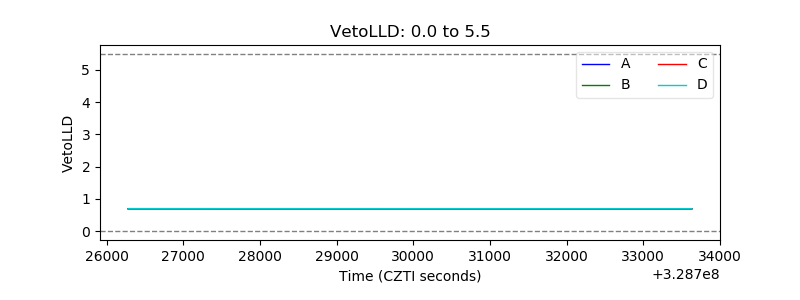 |
| Alpha Counter | 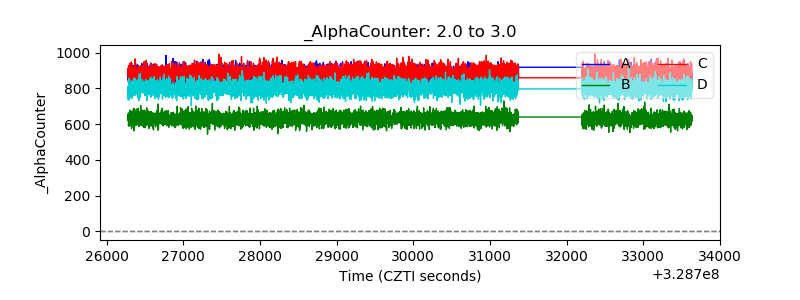 |
| _CPM_Rate | 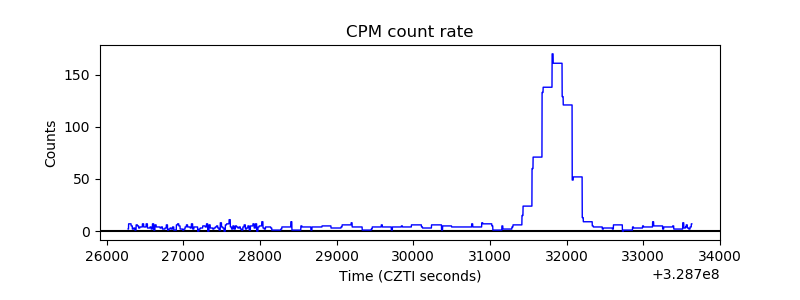 |
| CZT Counter | 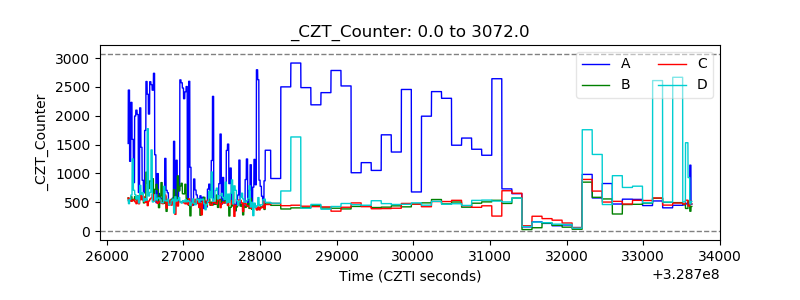 |
| +2.5 Volts monitor |  |
| +5 Volts monitor | 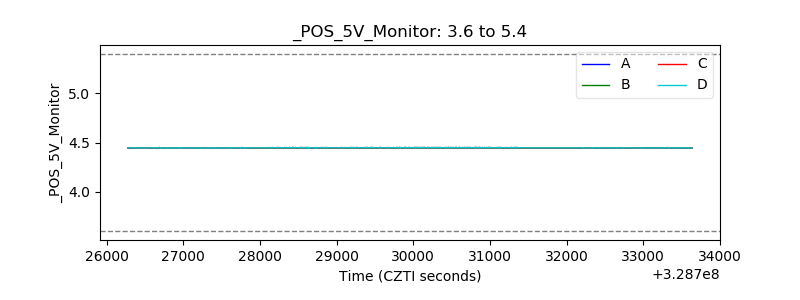 |
| _ROLL_ROT | 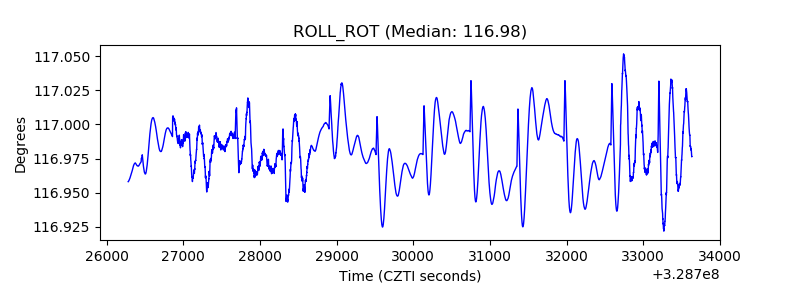 |
| _Roll_DEC | 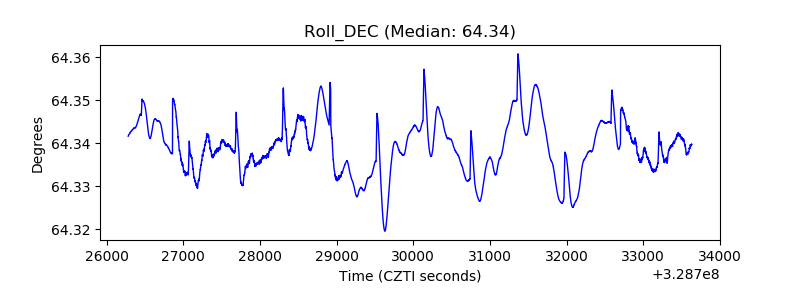 |
| _Roll_RA | 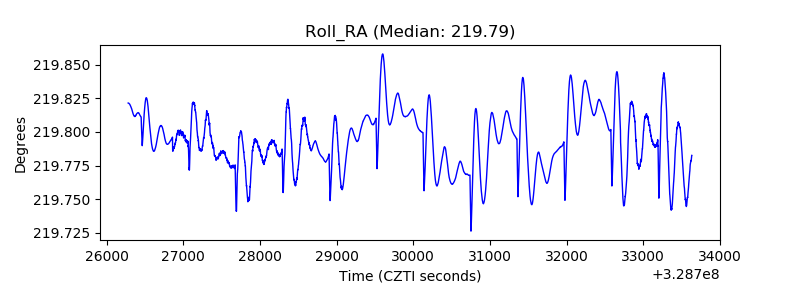 |
| Veto Counter | 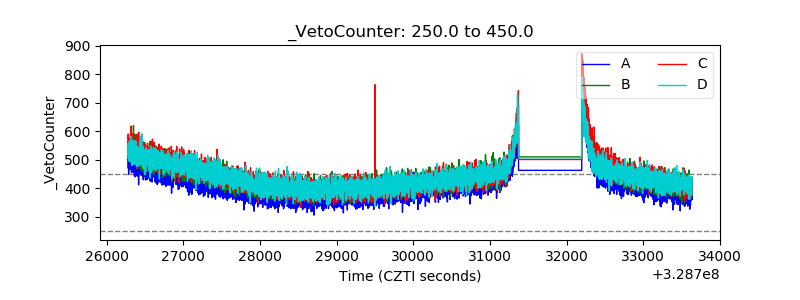 |