| Param | Original file | Final file |
|---|---|---|
| Filename | modeM0/AS1A09_022T01_9000003702_25291cztM0_level2.evt | modeM0/AS1A09_022T01_9000003702_25291cztM0_level2_quad_clean.evt |
| Size (bytes) | 587,139,840 | 113,682,240 |
| Size | 559.9 MB | 108.4 MB |
| Events in quadrant A | 3,641,233 | 756,685 |
| Events in quadrant B | 3,546,309 | 762,709 |
| Events in quadrant C | 3,688,481 | 735,205 |
| Events in quadrant D | 6,410,218 | 679,498 |
| Mode M9 | |||
|---|---|---|---|
| Quadrant | BADHDUFLAG | Total packets | Discarded packets |
| A | 0 | 9 | 0 |
| B | 0 | 10 | 0 |
| C | 0 | 10 | 0 |
| D | 0 | 10 | 0 |
| Mode M0 | |||
|---|---|---|---|
| Quadrant | BADHDUFLAG | Total packets | Discarded packets |
| A | 0 | 15713 | 0 |
| B | 0 | 15301 | 0 |
| C | 0 | 15594 | 0 |
| D | 0 | 24146 | 0 |
| Quadrant | Total seconds | Saturated seconds | Saturation percentage |
|---|---|---|---|
| A | 7306 | 71 | 0.971804% |
| B | 7306 | 78 | 1.067616% |
| C | 7306 | 144 | 1.970983% |
| D | 7306 | 881 | 12.058582% |
Noise dominated data is calculated using 1-second bins in cleaned event files. If a bin has >2000 counts, and if more than 50% of those come from <1% of pixels, then it is considered to be noise-dominated and hence unusable.
| Quadrant | # 1 sec bins | Bins with >0 counts | Bins with >2000 counts | High rate bins dominated by noise | Noise dominated (total time) | Noise dominated (detector-on time) | Marked lightcurve |
|---|---|---|---|---|---|---|---|
| A | 7746 | 7307 | 11 | 11 | 0.14% | 0.15% | 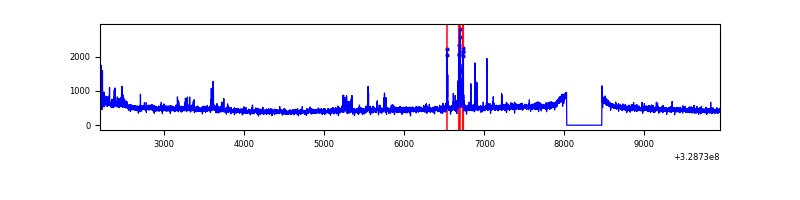 |
| B | 7746 | 7307 | 1 | 1 | 0.01% | 0.01% | 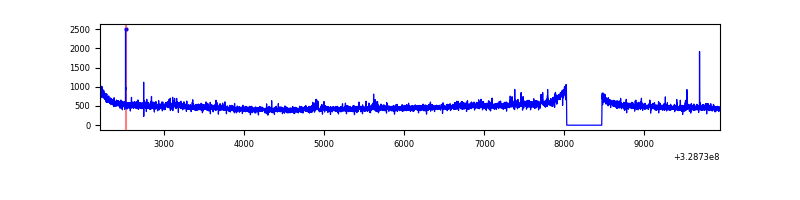 |
| C | 7746 | 7307 | 5 | 5 | 0.06% | 0.07% | 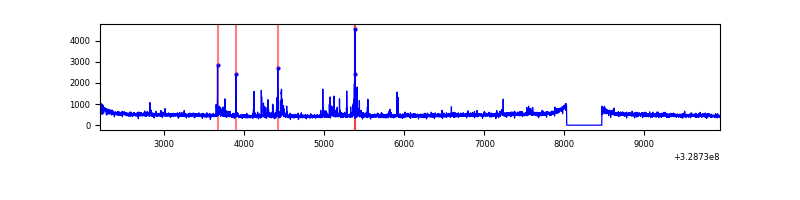 |
| D | 7746 | 7307 | 636 | 636 | 8.21% | 8.70% | 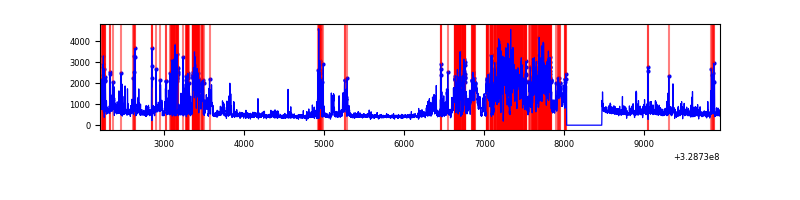 |
Top three noisy pixels from each quadrant. If the there are fewer than three noisy pixels in the level2.evt file, extra rows are filled as -1
| Pixel properties | Quadrant properties | ||||||
|---|---|---|---|---|---|---|---|
| Quadrant | DetID | PixID | Counts | Sigma | Mean | Median | Sigma |
| A | 6 | 16 | 181715 | 1019.41 | 885 | 866 | 177.4 |
| A | 0 | 31 | 20126 | 108.56 | 885 | 866 | 177.4 |
| A | 15 | 173 | 20004 | 107.88 | 885 | 866 | 177.4 |
| B | 0 | 229 | 50255 | 297.5 | 881 | 861 | 166.0 |
| B | 12 | 111 | 20115 | 115.97 | 881 | 861 | 166.0 |
| B | 11 | 111 | 17574 | 100.66 | 881 | 861 | 166.0 |
| C | 2 | 16 | 164823 | 816.44 | 858 | 863 | 200.8 |
| C | 14 | 238 | 136601 | 675.91 | 858 | 863 | 200.8 |
| C | 9 | 54 | 23600 | 113.22 | 858 | 863 | 200.8 |
| D | 1 | 52 | 2272784 | 11308.97 | 833 | 810 | 200.9 |
| D | 12 | 233 | 463754 | 2304.35 | 833 | 810 | 200.9 |
| D | 8 | 195 | 323011 | 1603.79 | 833 | 810 | 200.9 |
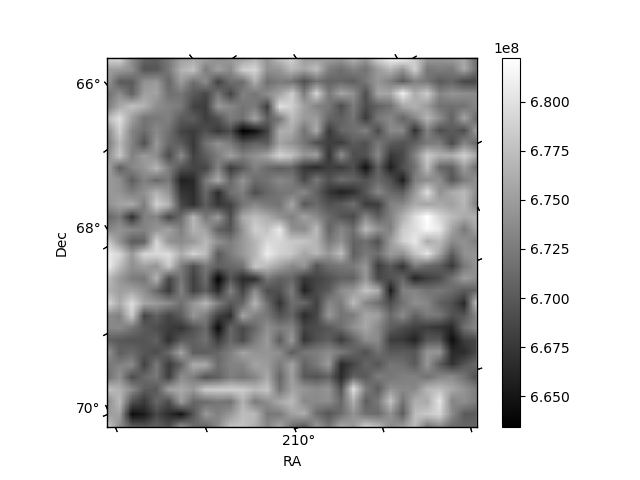
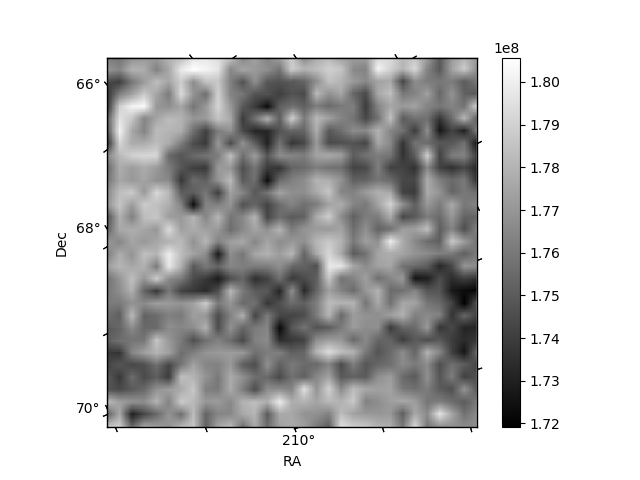
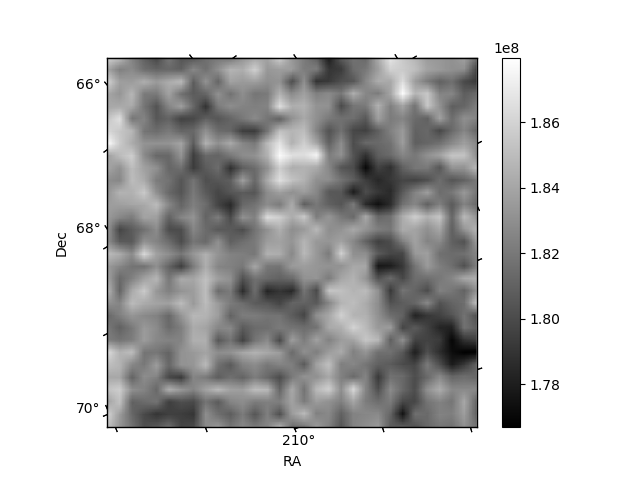
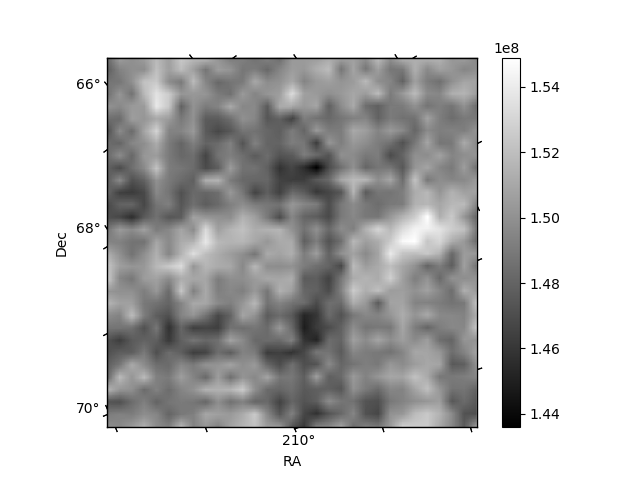
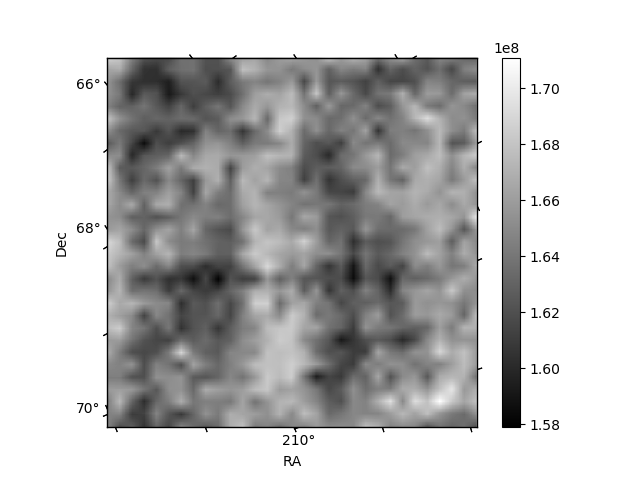
Histogram calculated using DETX and DETY for each event in the final _common_clean file
| Quadrant A | 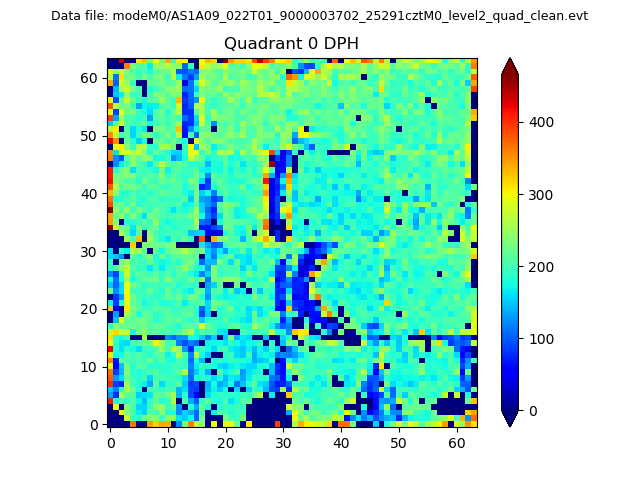 |
 |
Quadrant B |
|---|---|---|---|
| Quadrant D | 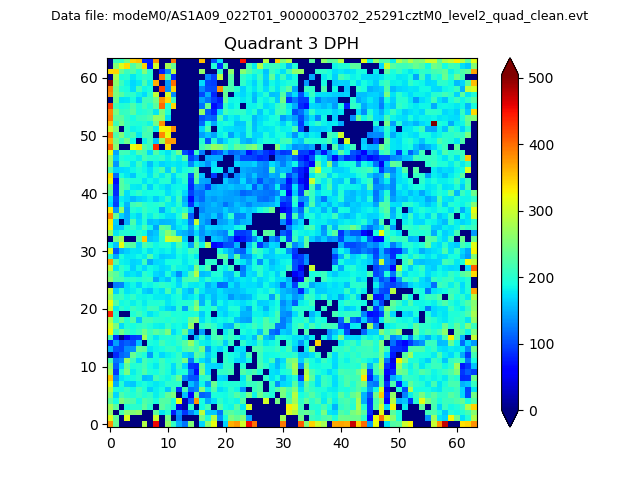 |
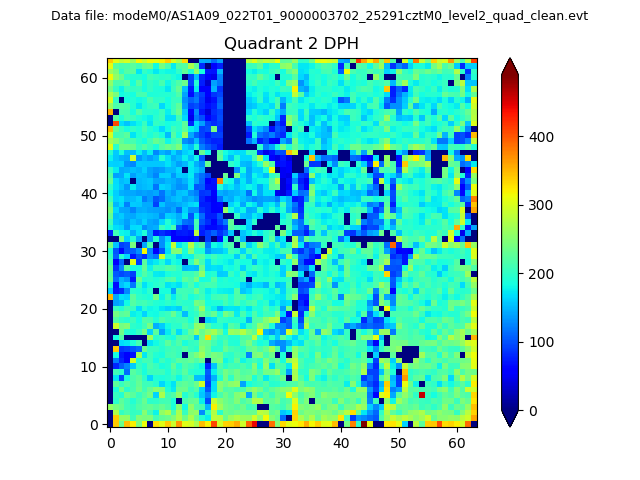 |
Quadrant C |
| Plot type | Count rate plots | Images |
|---|---|---|
| Comparison with Poisson distribution Blue bars denote a histogram of data divided into 1 sec bins. Red curve is a Poisson curve with rate = median count rate of data. |
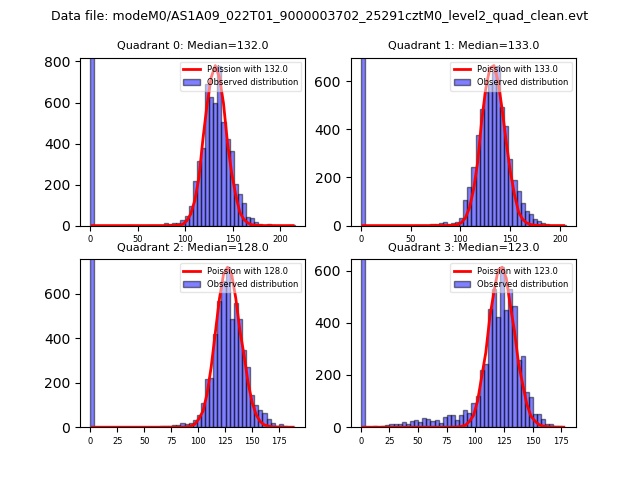 |
 |
| Quadrant-wise count rates Data is divided into 100 sec bins |
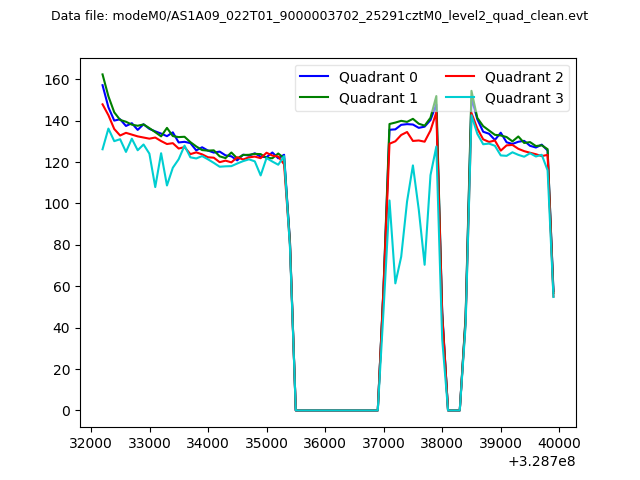 |
|
| Module-wise count rates for Quadrant A Data is divided into 100 sec bins |
 |
 |
| Module-wise count rates for Quadrant B Data is divided into 100 sec bins |
 |
 |
| Module-wise count rates for Quadrant C Data is divided into 100 sec bins |
 |
 |
| Module-wise count rates for Quadrant D Data is divided into 100 sec bins |
 |
 |
| Parameter | Plot |
|---|---|
| CZT HV Monitor |  |
| D_VDD | 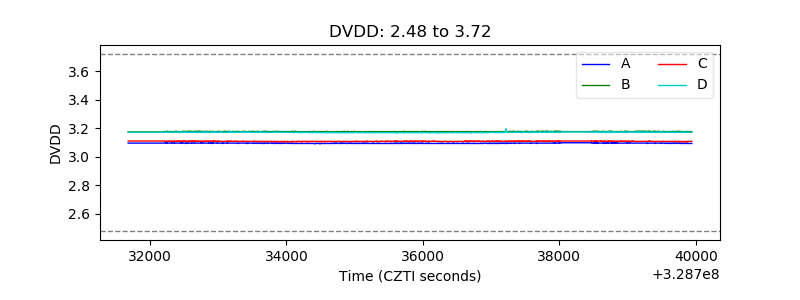 |
| Temperature 1 | 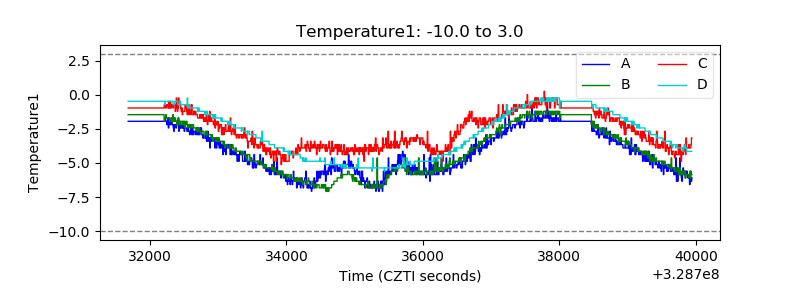 |
| Veto HV Monitor |  |
| Veto LLD | 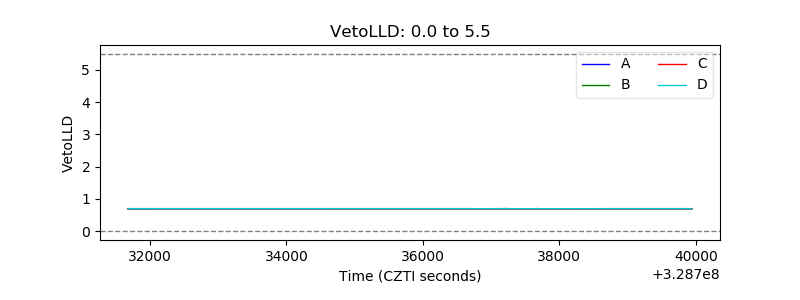 |
| Alpha Counter | 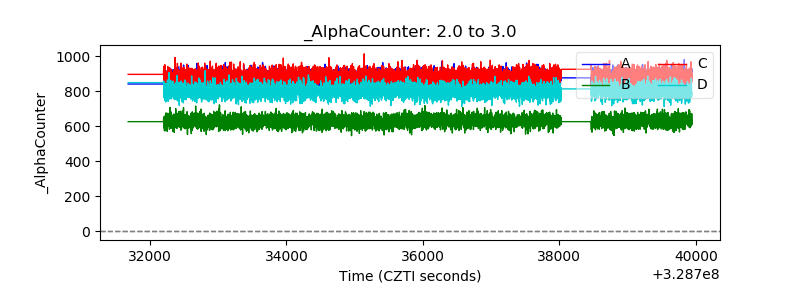 |
| _CPM_Rate | 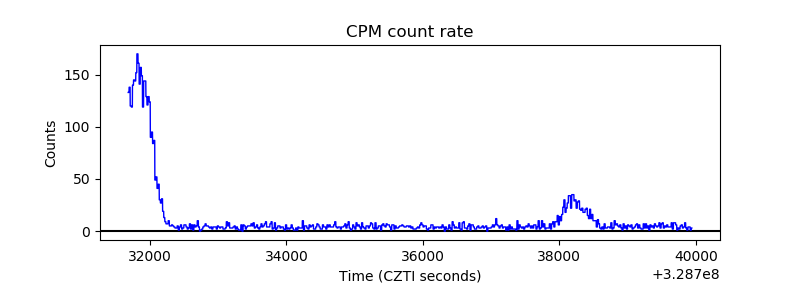 |
| CZT Counter | 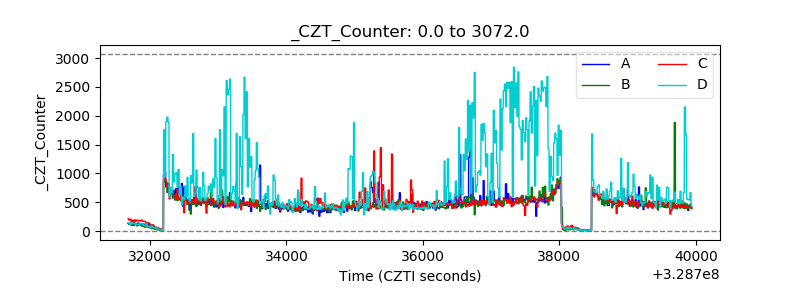 |
| +2.5 Volts monitor | 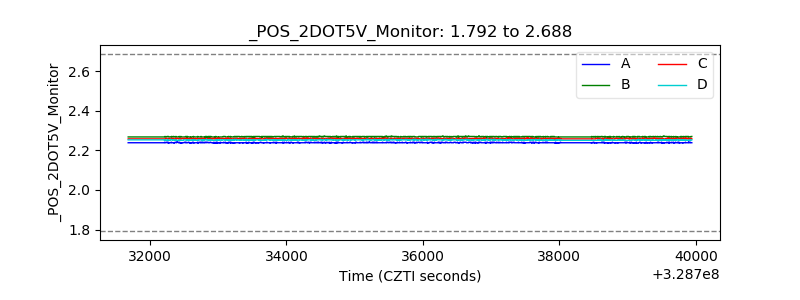 |
| +5 Volts monitor |  |
| _ROLL_ROT | 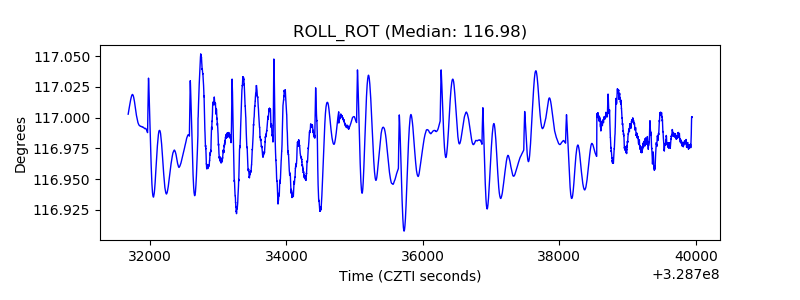 |
| _Roll_DEC |  |
| _Roll_RA | 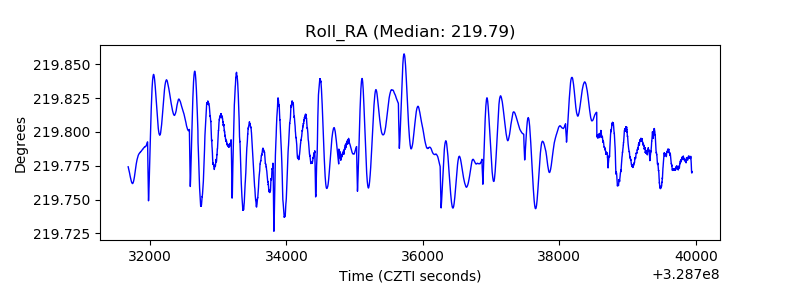 |
| Veto Counter | 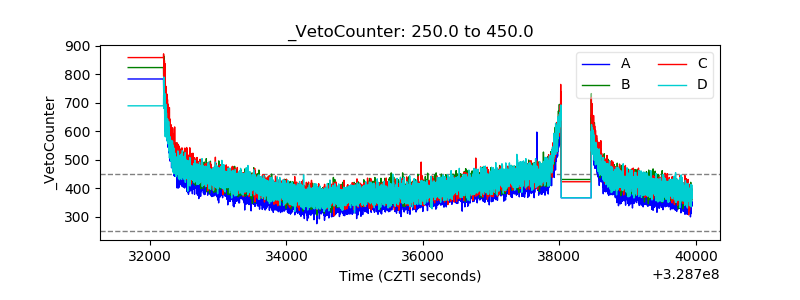 |