| Param | Original file | Final file |
|---|---|---|
| Filename | modeM0/AS1A09_022T01_9000003702_25292cztM0_level2.evt | modeM0/AS1A09_022T01_9000003702_25292cztM0_level2_quad_clean.evt |
| Size (bytes) | 634,861,440 | 114,050,880 |
| Size | 605.5 MB | 108.8 MB |
| Events in quadrant A | 3,597,063 | 773,706 |
| Events in quadrant B | 3,643,062 | 778,233 |
| Events in quadrant C | 3,617,749 | 753,579 |
| Events in quadrant D | 7,858,444 | 624,130 |
| Mode M9 | |||
|---|---|---|---|
| Quadrant | BADHDUFLAG | Total packets | Discarded packets |
| A | 0 | 6 | 0 |
| B | 0 | 6 | 0 |
| C | 0 | 6 | 0 |
| D | 0 | 6 | 0 |
| Mode M0 | |||
|---|---|---|---|
| Quadrant | BADHDUFLAG | Total packets | Discarded packets |
| A | 0 | 15789 | 0 |
| B | 0 | 15871 | 0 |
| C | 0 | 15734 | 0 |
| D | 0 | 28569 | 0 |
| Quadrant | Total seconds | Saturated seconds | Saturation percentage |
|---|---|---|---|
| A | 7523 | 48 | 0.638043% |
| B | 7524 | 89 | 1.182881% |
| C | 7524 | 128 | 1.701223% |
| D | 7523 | 1561 | 20.749701% |
Noise dominated data is calculated using 1-second bins in cleaned event files. If a bin has >2000 counts, and if more than 50% of those come from <1% of pixels, then it is considered to be noise-dominated and hence unusable.
| Quadrant | # 1 sec bins | Bins with >0 counts | Bins with >2000 counts | High rate bins dominated by noise | Noise dominated (total time) | Noise dominated (detector-on time) | Marked lightcurve |
|---|---|---|---|---|---|---|---|
| A | 8178 | 7525 | 0 | 0 | 0.00% | 0.00% | 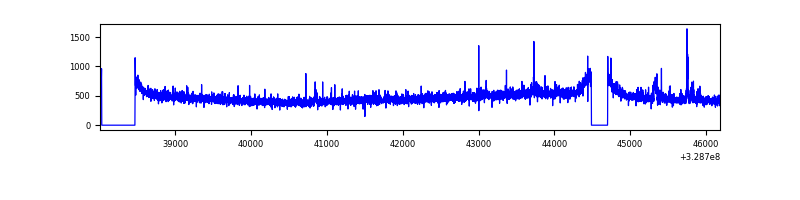 |
| B | 8179 | 7526 | 0 | 0 | 0.00% | 0.00% | 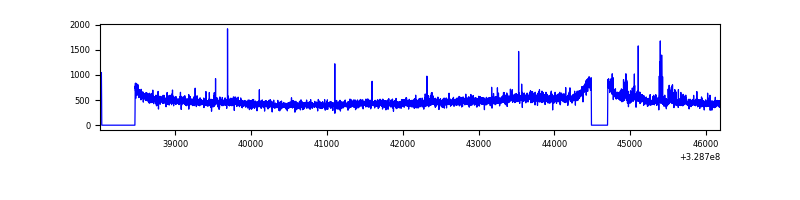 |
| C | 8179 | 7526 | 2 | 2 | 0.02% | 0.03% | 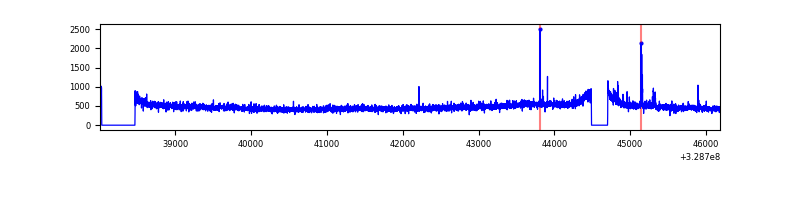 |
| D | 8177 | 7523 | 1197 | 1197 | 14.64% | 15.91% | 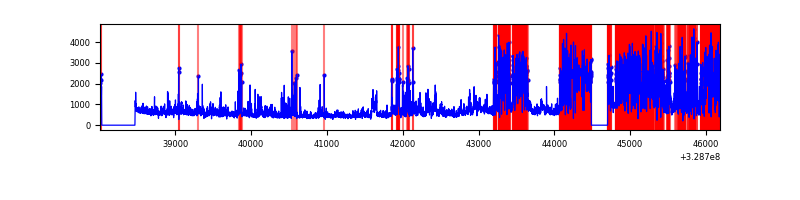 |
Top three noisy pixels from each quadrant. If the there are fewer than three noisy pixels in the level2.evt file, extra rows are filled as -1
| Pixel properties | Quadrant properties | ||||||
|---|---|---|---|---|---|---|---|
| Quadrant | DetID | PixID | Counts | Sigma | Mean | Median | Sigma |
| A | 6 | 16 | 86443 | 467.47 | 905 | 886 | 183.0 |
| A | 15 | 173 | 13478 | 68.8 | 905 | 886 | 183.0 |
| A | 13 | 254 | 12407 | 62.95 | 905 | 886 | 183.0 |
| B | 3 | 112 | 68921 | 399.18 | 901 | 878 | 170.5 |
| B | 12 | 111 | 20545 | 115.38 | 901 | 878 | 170.5 |
| B | 11 | 111 | 18428 | 102.96 | 901 | 878 | 170.5 |
| C | 14 | 238 | 138678 | 671.7 | 878 | 882 | 205.1 |
| C | 0 | 239 | 32524 | 154.24 | 878 | 882 | 205.1 |
| C | 2 | 16 | 7726 | 33.36 | 878 | 882 | 205.1 |
| D | 7 | 38 | 1912251 | 10102.37 | 781 | 759 | 189.2 |
| D | 12 | 233 | 1707699 | 9021.3 | 781 | 759 | 189.2 |
| D | 1 | 52 | 763061 | 4028.82 | 781 | 759 | 189.2 |
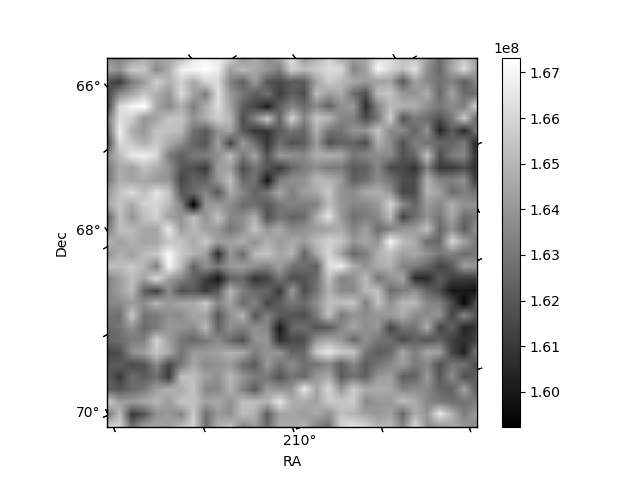
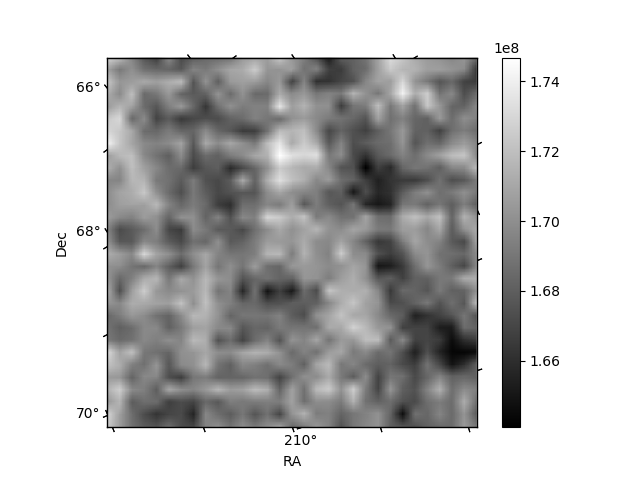
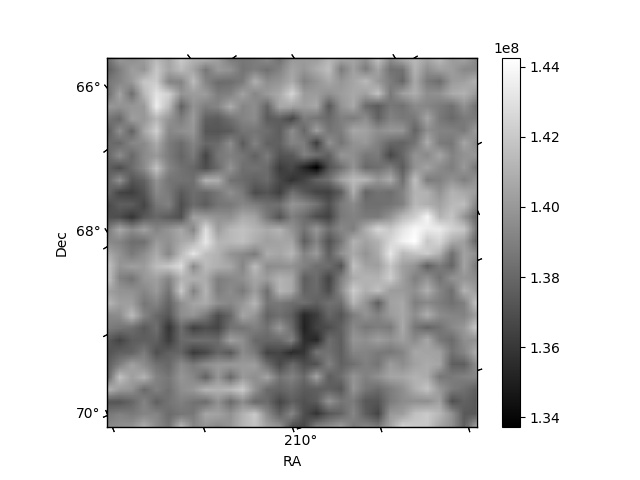
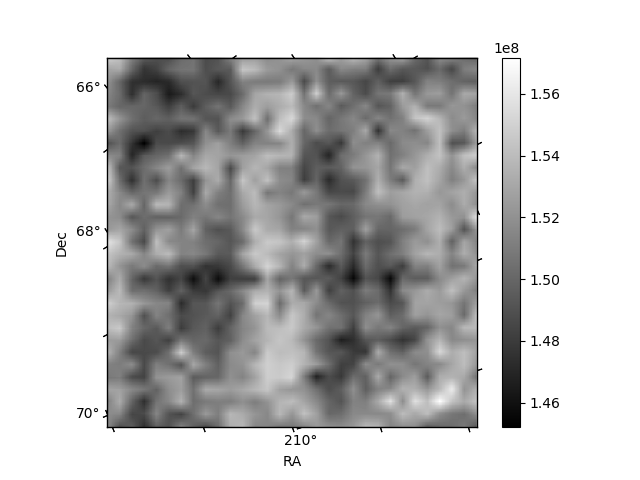
Histogram calculated using DETX and DETY for each event in the final _common_clean file
| Quadrant A |  |
 |
Quadrant B |
|---|---|---|---|
| Quadrant D |  |
 |
Quadrant C |
| Plot type | Count rate plots | Images |
|---|---|---|
| Comparison with Poisson distribution Blue bars denote a histogram of data divided into 1 sec bins. Red curve is a Poisson curve with rate = median count rate of data. |
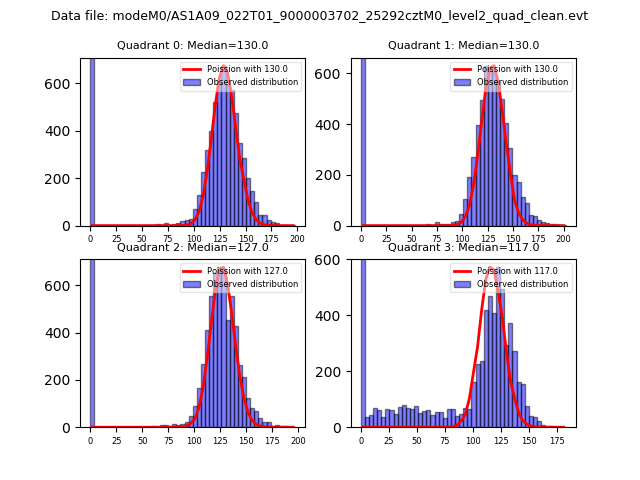 |
 |
| Quadrant-wise count rates Data is divided into 100 sec bins |
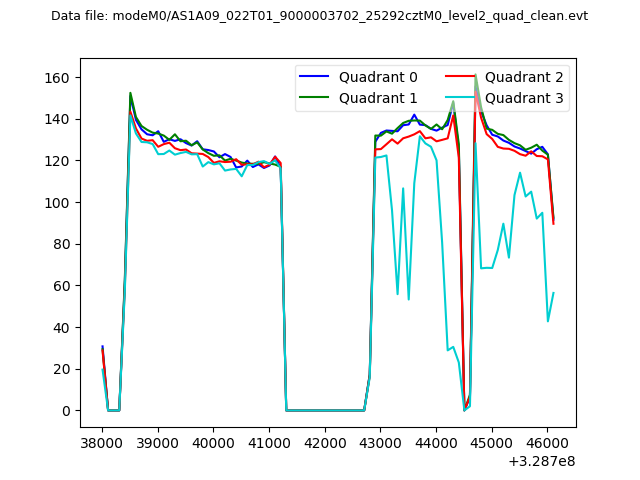 |
|
| Module-wise count rates for Quadrant A Data is divided into 100 sec bins |
 |
 |
| Module-wise count rates for Quadrant B Data is divided into 100 sec bins |
 |
 |
| Module-wise count rates for Quadrant C Data is divided into 100 sec bins |
 |
 |
| Module-wise count rates for Quadrant D Data is divided into 100 sec bins |
 |
 |
| Parameter | Plot |
|---|---|
| CZT HV Monitor |  |
| D_VDD |  |
| Temperature 1 |  |
| Veto HV Monitor |  |
| Veto LLD |  |
| Alpha Counter | 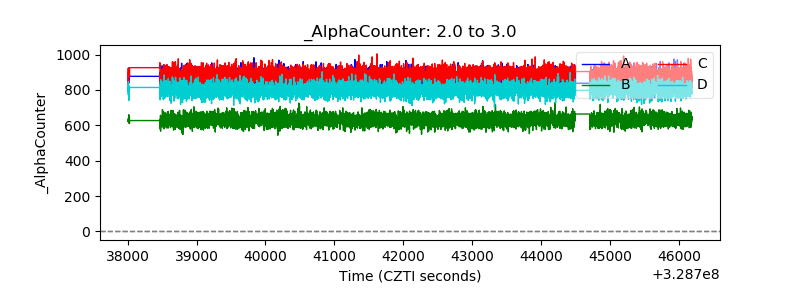 |
| _CPM_Rate | 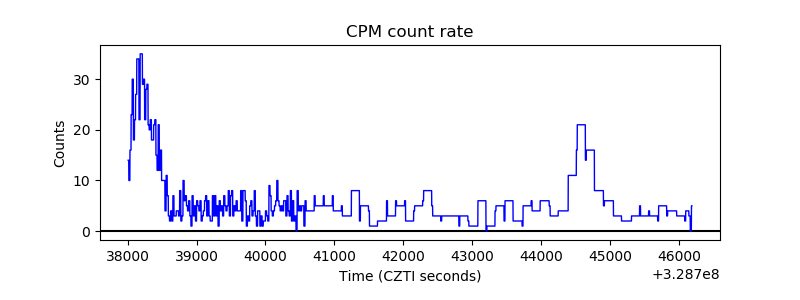 |
| CZT Counter |  |
| +2.5 Volts monitor |  |
| +5 Volts monitor |  |
| _ROLL_ROT |  |
| _Roll_DEC |  |
| _Roll_RA |  |
| Veto Counter |  |