| Param | Original file | Final file |
|---|---|---|
| Filename | modeM0/AS1A09_022T01_9000003702_25295cztM0_level2.evt | modeM0/AS1A09_022T01_9000003702_25295cztM0_level2_quad_clean.evt |
| Size (bytes) | 1,255,155,840 | 179,844,480 |
| Size | 1.2 GB | 171.5 MB |
| Events in quadrant A | 8,061,324 | 1,175,510 |
| Events in quadrant B | 10,024,013 | 1,161,640 |
| Events in quadrant C | 6,175,324 | 1,176,694 |
| Events in quadrant D | 12,866,924 | 1,025,265 |
| Mode M9 | |||
|---|---|---|---|
| Quadrant | BADHDUFLAG | Total packets | Discarded packets |
| A | 0 | 15 | 0 |
| B | 0 | 15 | 0 |
| C | 0 | 15 | 0 |
| D | 0 | 15 | 0 |
| Mode M0 | |||
|---|---|---|---|
| Quadrant | BADHDUFLAG | Total packets | Discarded packets |
| A | 0 | 32622 | 0 |
| B | 0 | 38515 | 0 |
| C | 0 | 26952 | 0 |
| D | 0 | 47044 | 0 |
| Quadrant | Total seconds | Saturated seconds | Saturation percentage |
|---|---|---|---|
| A | 13112 | 636 | 4.850519% |
| B | 13113 | 1232 | 9.395257% |
| C | 13112 | 125 | 0.953325% |
| D | 13112 | 2245 | 17.121721% |
Noise dominated data is calculated using 1-second bins in cleaned event files. If a bin has >2000 counts, and if more than 50% of those come from <1% of pixels, then it is considered to be noise-dominated and hence unusable.
| Quadrant | # 1 sec bins | Bins with >0 counts | Bins with >2000 counts | High rate bins dominated by noise | Noise dominated (total time) | Noise dominated (detector-on time) | Marked lightcurve |
|---|---|---|---|---|---|---|---|
| A | 14707 | 13116 | 368 | 368 | 2.50% | 2.81% | 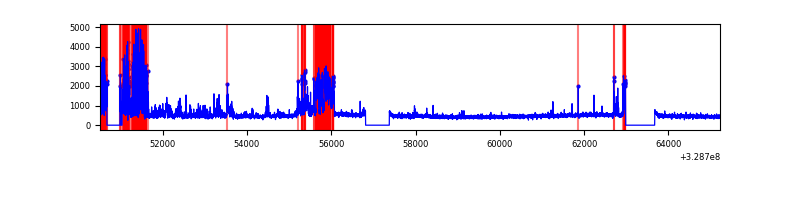 |
| B | 14708 | 13117 | 785 | 785 | 5.34% | 5.98% | 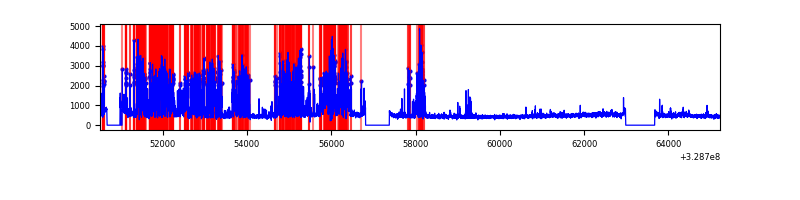 |
| C | 14707 | 13116 | 1 | 1 | 0.01% | 0.01% | 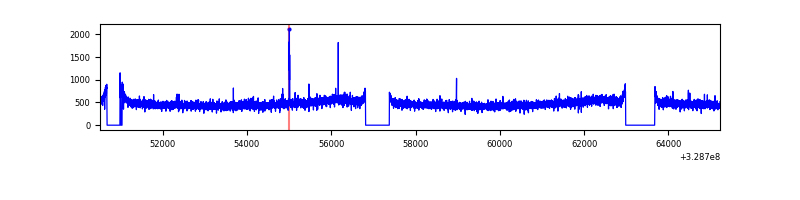 |
| D | 14707 | 13114 | 1812 | 1812 | 12.32% | 13.82% | 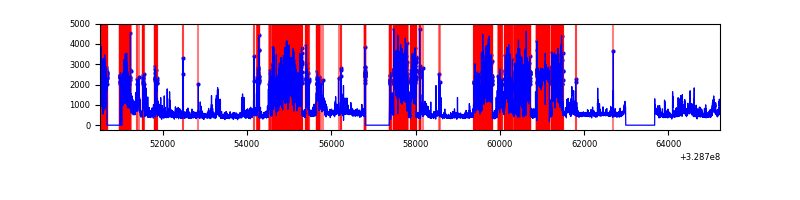 |
Top three noisy pixels from each quadrant. If the there are fewer than three noisy pixels in the level2.evt file, extra rows are filled as -1
| Pixel properties | Quadrant properties | ||||||
|---|---|---|---|---|---|---|---|
| Quadrant | DetID | PixID | Counts | Sigma | Mean | Median | Sigma |
| A | 6 | 16 | 2151916 | 7066.38 | 1525 | 1490 | 304.3 |
| A | 13 | 254 | 20797 | 63.44 | 1525 | 1490 | 304.3 |
| A | 15 | 173 | 14616 | 43.13 | 1525 | 1490 | 304.3 |
| B | 3 | 112 | 3066287 | 10717.54 | 1502 | 1460 | 286.0 |
| B | 3 | 64 | 992186 | 3464.52 | 1502 | 1460 | 286.0 |
| B | 0 | 190 | 39976 | 134.69 | 1502 | 1460 | 286.0 |
| C | 14 | 238 | 236728 | 670.78 | 1498 | 1507 | 350.7 |
| C | 3 | 233 | 45842 | 126.43 | 1498 | 1507 | 350.7 |
| C | 9 | 54 | 23031 | 61.38 | 1498 | 1507 | 350.7 |
| D | 12 | 235 | 6058476 | 18132.29 | 1389 | 1349 | 334.1 |
| D | 8 | 195 | 409396 | 1221.51 | 1389 | 1349 | 334.1 |
| D | 12 | 233 | 398802 | 1189.79 | 1389 | 1349 | 334.1 |
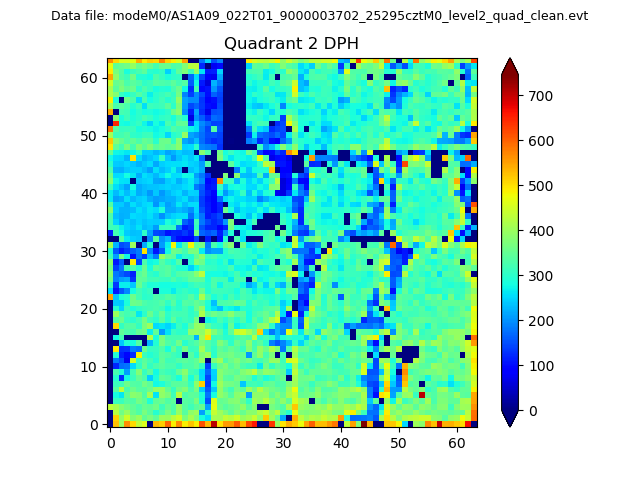
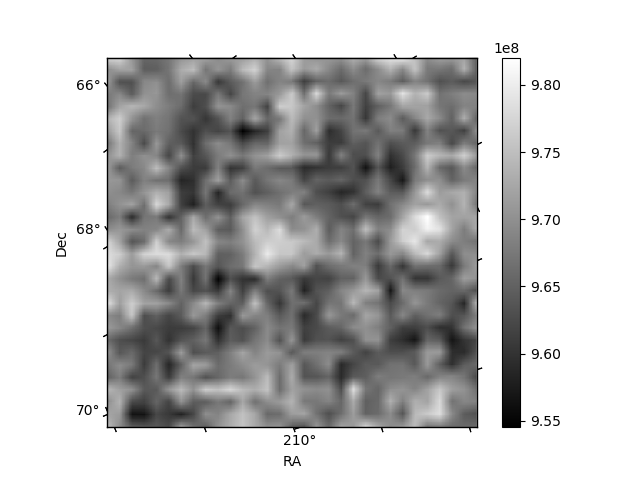
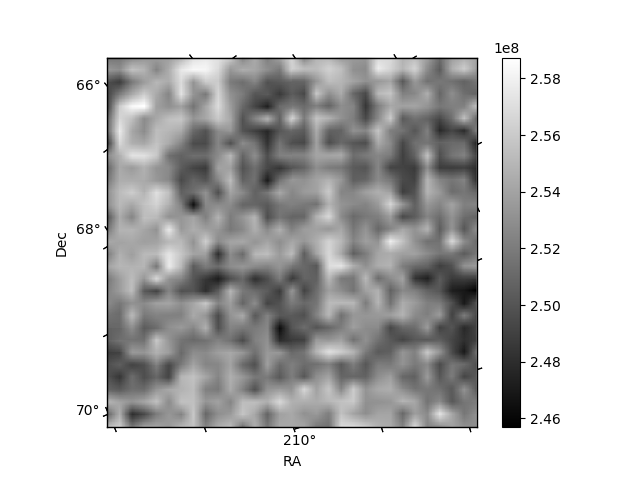
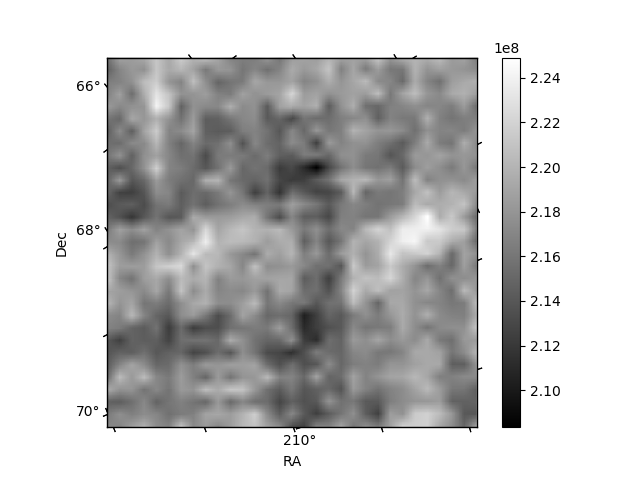
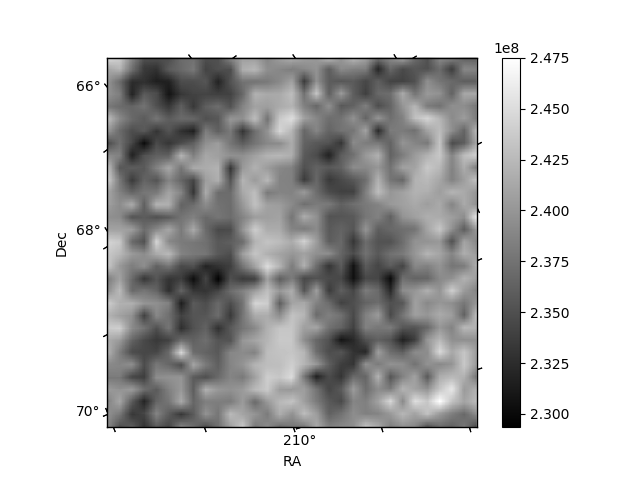
Histogram calculated using DETX and DETY for each event in the final _common_clean file
| Quadrant A | 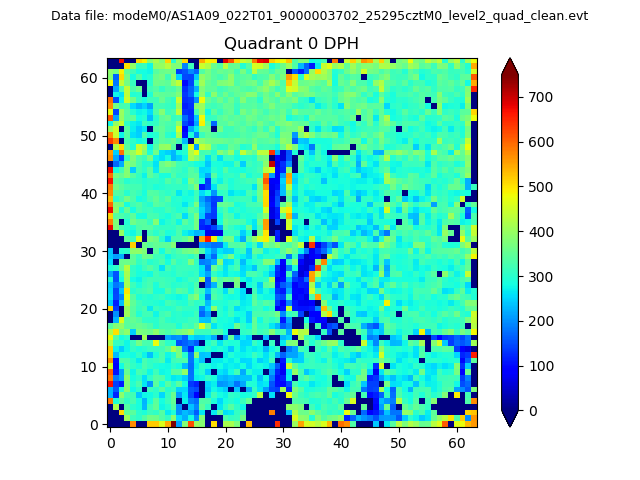 |
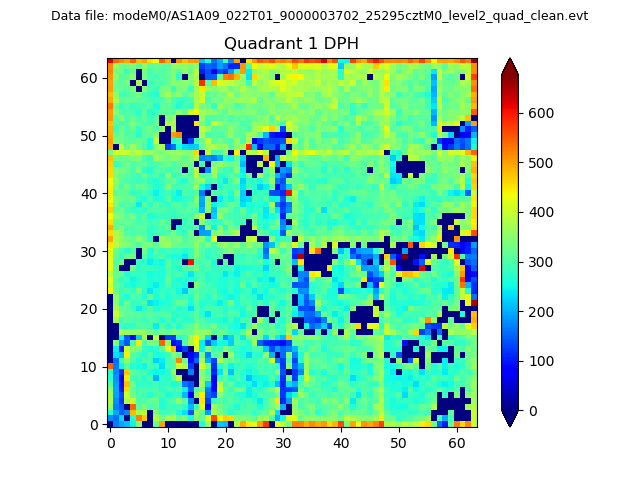 |
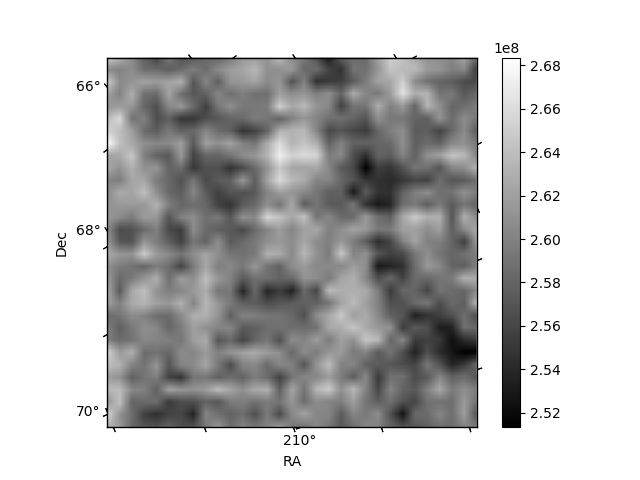
Quadrant B |
|---|---|---|---|
| Quadrant D | 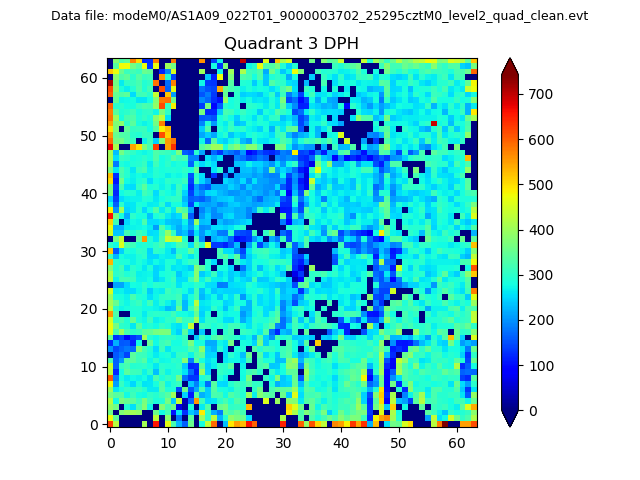 |
 |
Quadrant C |
| Plot type | Count rate plots | Images |
|---|---|---|
| Comparison with Poisson distribution Blue bars denote a histogram of data divided into 1 sec bins. Red curve is a Poisson curve with rate = median count rate of data. |
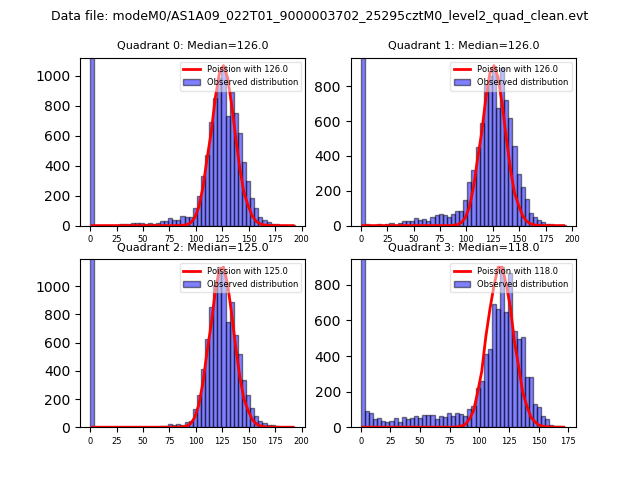 |
 |
| Quadrant-wise count rates Data is divided into 100 sec bins |
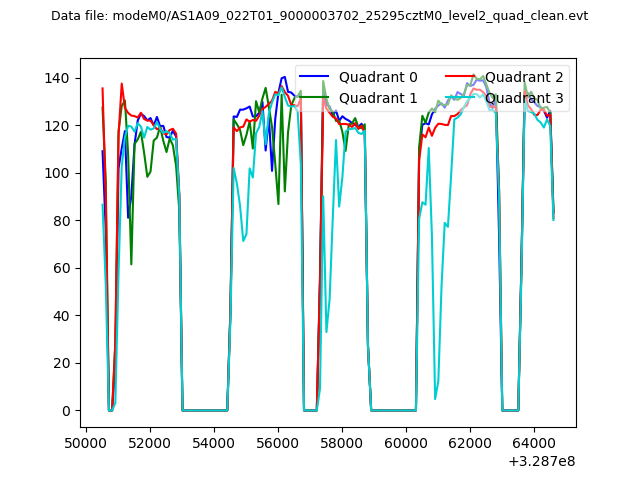 |
|
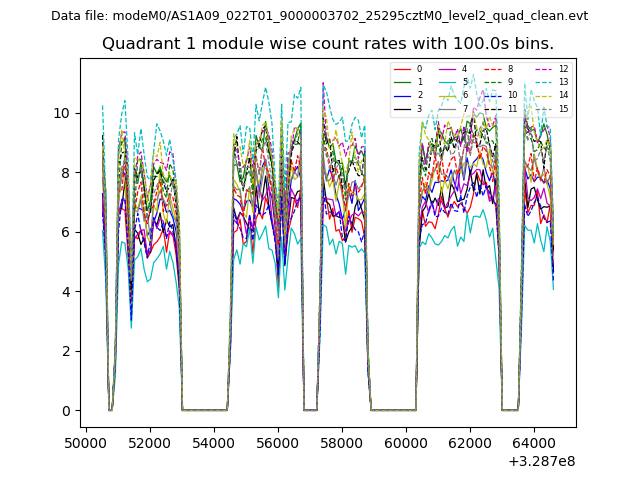
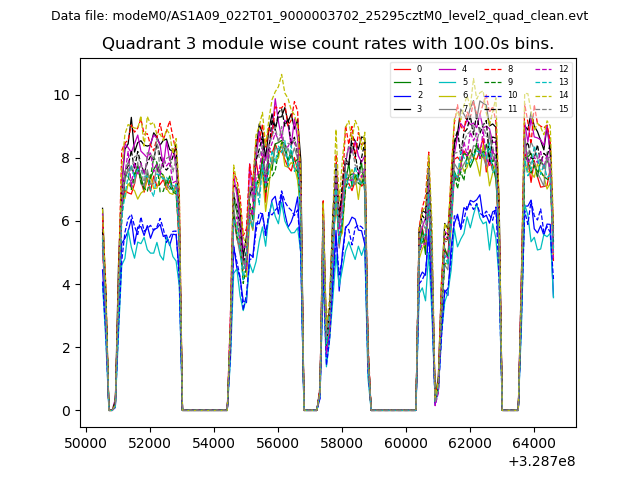
| Module-wise count rates for Quadrant A Data is divided into 100 sec bins |
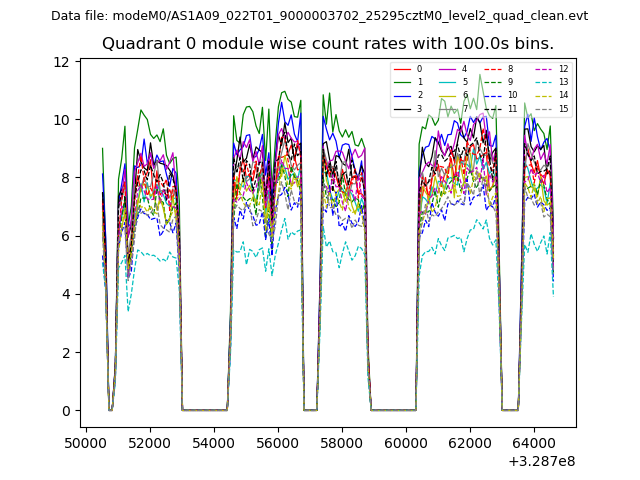 |
 |
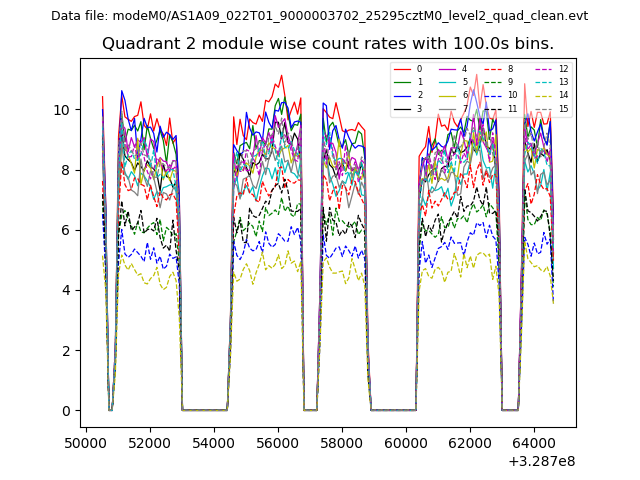
| Module-wise count rates for Quadrant B Data is divided into 100 sec bins |
 |
 |
| Module-wise count rates for Quadrant C Data is divided into 100 sec bins |
 |
 |
| Module-wise count rates for Quadrant D Data is divided into 100 sec bins |
 |
 |
| Parameter | Plot |
|---|---|
| CZT HV Monitor | 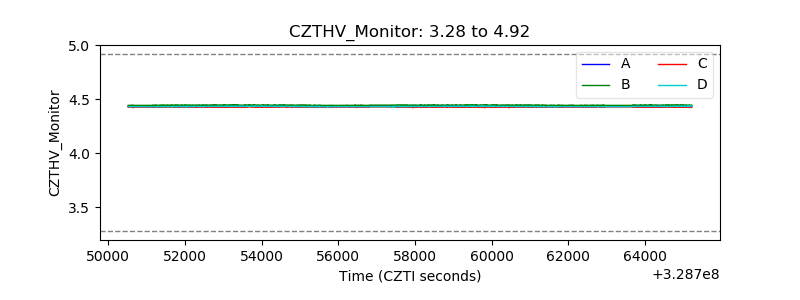 |
| D_VDD | 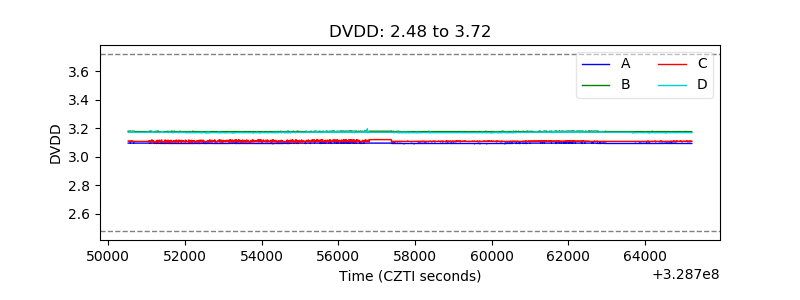 |
| Temperature 1 | 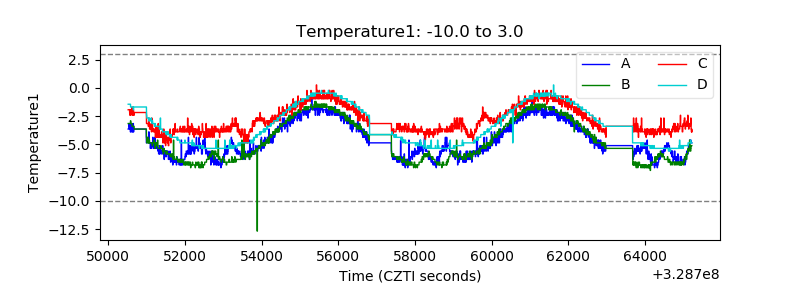 |
| Veto HV Monitor | 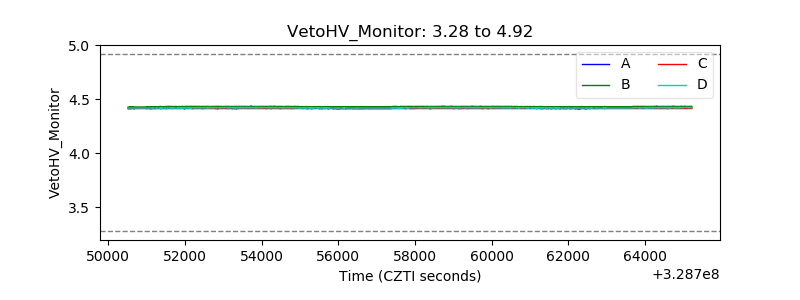 |
| Veto LLD | 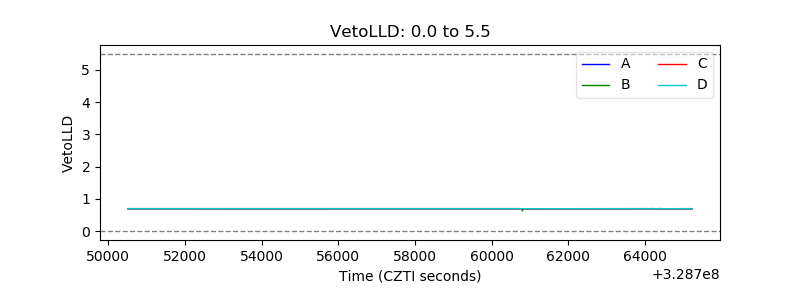 |
| Alpha Counter | 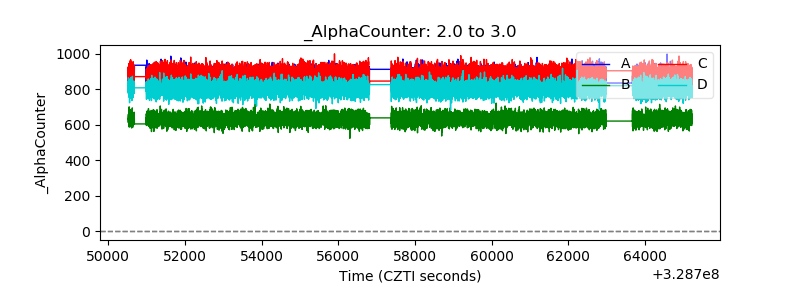 |
| _CPM_Rate | 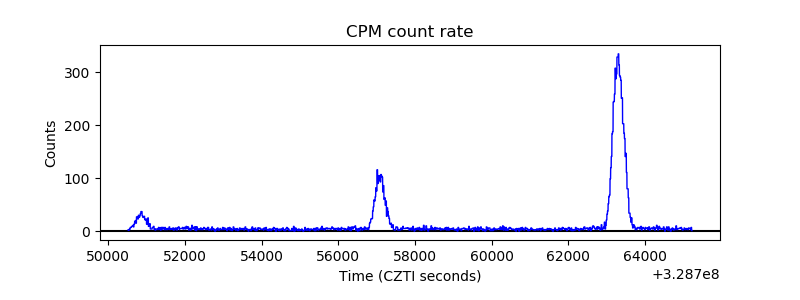 |
| CZT Counter | 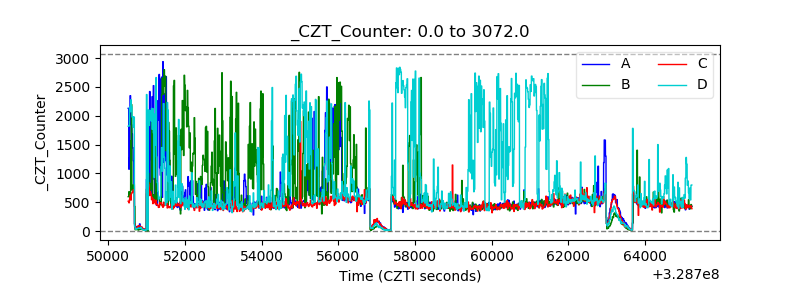 |
| +2.5 Volts monitor |  |
| +5 Volts monitor |  |
| _ROLL_ROT | 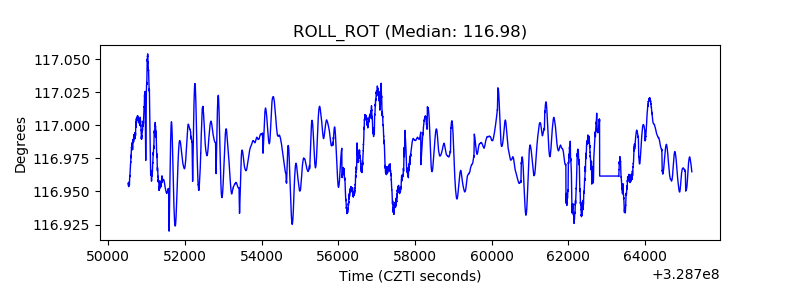 |
| _Roll_DEC | 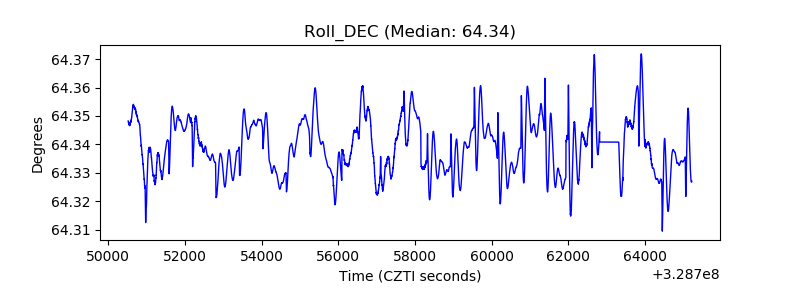 |
| _Roll_RA | 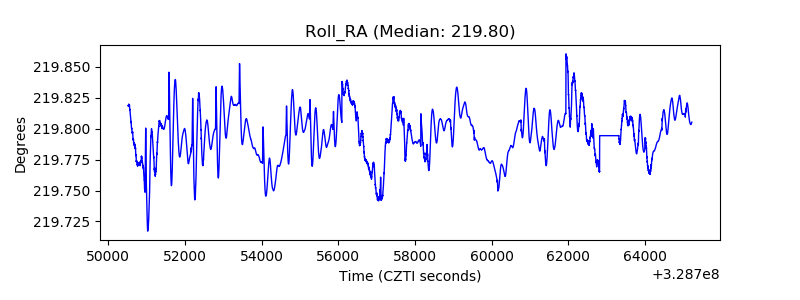 |
| Veto Counter | 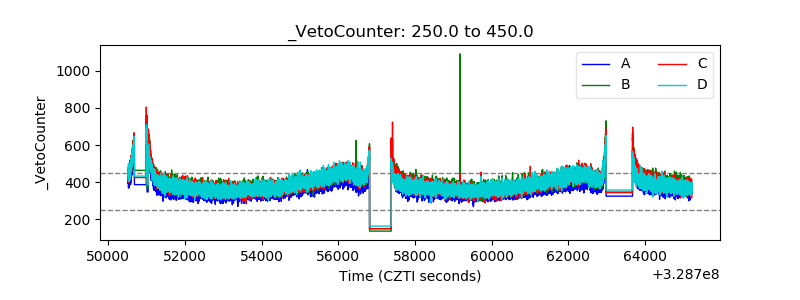 |