| Param | Original file | Final file |
|---|---|---|
| Filename | modeM0/AS1A09_022T01_9000003702_25296cztM0_level2.evt | modeM0/AS1A09_022T01_9000003702_25296cztM0_level2_quad_clean.evt |
| Size (bytes) | 463,115,520 | 90,423,360 |
| Size | 441.7 MB | 86.2 MB |
| Events in quadrant A | 3,194,079 | 575,480 |
| Events in quadrant B | 3,332,840 | 578,400 |
| Events in quadrant C | 3,257,834 | 555,050 |
| Events in quadrant D | 3,771,437 | 548,126 |
| Mode M9 | |||
|---|---|---|---|
| Quadrant | BADHDUFLAG | Total packets | Discarded packets |
| A | 0 | 10 | 0 |
| B | 0 | 11 | 0 |
| C | 0 | 11 | 0 |
| D | 0 | 11 | 0 |
| Mode M0 | |||
|---|---|---|---|
| Quadrant | BADHDUFLAG | Total packets | Discarded packets |
| A | 0 | 13985 | 0 |
| B | 0 | 14254 | 0 |
| C | 0 | 14083 | 0 |
| D | 0 | 15689 | 0 |
| Quadrant | Total seconds | Saturated seconds | Saturation percentage |
|---|---|---|---|
| A | 6908 | 43 | 0.622467% |
| B | 6908 | 50 | 0.723798% |
| C | 6908 | 66 | 0.955414% |
| D | 6908 | 39 | 0.564563% |
Noise dominated data is calculated using 1-second bins in cleaned event files. If a bin has >2000 counts, and if more than 50% of those come from <1% of pixels, then it is considered to be noise-dominated and hence unusable.
| Quadrant | # 1 sec bins | Bins with >0 counts | Bins with >2000 counts | High rate bins dominated by noise | Noise dominated (total time) | Noise dominated (detector-on time) | Marked lightcurve |
|---|---|---|---|---|---|---|---|
| A | 7783 | 6909 | 0 | 0 | 0.00% | 0.00% | 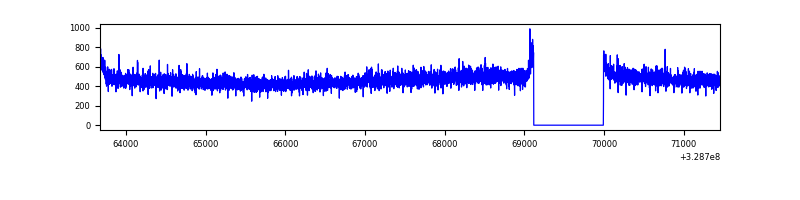 |
| B | 7783 | 6909 | 2 | 2 | 0.03% | 0.03% | 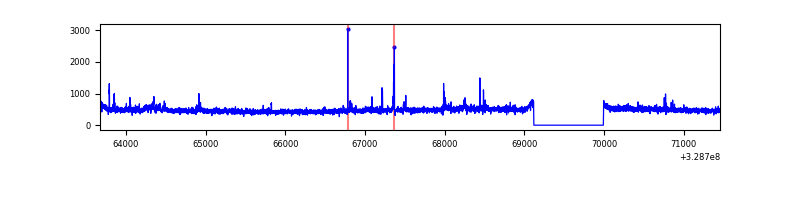 |
| C | 7783 | 6909 | 0 | 0 | 0.00% | 0.00% | 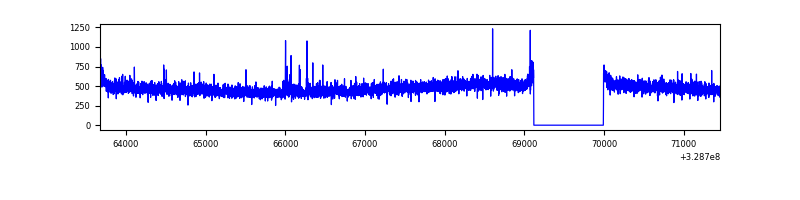 |
| D | 7783 | 6909 | 4 | 4 | 0.05% | 0.06% | 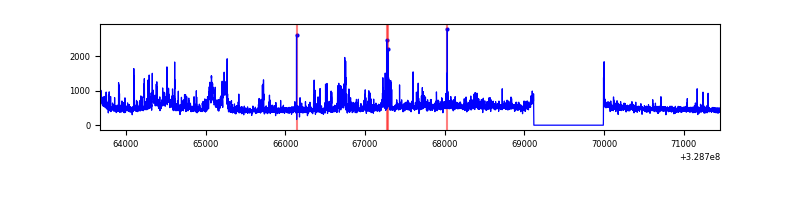 |
Top three noisy pixels from each quadrant. If the there are fewer than three noisy pixels in the level2.evt file, extra rows are filled as -1
| Pixel properties | Quadrant properties | ||||||
|---|---|---|---|---|---|---|---|
| Quadrant | DetID | PixID | Counts | Sigma | Mean | Median | Sigma |
| A | 13 | 254 | 11480 | 63.84 | 827 | 810 | 167.1 |
| A | 3 | 137 | 7427 | 39.59 | 827 | 810 | 167.1 |
| A | 0 | 226 | 7007 | 37.07 | 827 | 810 | 167.1 |
| B | 3 | 112 | 41605 | 256.95 | 823 | 801 | 158.8 |
| B | 0 | 190 | 41290 | 254.97 | 823 | 801 | 158.8 |
| B | 12 | 111 | 19190 | 115.8 | 823 | 801 | 158.8 |
| C | 14 | 238 | 126470 | 678.3 | 793 | 796 | 185.3 |
| C | 3 | 233 | 30934 | 162.66 | 793 | 796 | 185.3 |
| C | 13 | 61 | 5541 | 25.61 | 793 | 796 | 185.3 |
| D | 1 | 52 | 340574 | 1742.23 | 801 | 777 | 195.0 |
| D | 8 | 195 | 247316 | 1264.07 | 801 | 777 | 195.0 |
| D | 12 | 233 | 107578 | 547.6 | 801 | 777 | 195.0 |
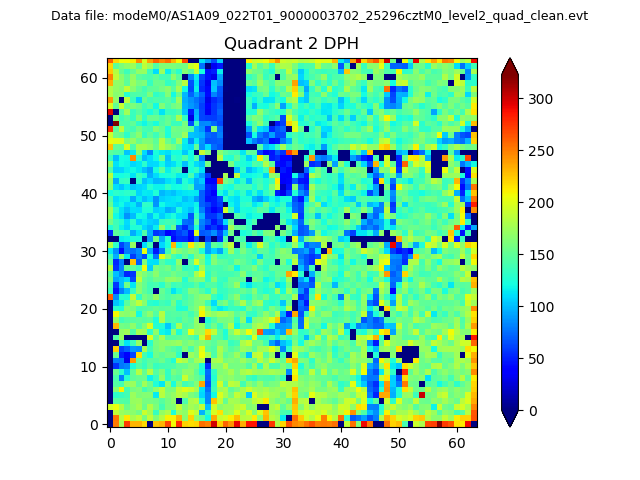
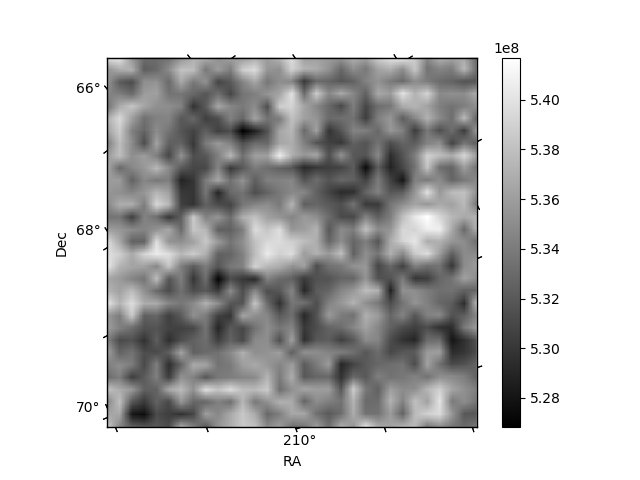
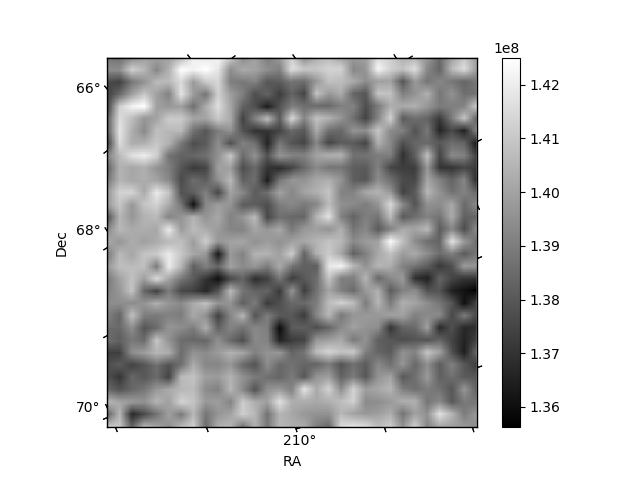
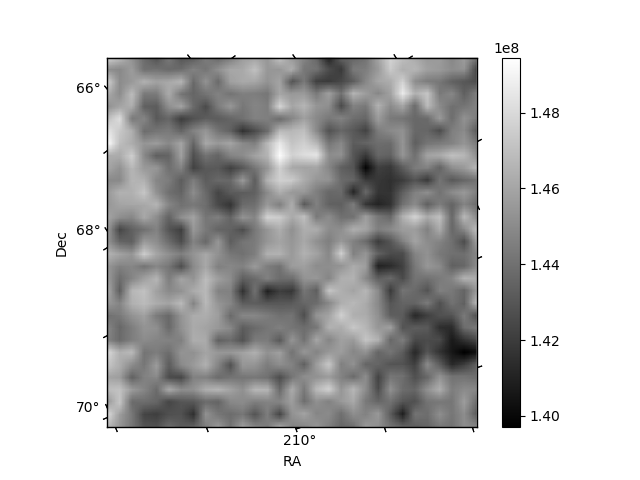
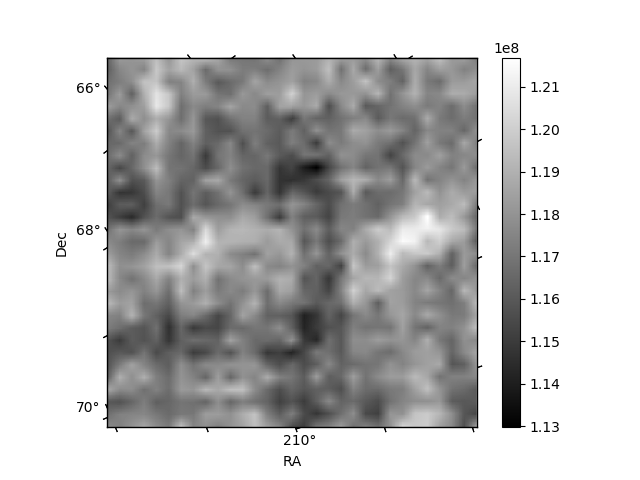
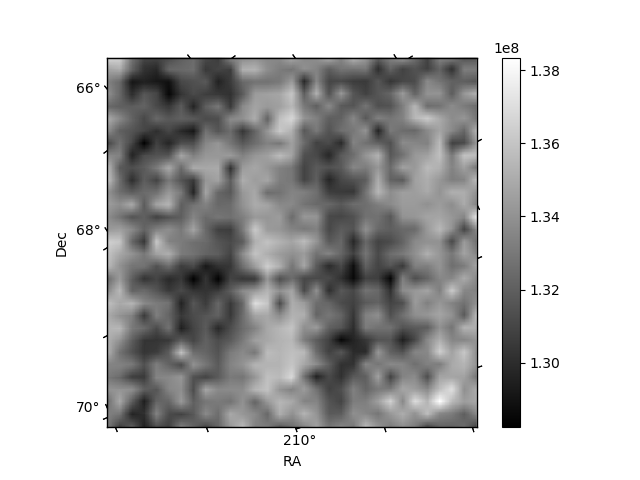
Histogram calculated using DETX and DETY for each event in the final _common_clean file
| Quadrant A | 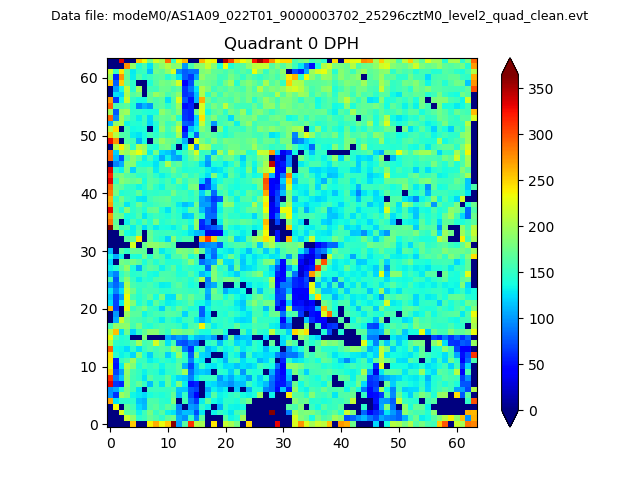 |
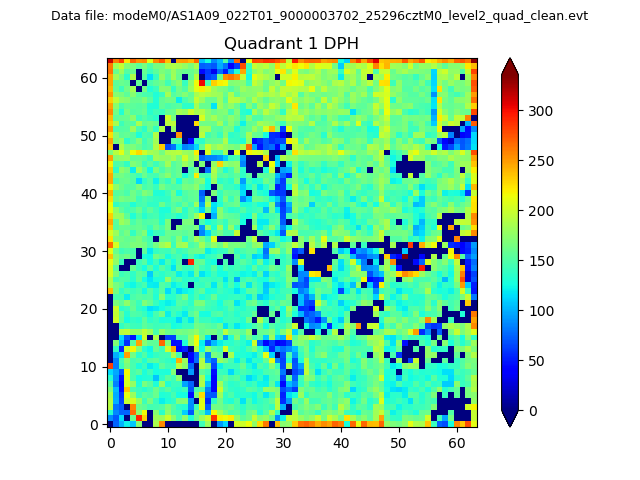 |
Quadrant B |
|---|---|---|---|
| Quadrant D | 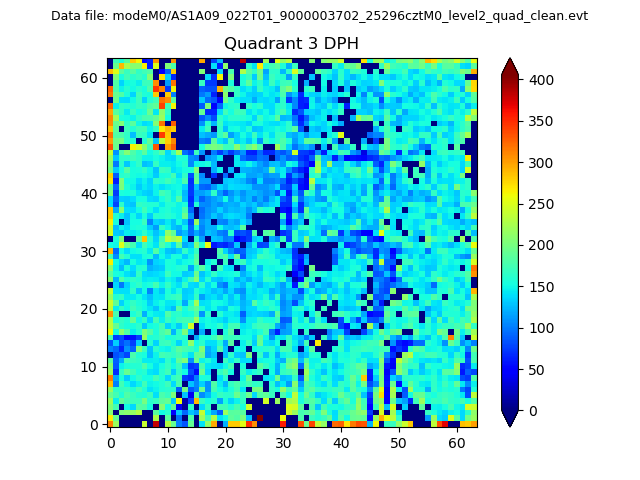 |
 |
Quadrant C |
| Plot type | Count rate plots | Images |
|---|---|---|
| Comparison with Poisson distribution Blue bars denote a histogram of data divided into 1 sec bins. Red curve is a Poisson curve with rate = median count rate of data. |
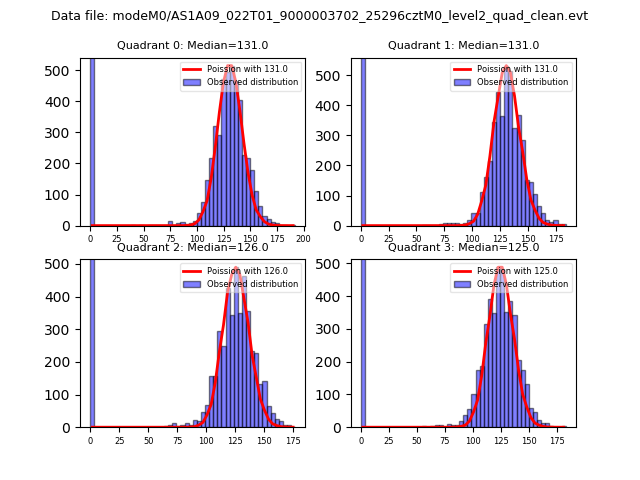 |
 |
| Quadrant-wise count rates Data is divided into 100 sec bins |
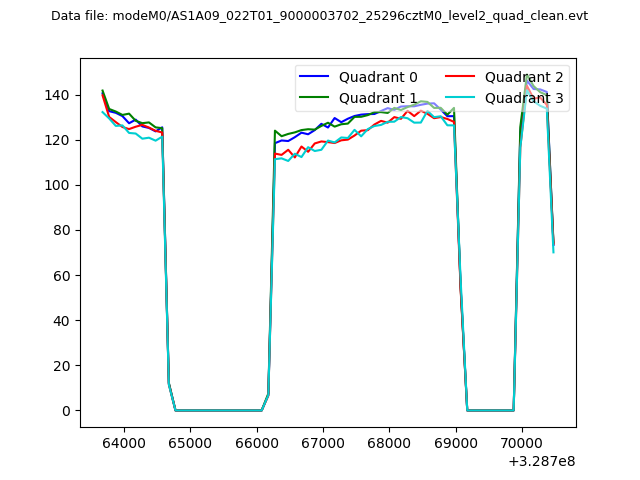 |
|
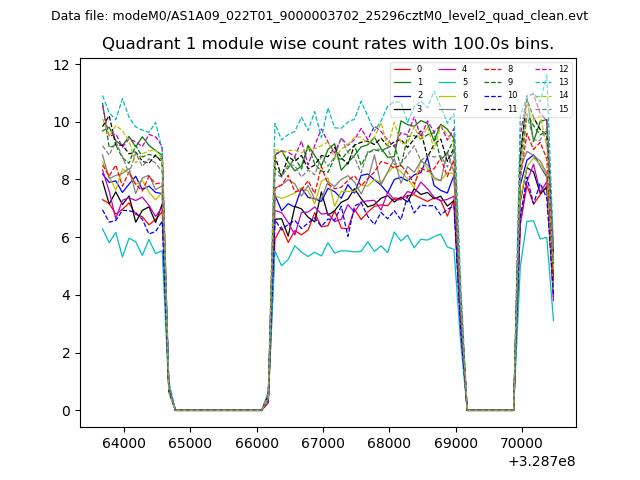
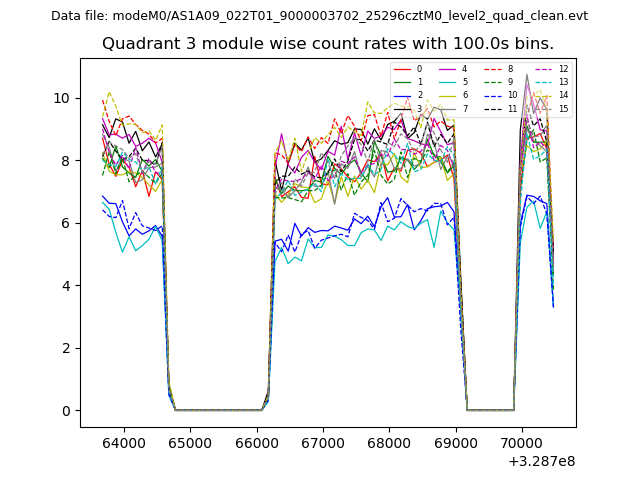
| Module-wise count rates for Quadrant A Data is divided into 100 sec bins |
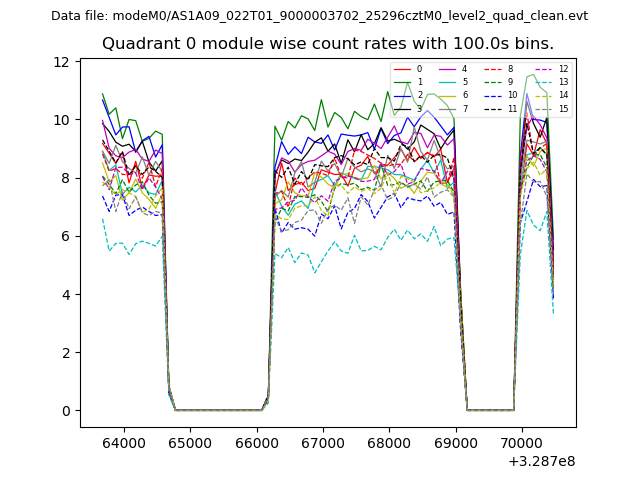 |
 |
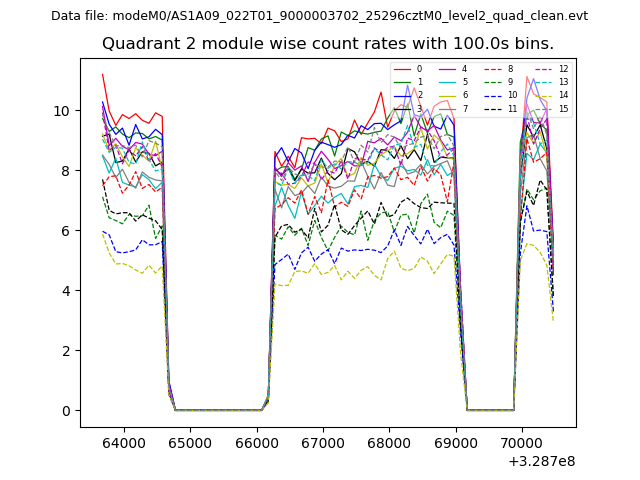
| Module-wise count rates for Quadrant B Data is divided into 100 sec bins |
 |
 |
| Module-wise count rates for Quadrant C Data is divided into 100 sec bins |
 |
 |
| Module-wise count rates for Quadrant D Data is divided into 100 sec bins |
 |
 |
| Parameter | Plot |
|---|---|
| CZT HV Monitor | 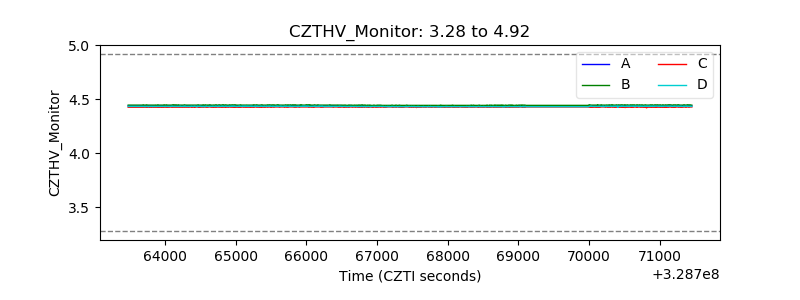 |
| D_VDD | 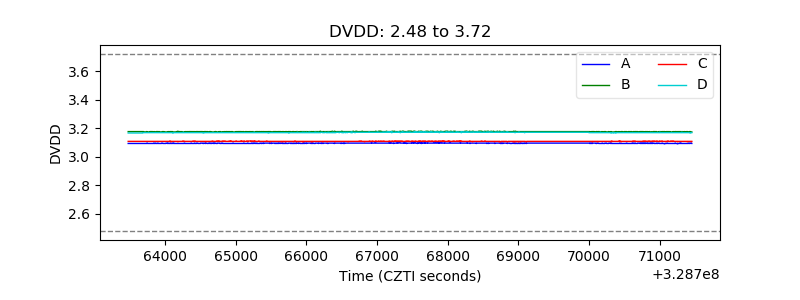 |
| Temperature 1 | 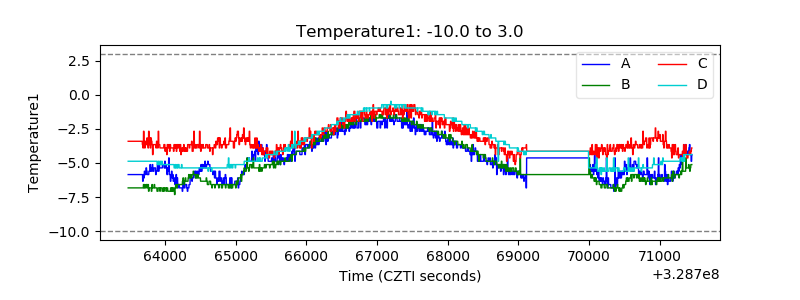 |
| Veto HV Monitor | 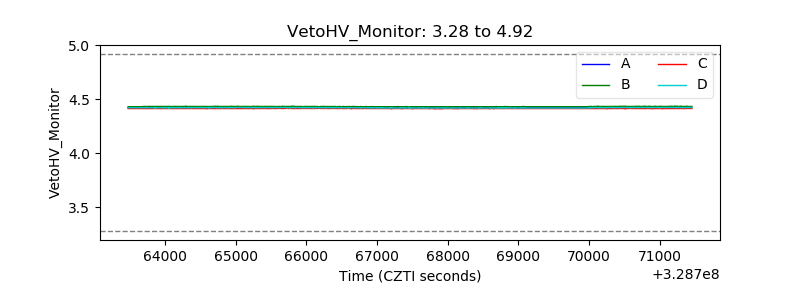 |
| Veto LLD | 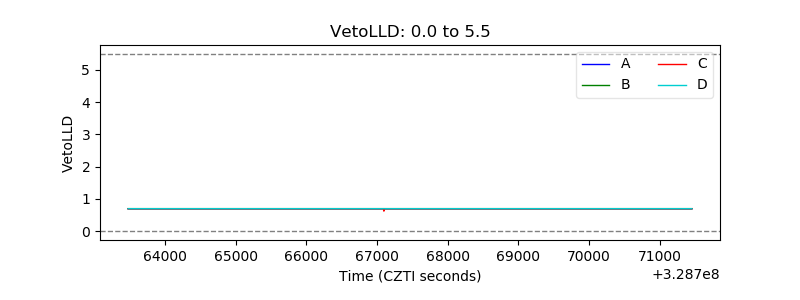 |
| Alpha Counter | 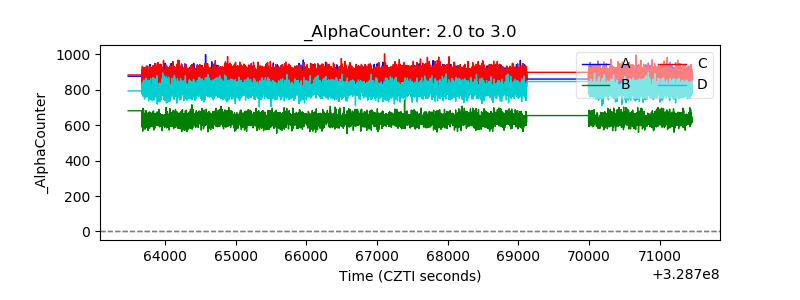 |
| _CPM_Rate | 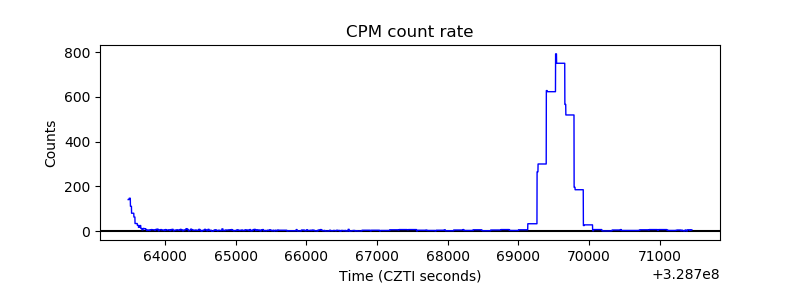 |
| CZT Counter | 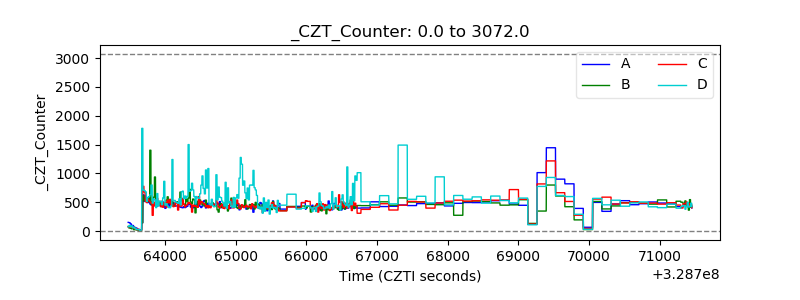 |
| +2.5 Volts monitor |  |
| +5 Volts monitor |  |
| _ROLL_ROT | 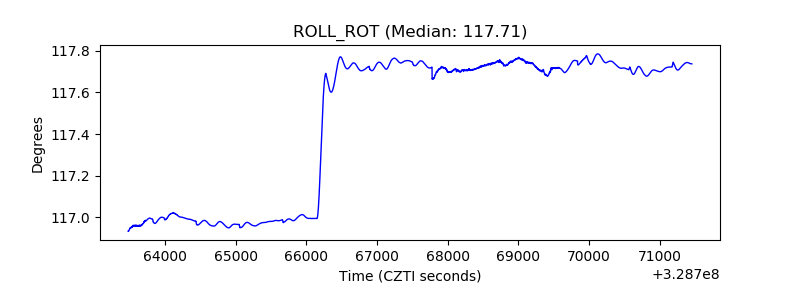 |
| _Roll_DEC | 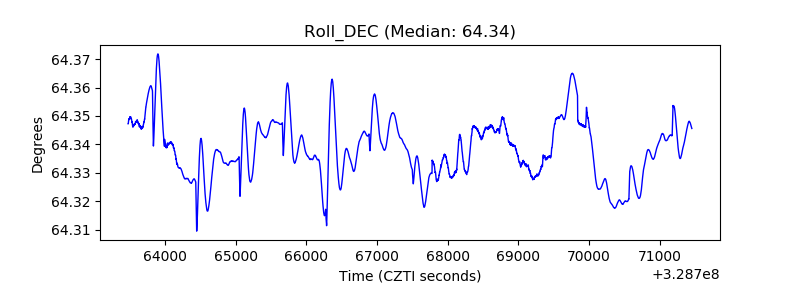 |
| _Roll_RA | 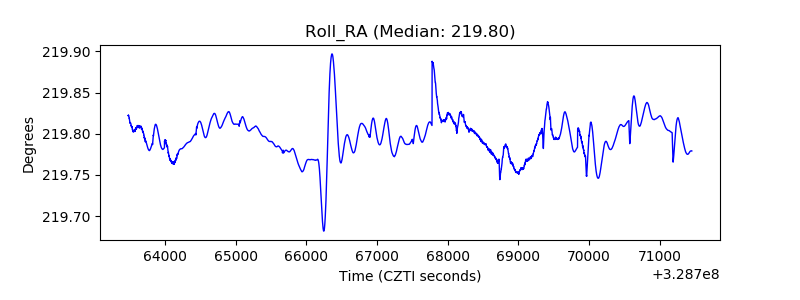 |
| Veto Counter | 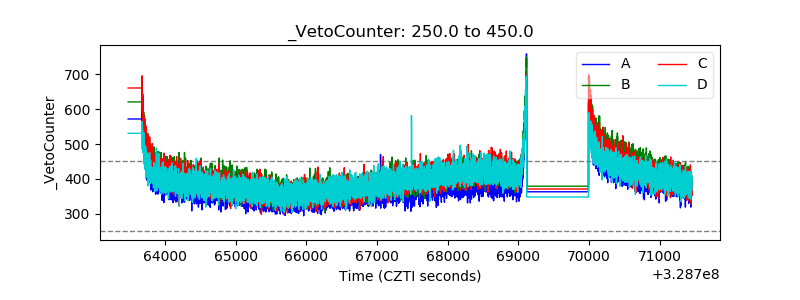 |