| Param | Original file | Final file |
|---|---|---|
| Filename | modeM0/AS1A09_022T01_9000003702_25297cztM0_level2.evt | modeM0/AS1A09_022T01_9000003702_25297cztM0_level2_quad_clean.evt |
| Size (bytes) | 537,926,400 | 80,095,680 |
| Size | 513.0 MB | 76.4 MB |
| Events in quadrant A | 3,276,806 | 509,941 |
| Events in quadrant B | 3,305,968 | 513,719 |
| Events in quadrant C | 3,227,470 | 487,351 |
| Events in quadrant D | 6,026,563 | 447,057 |
| Mode M9 | |||
|---|---|---|---|
| Quadrant | BADHDUFLAG | Total packets | Discarded packets |
| A | 0 | 19 | 0 |
| B | 0 | 19 | 0 |
| C | 0 | 19 | 0 |
| D | 0 | 19 | 0 |
| Mode M0 | |||
|---|---|---|---|
| Quadrant | BADHDUFLAG | Total packets | Discarded packets |
| A | 0 | 13894 | 0 |
| B | 0 | 13985 | 0 |
| C | 0 | 13798 | 0 |
| D | 0 | 22426 | 0 |
| Quadrant | Total seconds | Saturated seconds | Saturation percentage |
|---|---|---|---|
| A | 6699 | 73 | 1.089715% |
| B | 6699 | 94 | 1.403195% |
| C | 6699 | 103 | 1.537543% |
| D | 6699 | 684 | 10.210479% |
Noise dominated data is calculated using 1-second bins in cleaned event files. If a bin has >2000 counts, and if more than 50% of those come from <1% of pixels, then it is considered to be noise-dominated and hence unusable.
| Quadrant | # 1 sec bins | Bins with >0 counts | Bins with >2000 counts | High rate bins dominated by noise | Noise dominated (total time) | Noise dominated (detector-on time) | Marked lightcurve |
|---|---|---|---|---|---|---|---|
| A | 8594 | 6701 | 0 | 0 | 0.00% | 0.00% | 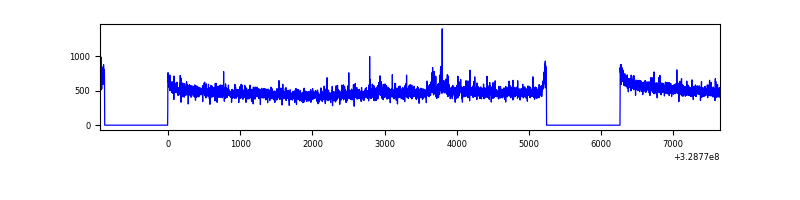 |
| B | 8594 | 6701 | 3 | 3 | 0.03% | 0.04% | 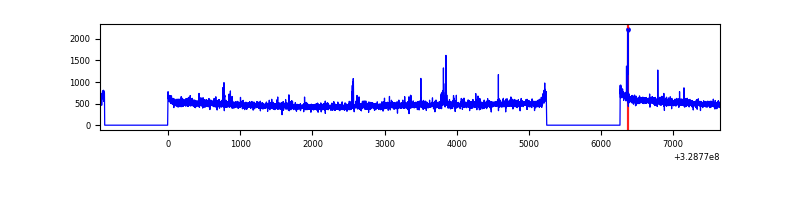 |
| C | 8594 | 6701 | 0 | 0 | 0.00% | 0.00% | 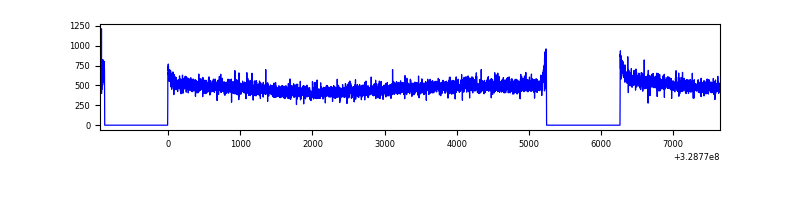 |
| D | 8594 | 6701 | 530 | 530 | 6.17% | 7.91% | 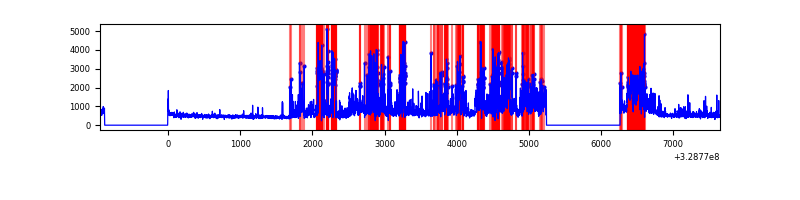 |
Top three noisy pixels from each quadrant. If the there are fewer than three noisy pixels in the level2.evt file, extra rows are filled as -1
| Pixel properties | Quadrant properties | ||||||
|---|---|---|---|---|---|---|---|
| Quadrant | DetID | PixID | Counts | Sigma | Mean | Median | Sigma |
| A | 6 | 16 | 54214 | 320.79 | 835 | 818 | 166.4 |
| A | 13 | 254 | 11189 | 62.31 | 835 | 818 | 166.4 |
| A | 3 | 137 | 7518 | 40.25 | 835 | 818 | 166.4 |
| B | 0 | 190 | 25008 | 153.75 | 827 | 807 | 157.4 |
| B | 12 | 111 | 19113 | 116.3 | 827 | 807 | 157.4 |
| B | 11 | 111 | 17005 | 102.91 | 827 | 807 | 157.4 |
| C | 14 | 238 | 127824 | 689.19 | 792 | 797 | 184.3 |
| C | 3 | 233 | 7478 | 36.25 | 792 | 797 | 184.3 |
| C | 13 | 61 | 5613 | 26.13 | 792 | 797 | 184.3 |
| D | 1 | 52 | 2356709 | 12492.53 | 774 | 750 | 188.6 |
| D | 12 | 233 | 442792 | 2343.94 | 774 | 750 | 188.6 |
| D | 8 | 195 | 164074 | 866.03 | 774 | 750 | 188.6 |
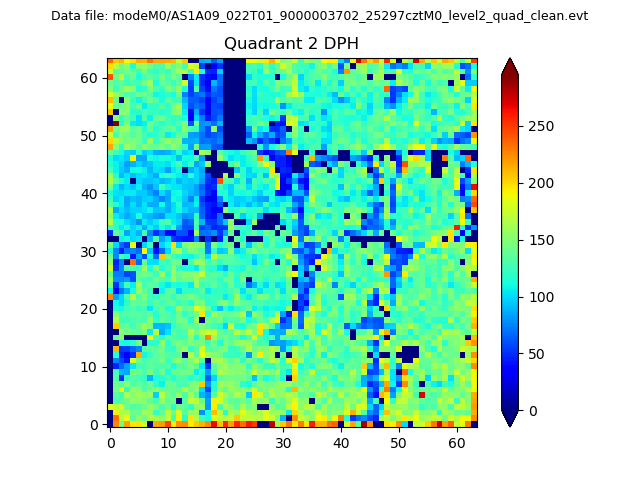
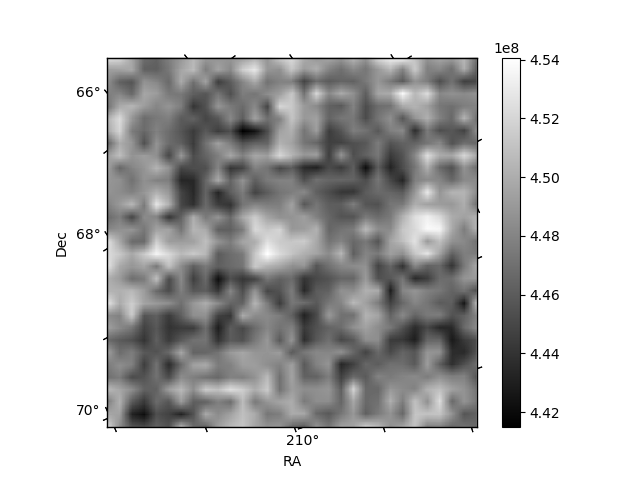
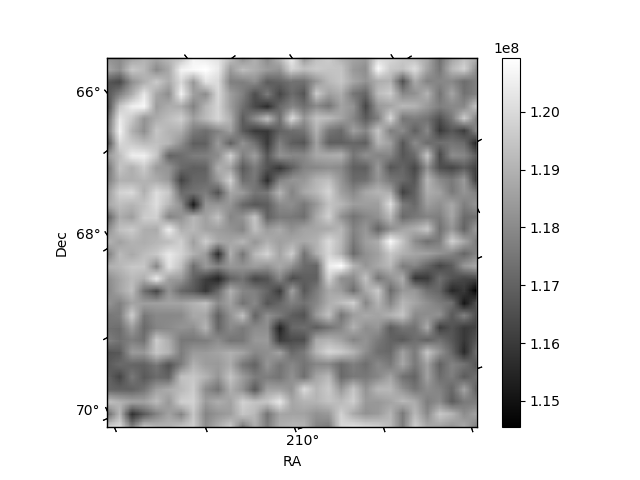
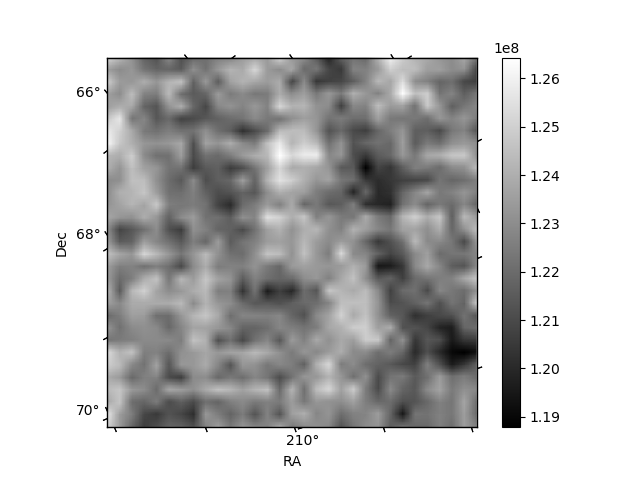
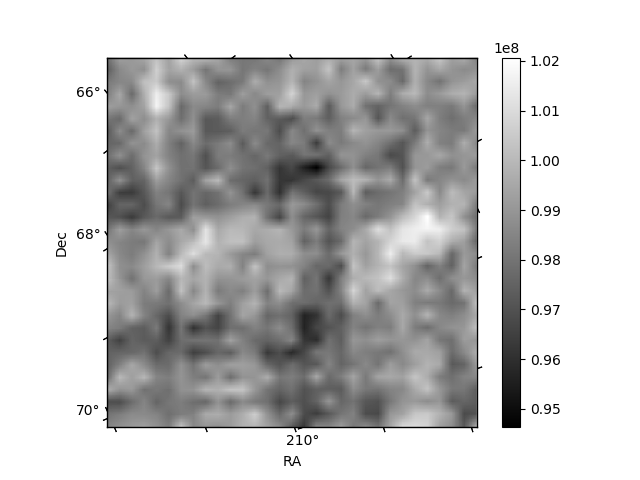
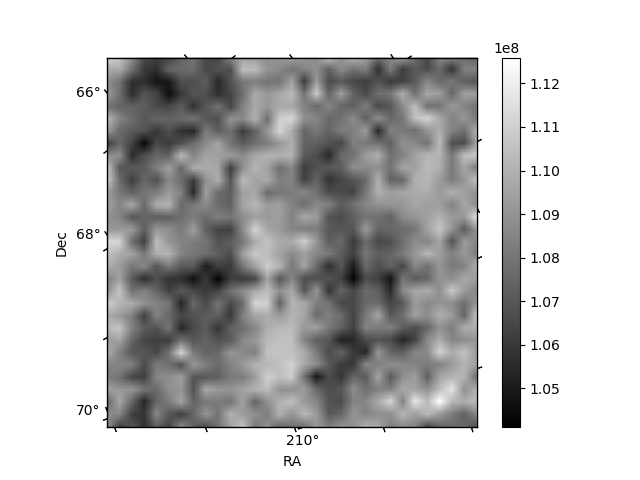
Histogram calculated using DETX and DETY for each event in the final _common_clean file
| Quadrant A | 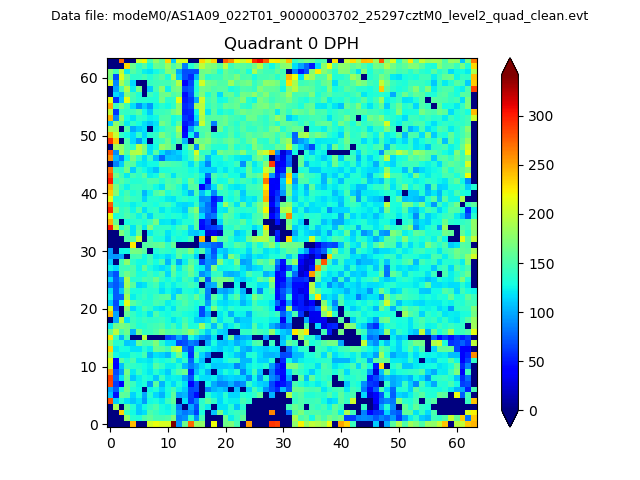 |
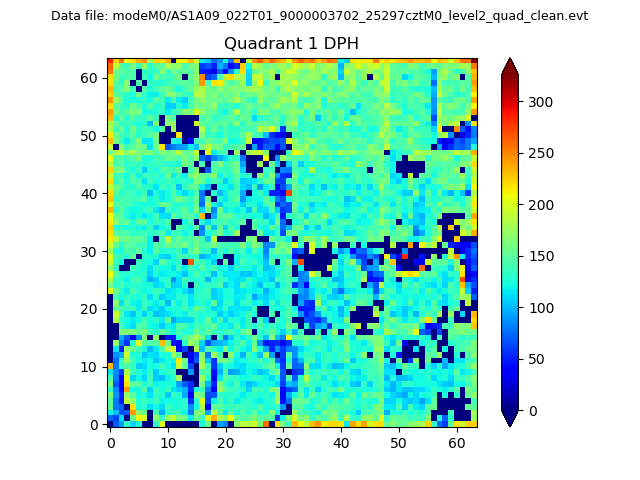 |
Quadrant B |
|---|---|---|---|
| Quadrant D | 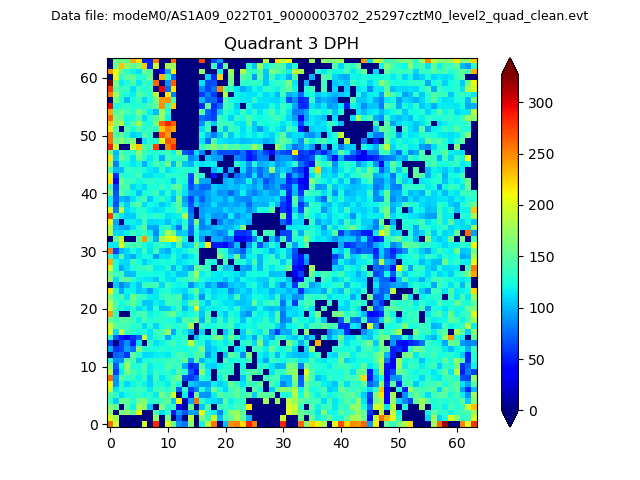 |
 |
Quadrant C |
| Plot type | Count rate plots | Images |
|---|---|---|
| Comparison with Poisson distribution Blue bars denote a histogram of data divided into 1 sec bins. Red curve is a Poisson curve with rate = median count rate of data. |
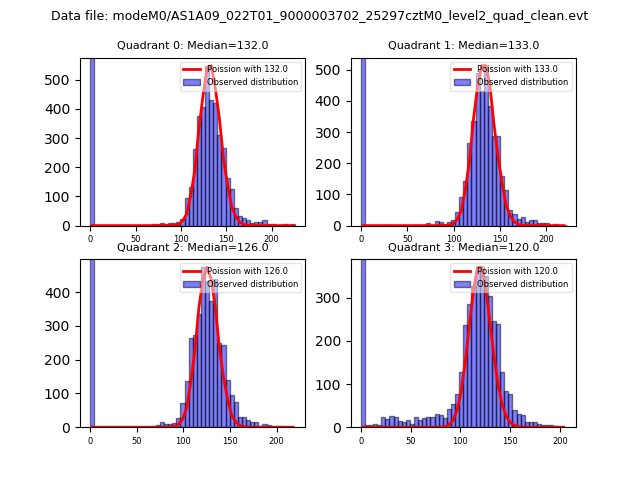 |
 |
| Quadrant-wise count rates Data is divided into 100 sec bins |
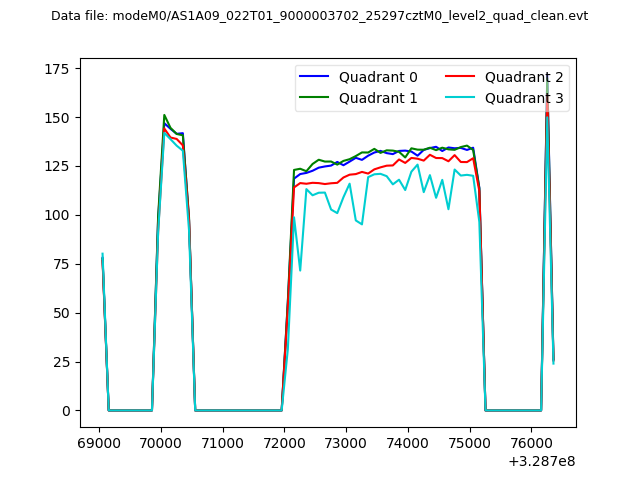 |
|
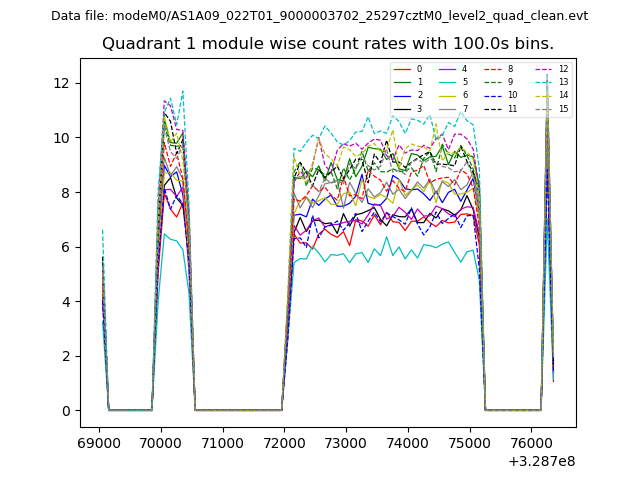
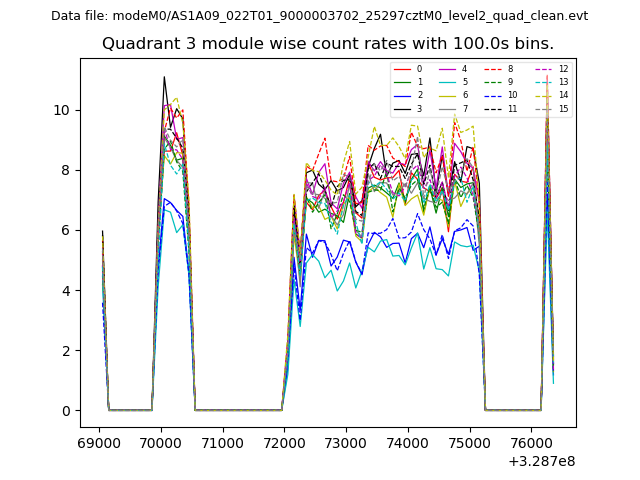
| Module-wise count rates for Quadrant A Data is divided into 100 sec bins |
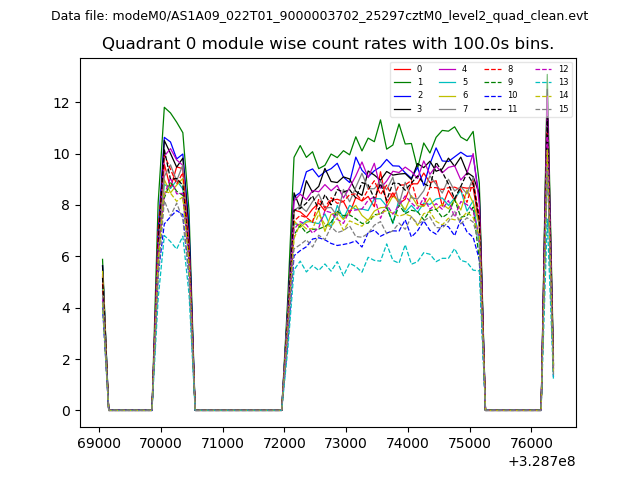 |
 |
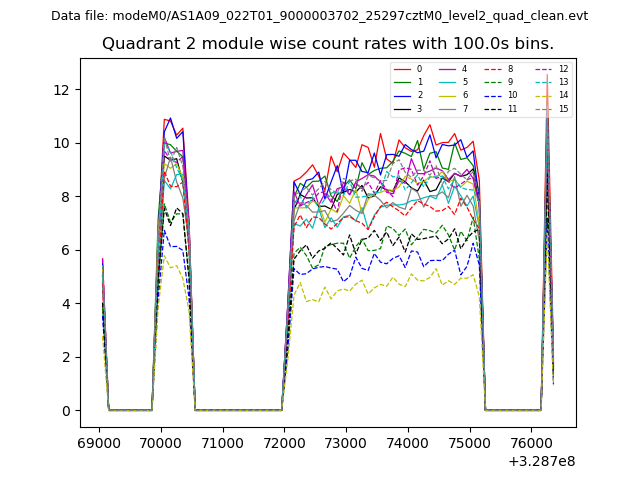
| Module-wise count rates for Quadrant B Data is divided into 100 sec bins |
 |
 |
| Module-wise count rates for Quadrant C Data is divided into 100 sec bins |
 |
 |
| Module-wise count rates for Quadrant D Data is divided into 100 sec bins |
 |
 |
| Parameter | Plot |
|---|---|
| CZT HV Monitor | 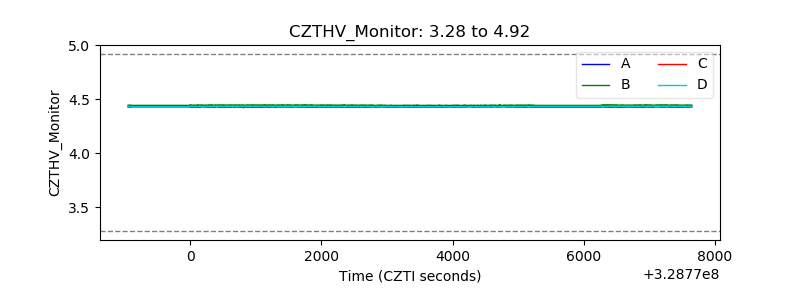 |
| D_VDD | 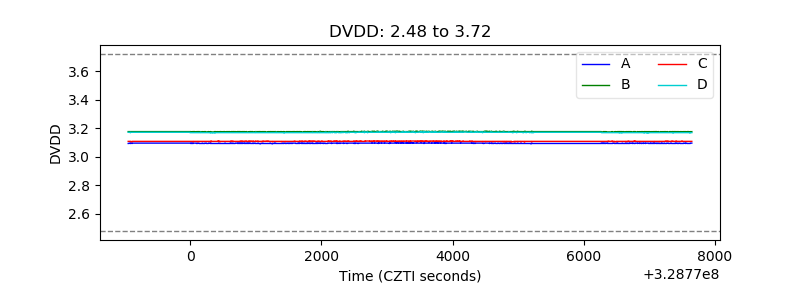 |
| Temperature 1 | 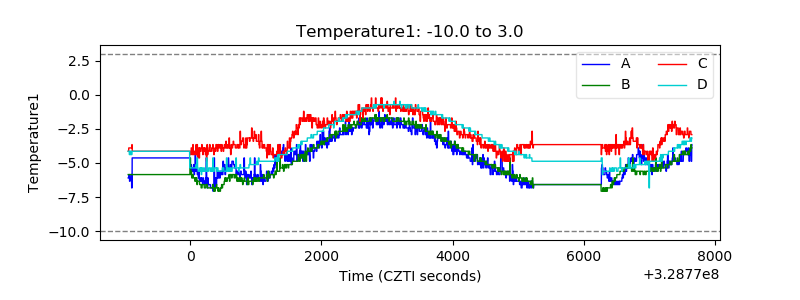 |
| Veto HV Monitor | 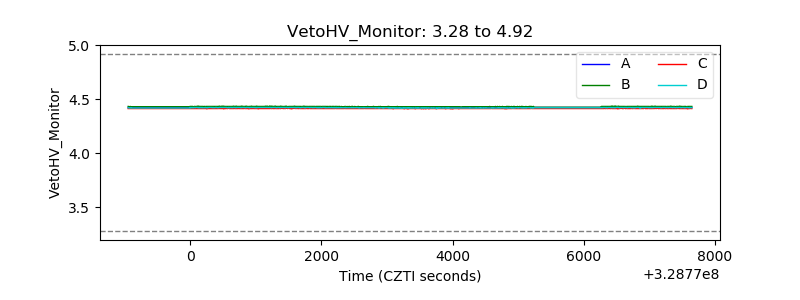 |
| Veto LLD | 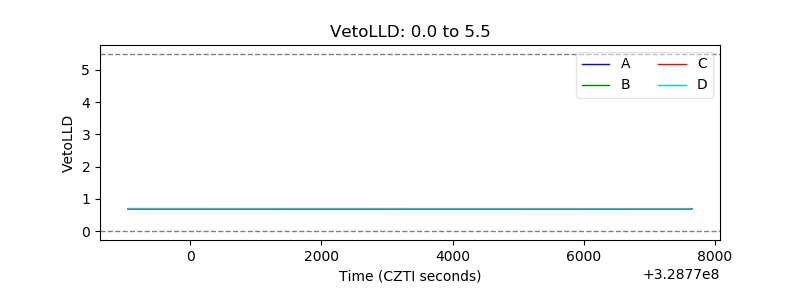 |
| Alpha Counter | 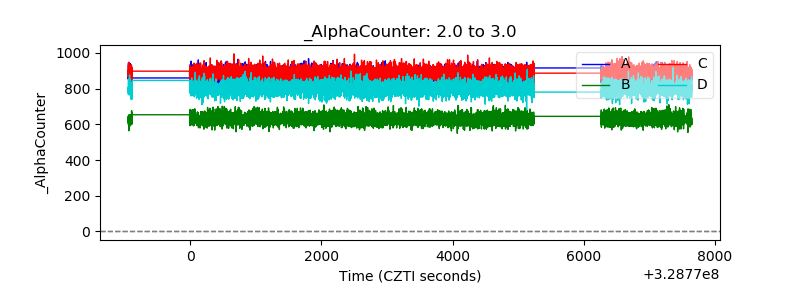 |
| _CPM_Rate | 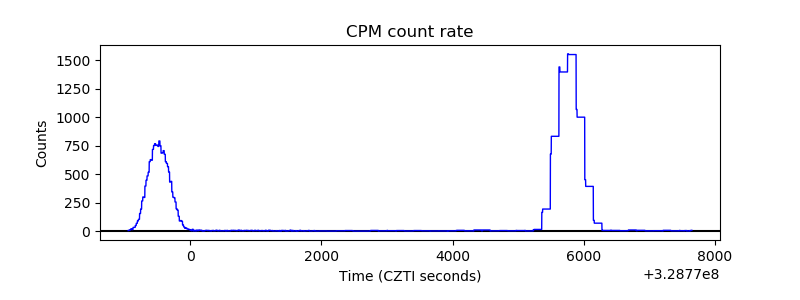 |
| CZT Counter | 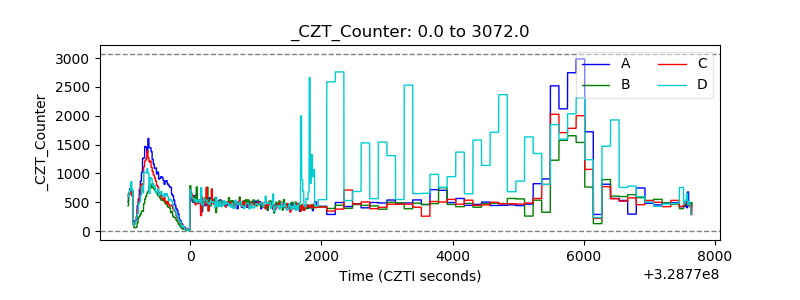 |
| +2.5 Volts monitor |  |
| +5 Volts monitor |  |
| _ROLL_ROT | 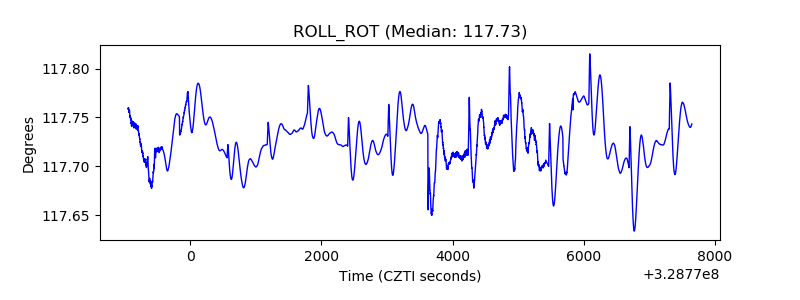 |
| _Roll_DEC | 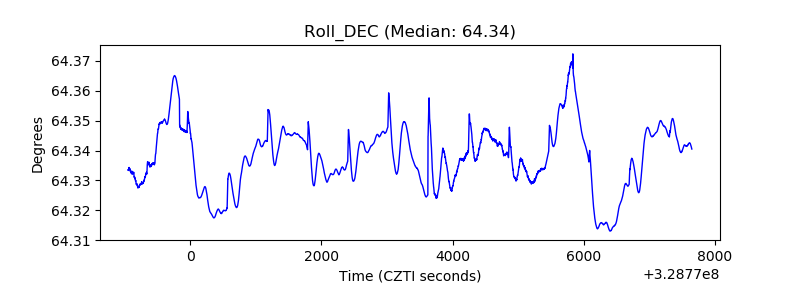 |
| _Roll_RA | 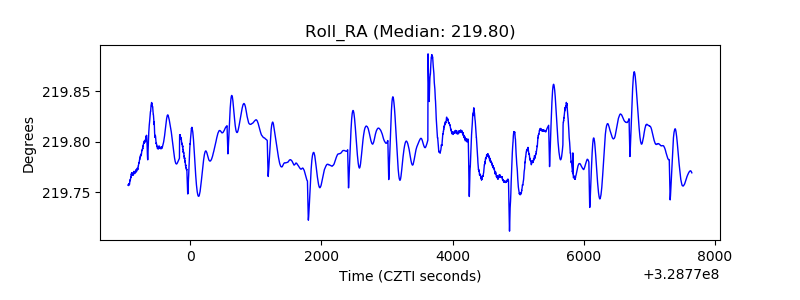 |
| Veto Counter | 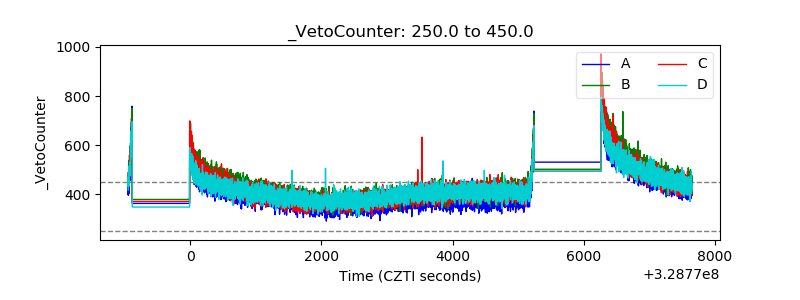 |