| Param | Original file | Final file |
|---|---|---|
| Filename | modeM0/AS1A09_022T01_9000003702_25299cztM0_level2.evt | modeM0/AS1A09_022T01_9000003702_25299cztM0_level2_quad_clean.evt |
| Size (bytes) | 491,955,840 | 78,419,520 |
| Size | 469.2 MB | 74.8 MB |
| Events in quadrant A | 3,282,576 | 496,253 |
| Events in quadrant B | 3,328,565 | 497,139 |
| Events in quadrant C | 3,261,428 | 470,396 |
| Events in quadrant D | 4,585,835 | 458,053 |
| Mode M9 | |||
|---|---|---|---|
| Quadrant | BADHDUFLAG | Total packets | Discarded packets |
| A | 0 | 14 | 0 |
| B | 0 | 15 | 0 |
| C | 0 | 15 | 0 |
| D | 0 | 15 | 0 |
| Mode M0 | |||
|---|---|---|---|
| Quadrant | BADHDUFLAG | Total packets | Discarded packets |
| A | 0 | 13821 | 0 |
| B | 0 | 13948 | 0 |
| C | 0 | 13703 | 0 |
| D | 0 | 17826 | 0 |
| Quadrant | Total seconds | Saturated seconds | Saturation percentage |
|---|---|---|---|
| A | 6482 | 66 | 1.018204% |
| B | 6482 | 93 | 1.434742% |
| C | 6481 | 94 | 1.450393% |
| D | 6481 | 319 | 4.922080% |
Noise dominated data is calculated using 1-second bins in cleaned event files. If a bin has >2000 counts, and if more than 50% of those come from <1% of pixels, then it is considered to be noise-dominated and hence unusable.
| Quadrant | # 1 sec bins | Bins with >0 counts | Bins with >2000 counts | High rate bins dominated by noise | Noise dominated (total time) | Noise dominated (detector-on time) | Marked lightcurve |
|---|---|---|---|---|---|---|---|
| A | 7637 | 6483 | 0 | 0 | 0.00% | 0.00% | 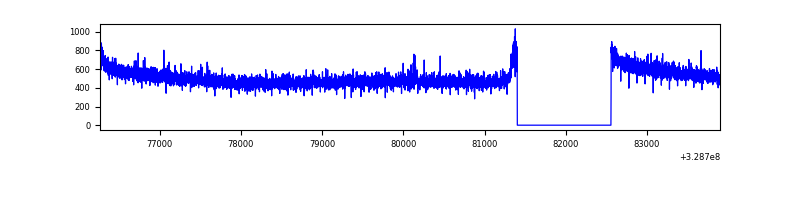 |
| B | 7637 | 6482 | 5 | 5 | 0.07% | 0.08% | 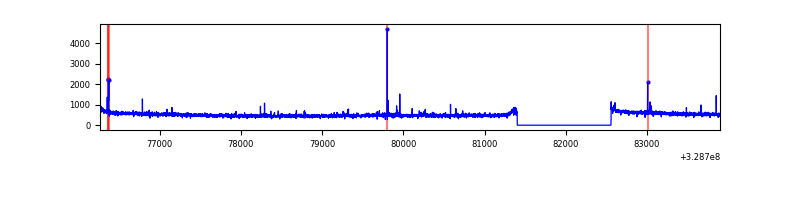 |
| C | 7636 | 6482 | 0 | 0 | 0.00% | 0.00% | 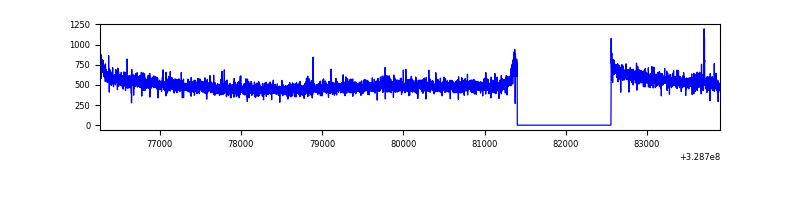 |
| D | 7636 | 6482 | 219 | 219 | 2.87% | 3.38% | 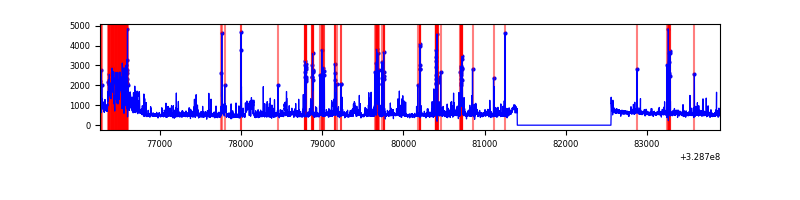 |
Top three noisy pixels from each quadrant. If the there are fewer than three noisy pixels in the level2.evt file, extra rows are filled as -1
| Pixel properties | Quadrant properties | ||||||
|---|---|---|---|---|---|---|---|
| Quadrant | DetID | PixID | Counts | Sigma | Mean | Median | Sigma |
| A | 13 | 254 | 10391 | 56.61 | 849 | 832 | 168.9 |
| A | 6 | 16 | 9842 | 53.36 | 849 | 832 | 168.9 |
| A | 3 | 137 | 7359 | 38.65 | 849 | 832 | 168.9 |
| B | 5 | 235 | 27249 | 169.75 | 835 | 816 | 155.7 |
| B | 0 | 190 | 19027 | 116.95 | 835 | 816 | 155.7 |
| B | 12 | 111 | 18526 | 113.73 | 835 | 816 | 155.7 |
| C | 14 | 238 | 128978 | 697.4 | 797 | 803 | 183.8 |
| C | 3 | 233 | 13131 | 67.08 | 797 | 803 | 183.8 |
| C | 13 | 61 | 5445 | 25.26 | 797 | 803 | 183.8 |
| D | 1 | 52 | 1105231 | 5657.2 | 805 | 783 | 195.2 |
| D | 12 | 233 | 173615 | 885.28 | 805 | 783 | 195.2 |
| D | 8 | 195 | 108665 | 552.59 | 805 | 783 | 195.2 |
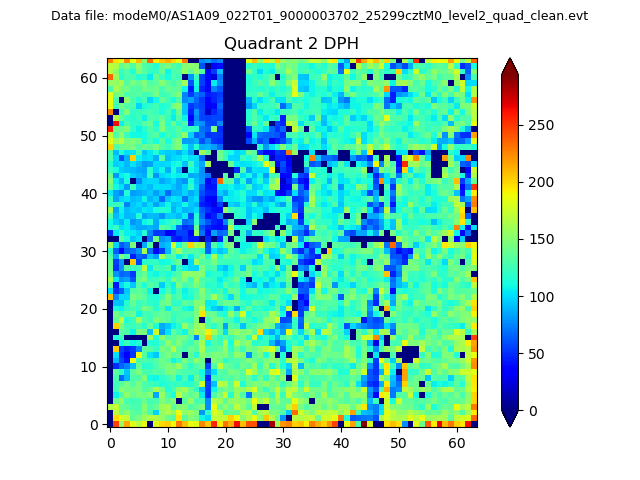
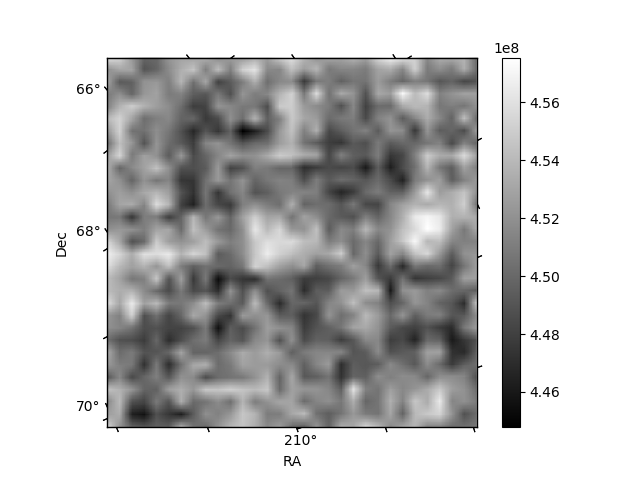
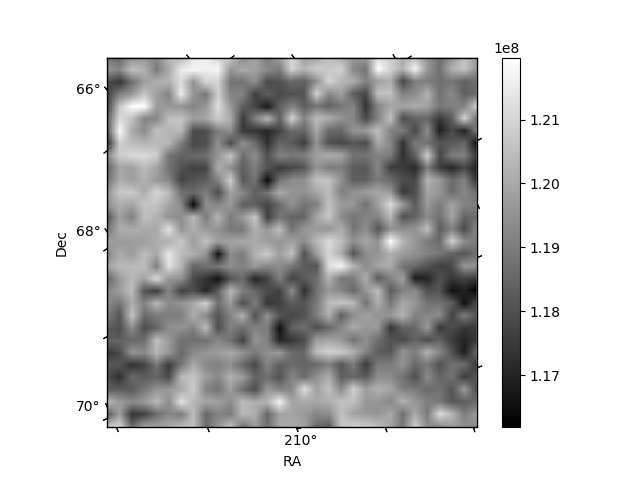
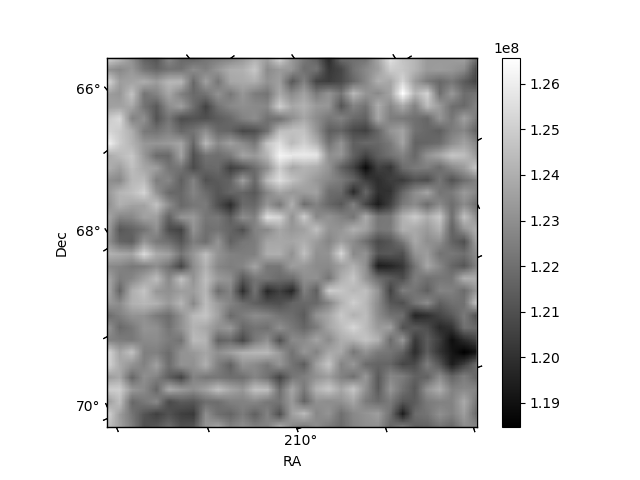
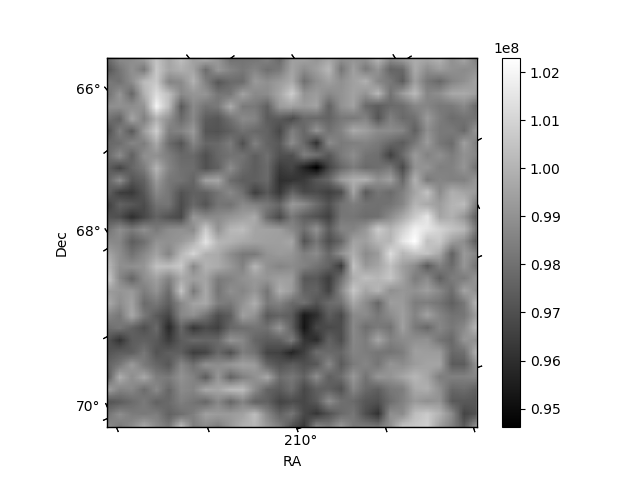
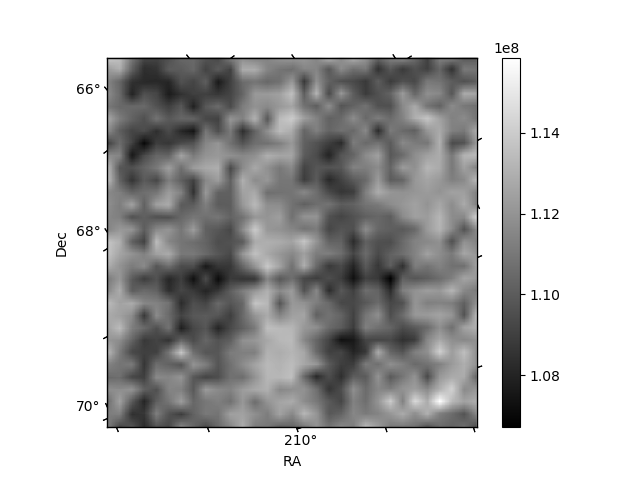
Histogram calculated using DETX and DETY for each event in the final _common_clean file
| Quadrant A | 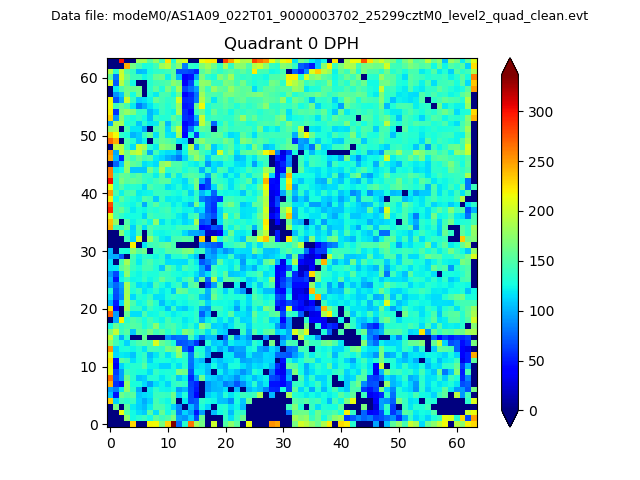 |
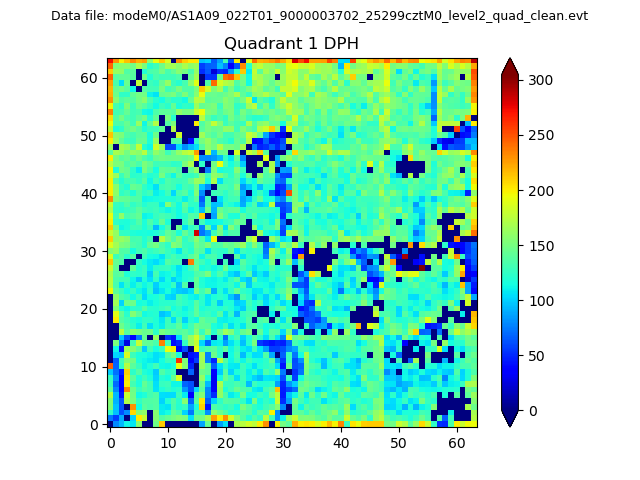 |
Quadrant B |
|---|---|---|---|
| Quadrant D | 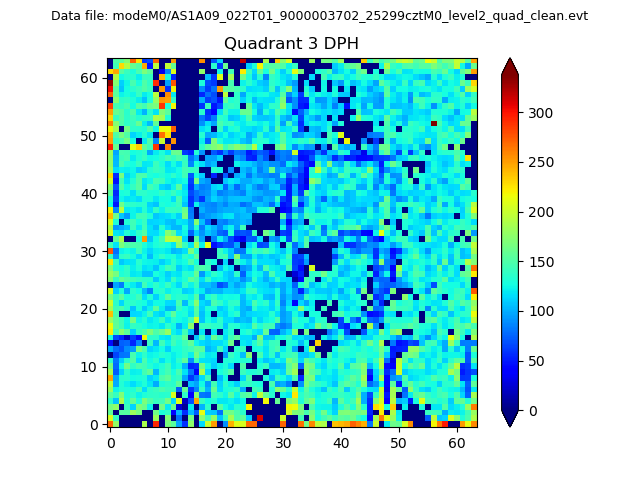 |
 |
Quadrant C |
| Plot type | Count rate plots | Images |
|---|---|---|
| Comparison with Poisson distribution Blue bars denote a histogram of data divided into 1 sec bins. Red curve is a Poisson curve with rate = median count rate of data. |
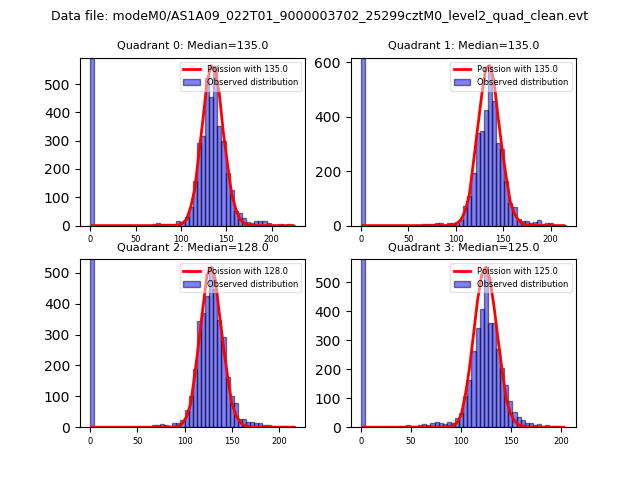 |
 |
| Quadrant-wise count rates Data is divided into 100 sec bins |
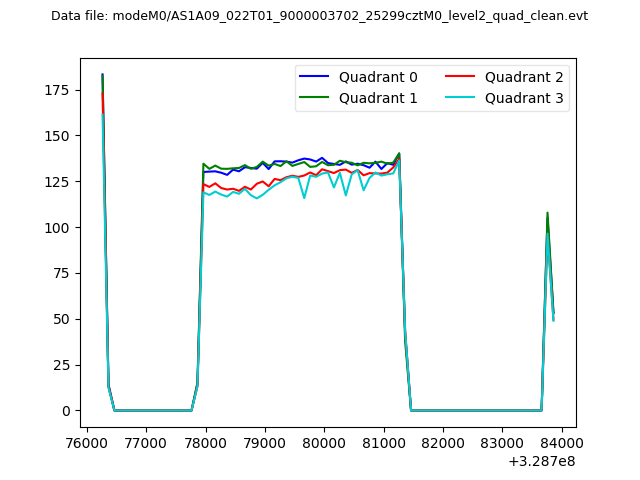 |
|
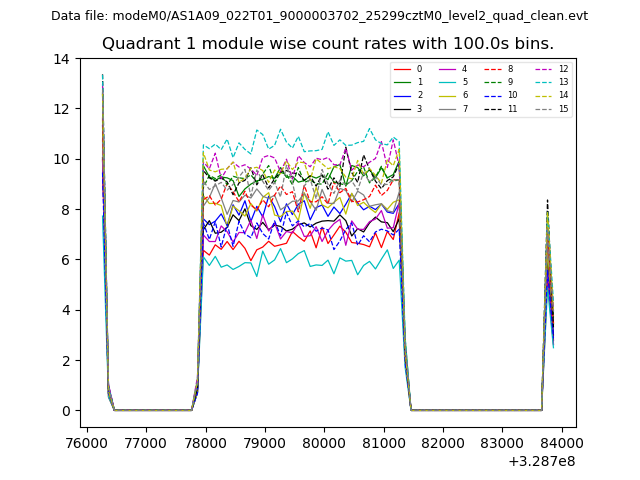
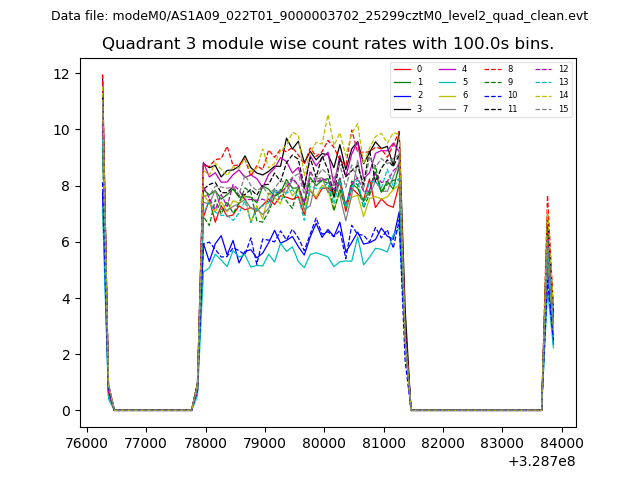
| Module-wise count rates for Quadrant A Data is divided into 100 sec bins |
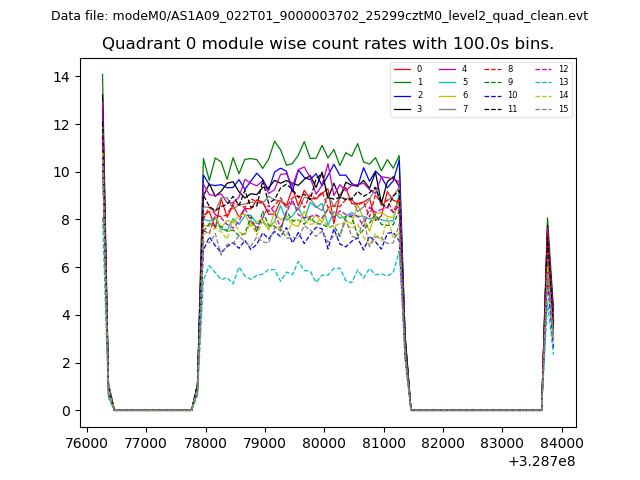 |
 |
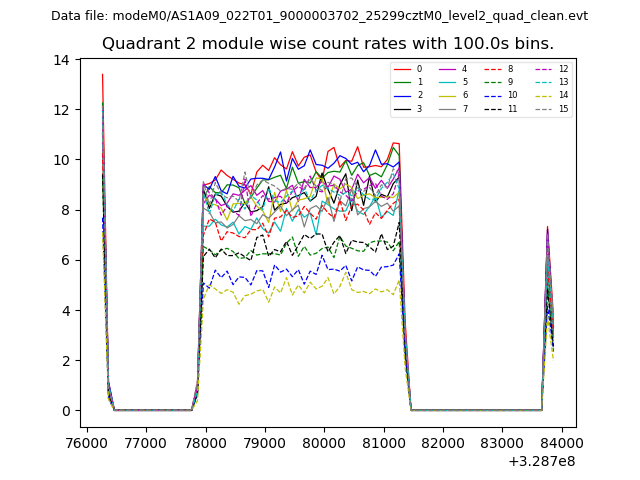
| Module-wise count rates for Quadrant B Data is divided into 100 sec bins |
 |
 |
| Module-wise count rates for Quadrant C Data is divided into 100 sec bins |
 |
 |
| Module-wise count rates for Quadrant D Data is divided into 100 sec bins |
 |
 |
| Parameter | Plot |
|---|---|
| CZT HV Monitor | 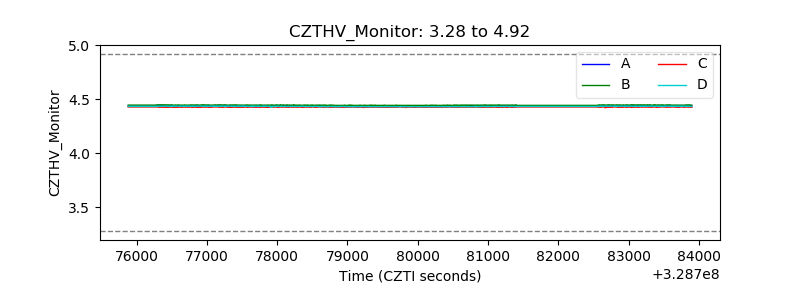 |
| D_VDD | 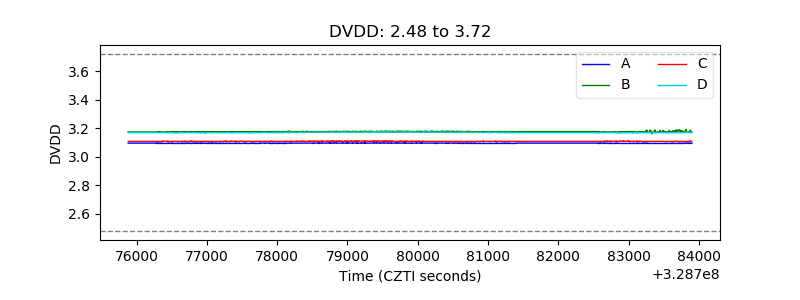 |
| Temperature 1 | 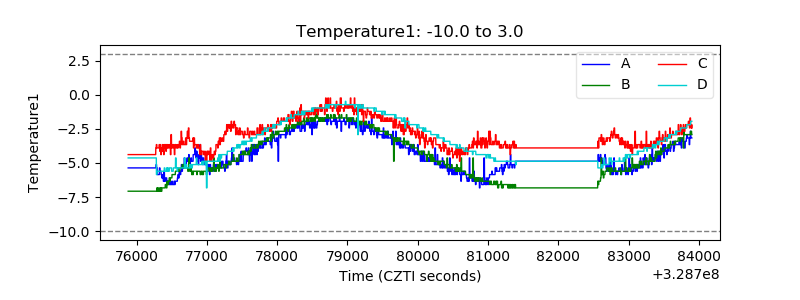 |
| Veto HV Monitor | 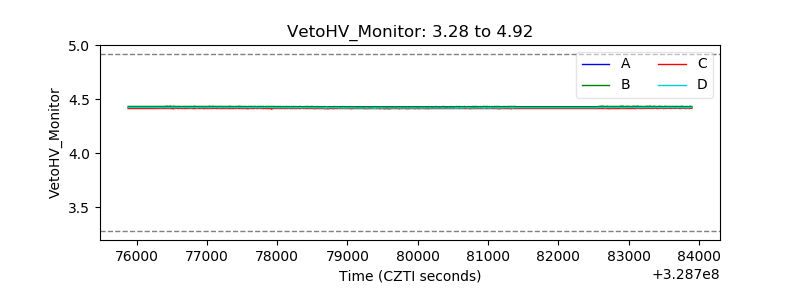 |
| Veto LLD | 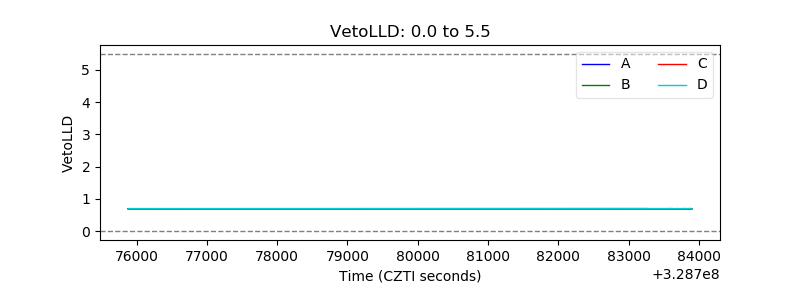 |
| Alpha Counter | 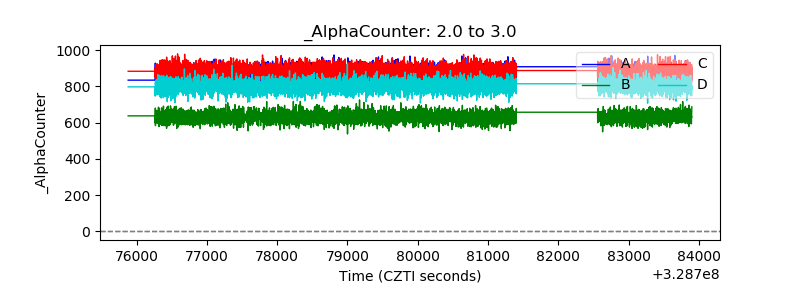 |
| _CPM_Rate | 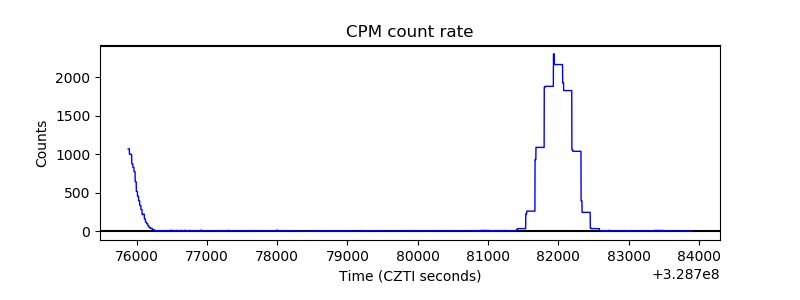 |
| CZT Counter | 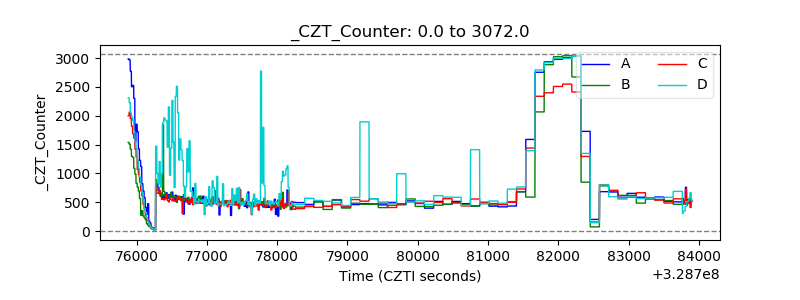 |
| +2.5 Volts monitor | 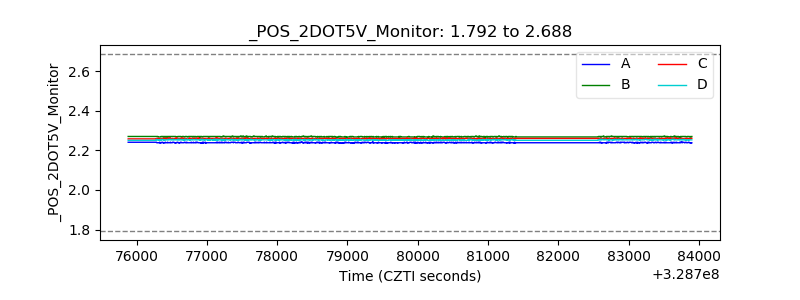 |
| +5 Volts monitor | 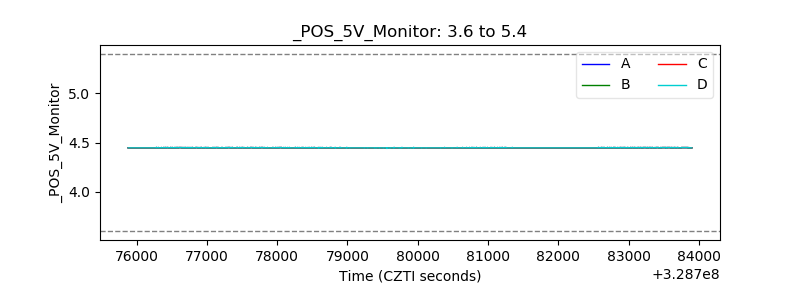 |
| _ROLL_ROT | 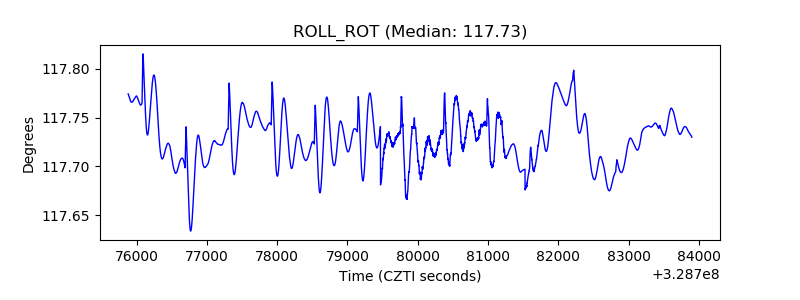 |
| _Roll_DEC | 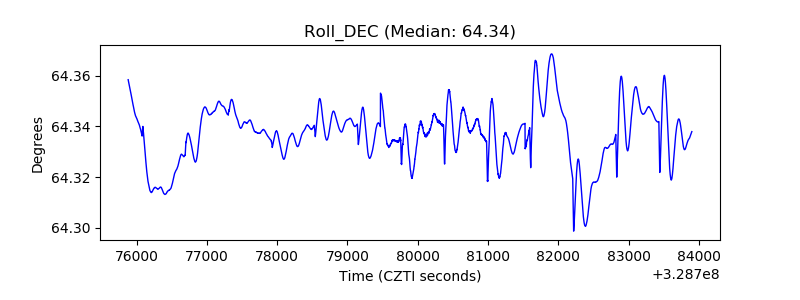 |
| _Roll_RA | 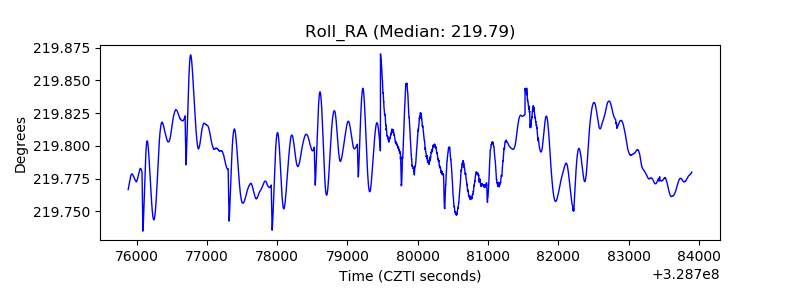 |
| Veto Counter | 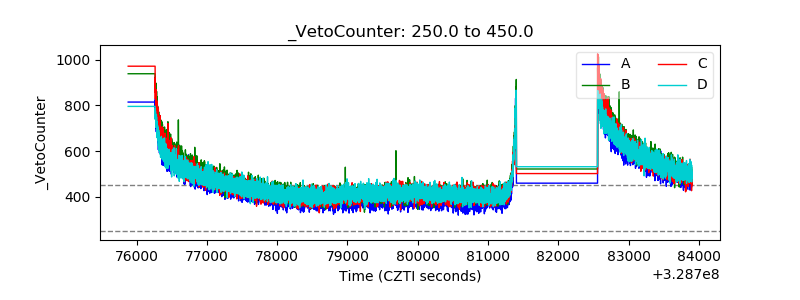 |