| Param | Original file | Final file |
|---|---|---|
| Filename | modeM0/AS1A09_022T01_9000003702_25300cztM0_level2.evt | modeM0/AS1A09_022T01_9000003702_25300cztM0_level2_quad_clean.evt |
| Size (bytes) | 2,898,181,440 | 468,685,440 |
| Size | 2.7 GB | 447.0 MB |
| Events in quadrant A | 19,636,580 | 3,046,982 |
| Events in quadrant B | 20,957,590 | 3,078,316 |
| Events in quadrant C | 16,264,244 | 3,005,128 |
| Events in quadrant D | 28,648,848 | 2,753,921 |
| Mode M9 | |||
|---|---|---|---|
| Quadrant | BADHDUFLAG | Total packets | Discarded packets |
| A | 0 | 37 | 0 |
| B | 0 | 37 | 0 |
| C | 0 | 37 | 0 |
| D | 0 | 37 | 0 |
| Mode M0 | |||
|---|---|---|---|
| Quadrant | BADHDUFLAG | Total packets | Discarded packets |
| A | 0 | 80427 | 0 |
| B | 0 | 84334 | 0 |
| C | 0 | 70015 | 0 |
| D | 0 | 107973 | 0 |
| Quadrant | Total seconds | Saturated seconds | Saturation percentage |
|---|---|---|---|
| A | 33613 | 1350 | 4.016303% |
| B | 33614 | 1513 | 4.501101% |
| C | 33614 | 360 | 1.070982% |
| D | 33614 | 3655 | 10.873446% |
Noise dominated data is calculated using 1-second bins in cleaned event files. If a bin has >2000 counts, and if more than 50% of those come from <1% of pixels, then it is considered to be noise-dominated and hence unusable.
| Quadrant | # 1 sec bins | Bins with >0 counts | Bins with >2000 counts | High rate bins dominated by noise | Noise dominated (total time) | Noise dominated (detector-on time) | Marked lightcurve |
|---|---|---|---|---|---|---|---|
| A | 44706 | 33620 | 779 | 779 | 1.74% | 2.32% | 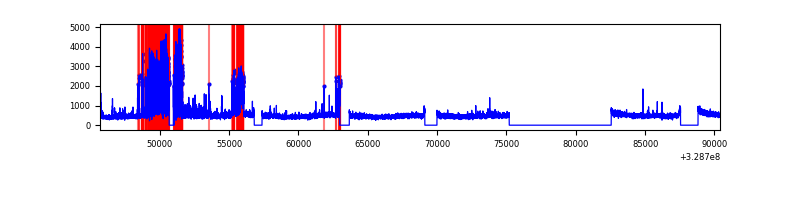 |
| B | 44707 | 33621 | 885 | 885 | 1.98% | 2.63% | 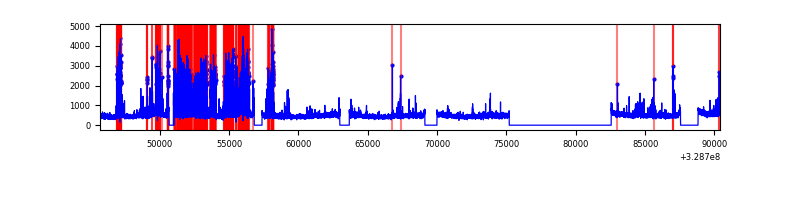 |
| C | 44707 | 33621 | 32 | 32 | 0.07% | 0.10% | 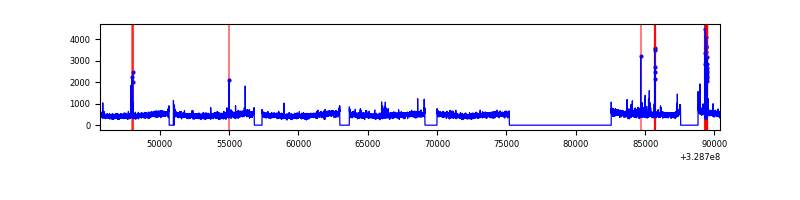 |
| D | 44707 | 33619 | 2834 | 2834 | 6.34% | 8.43% | 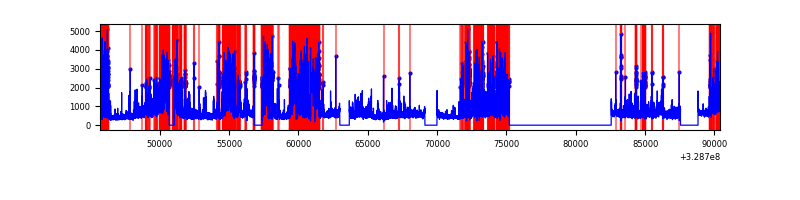 |
Top three noisy pixels from each quadrant. If the there are fewer than three noisy pixels in the level2.evt file, extra rows are filled as -1
| Pixel properties | Quadrant properties | ||||||
|---|---|---|---|---|---|---|---|
| Quadrant | DetID | PixID | Counts | Sigma | Mean | Median | Sigma |
| A | 6 | 16 | 3985646 | 4946.44 | 4052 | 3965 | 805.0 |
| A | 13 | 254 | 54036 | 62.2 | 4052 | 3965 | 805.0 |
| A | 3 | 137 | 36065 | 39.88 | 4052 | 3965 | 805.0 |
| B | 3 | 112 | 3342828 | 4466.61 | 4013 | 3911 | 747.5 |
| B | 3 | 64 | 1508955 | 2013.36 | 4013 | 3911 | 747.5 |
| B | 0 | 190 | 302394 | 399.29 | 4013 | 3911 | 747.5 |
| C | 14 | 238 | 628913 | 691.32 | 3917 | 3945 | 904.0 |
| C | 0 | 239 | 197381 | 213.97 | 3917 | 3945 | 904.0 |
| C | 3 | 233 | 86789 | 91.64 | 3917 | 3945 | 904.0 |
| D | 12 | 235 | 7514093 | 8255.43 | 3802 | 3694 | 909.8 |
| D | 1 | 52 | 2682724 | 2944.79 | 3802 | 3694 | 909.8 |
| D | 7 | 38 | 1257202 | 1377.86 | 3802 | 3694 | 909.8 |
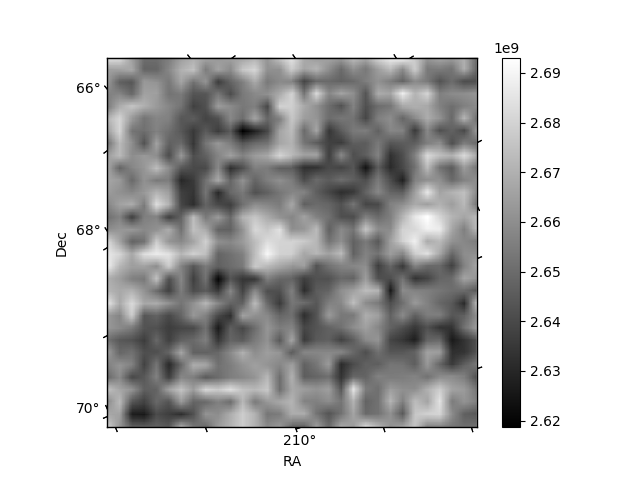
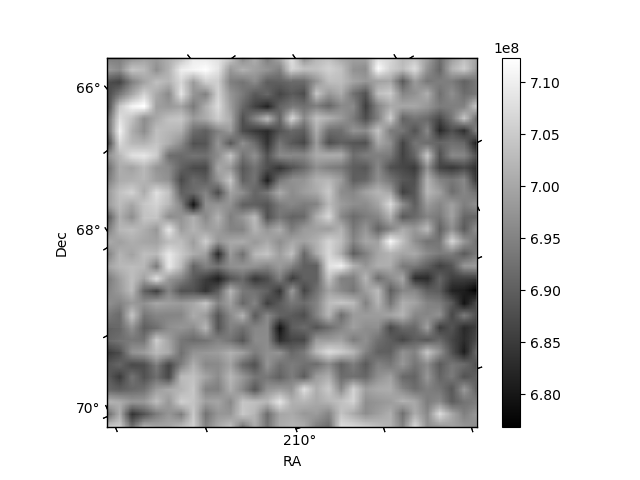
Histogram calculated using DETX and DETY for each event in the final _common_clean file
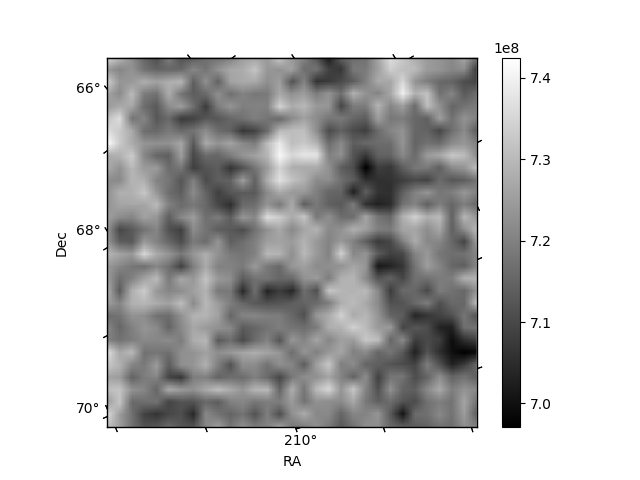
| Quadrant A | 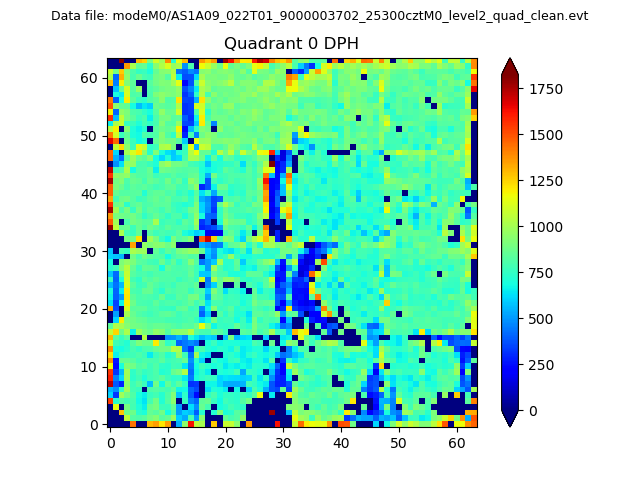 |
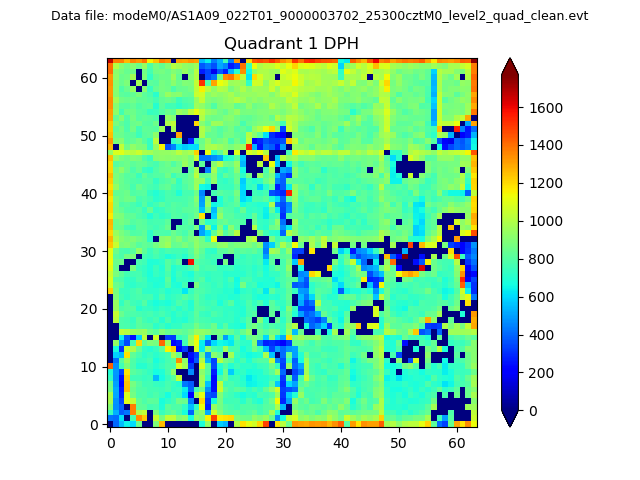 |
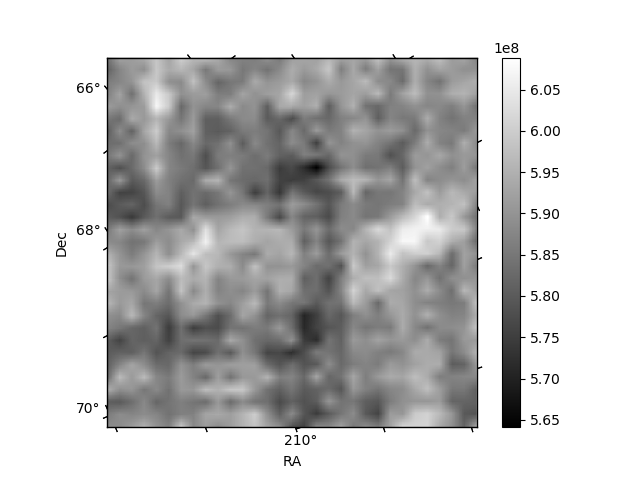
Quadrant B |
|---|---|---|---|
| Quadrant D | 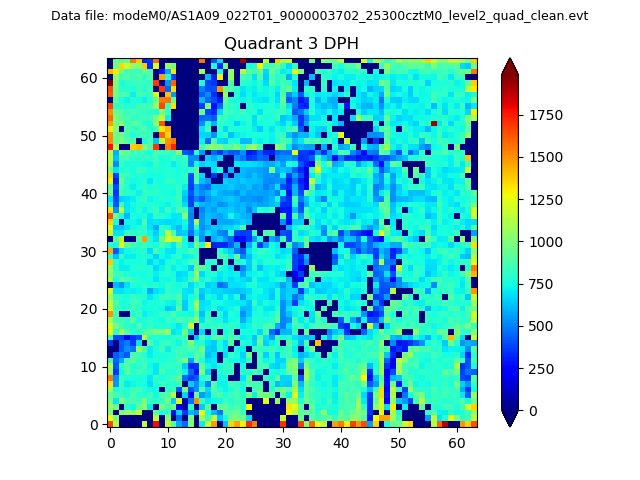 |
 |
Quadrant C |
| Plot type | Count rate plots | Images |
|---|---|---|
| Comparison with Poisson distribution Blue bars denote a histogram of data divided into 1 sec bins. Red curve is a Poisson curve with rate = median count rate of data. |
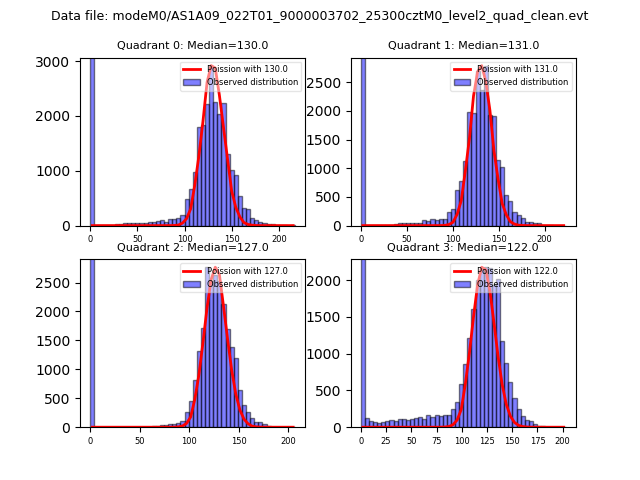 |
 |
| Quadrant-wise count rates Data is divided into 100 sec bins |
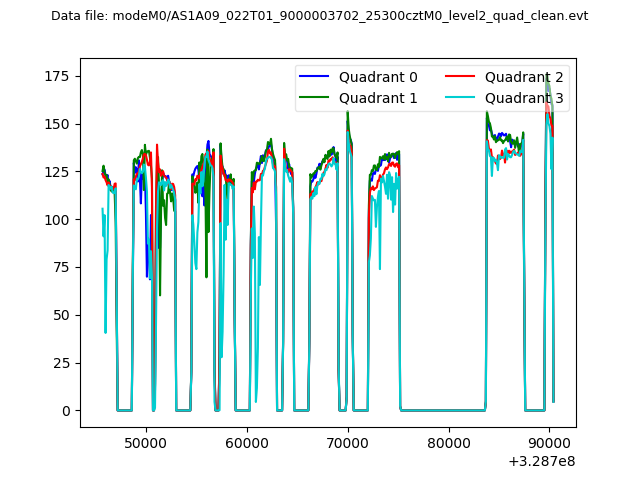 |
|
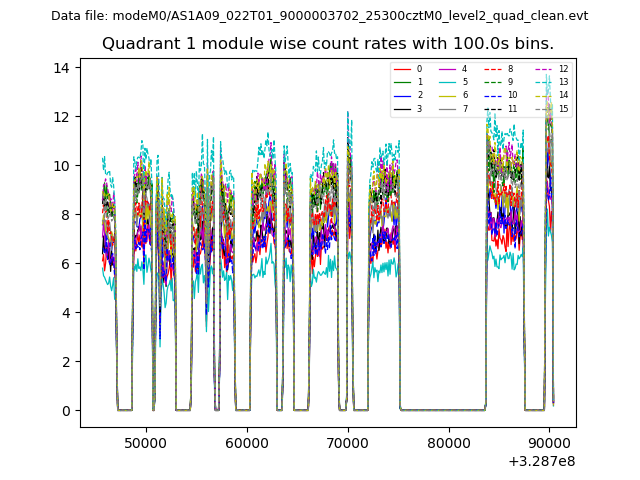
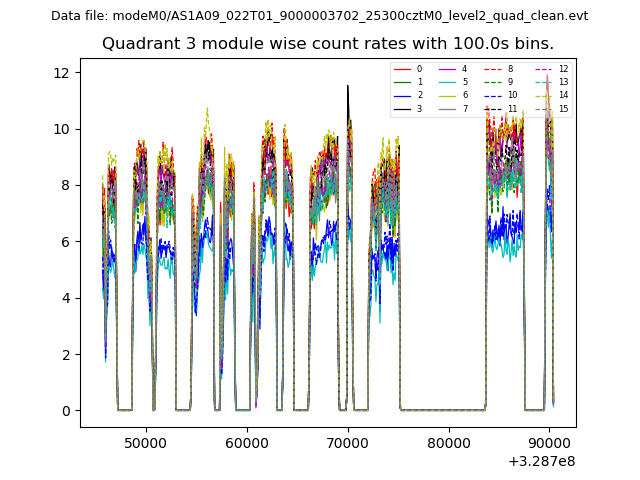
| Module-wise count rates for Quadrant A Data is divided into 100 sec bins |
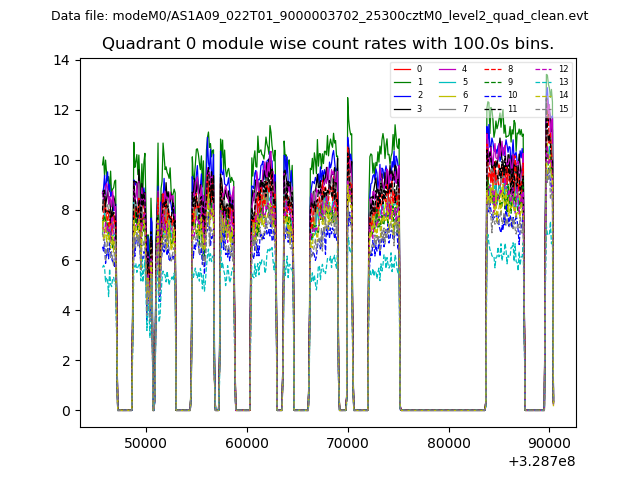 |
 |
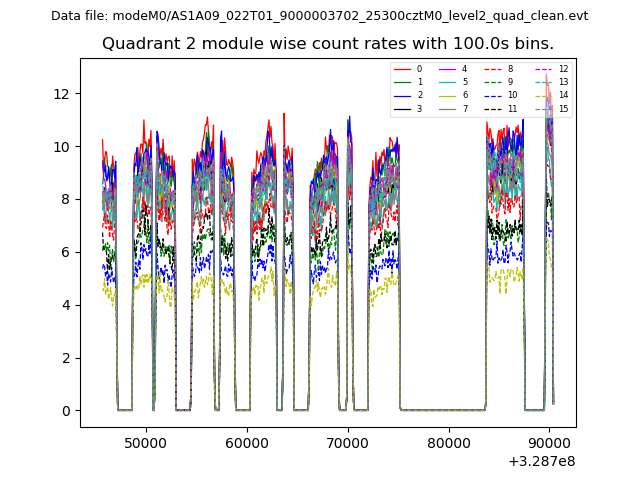
| Module-wise count rates for Quadrant B Data is divided into 100 sec bins |
 |
 |
| Module-wise count rates for Quadrant C Data is divided into 100 sec bins |
 |
 |
| Module-wise count rates for Quadrant D Data is divided into 100 sec bins |
 |
 |
| Parameter | Plot |
|---|---|
| CZT HV Monitor | 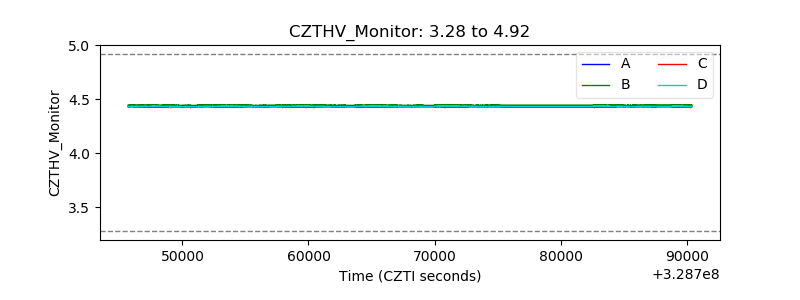 |
| D_VDD | 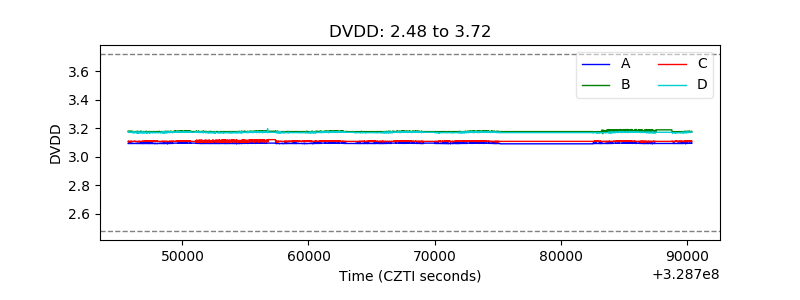 |
| Temperature 1 | 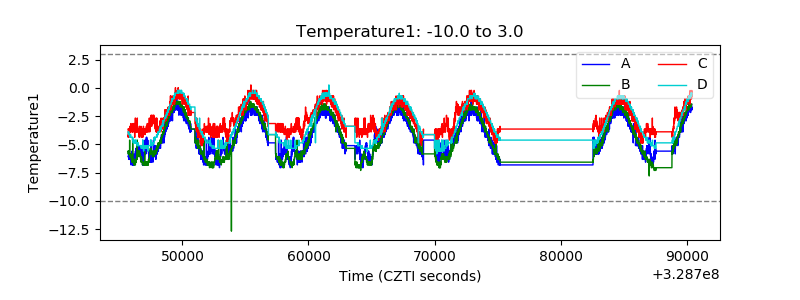 |
| Veto HV Monitor | 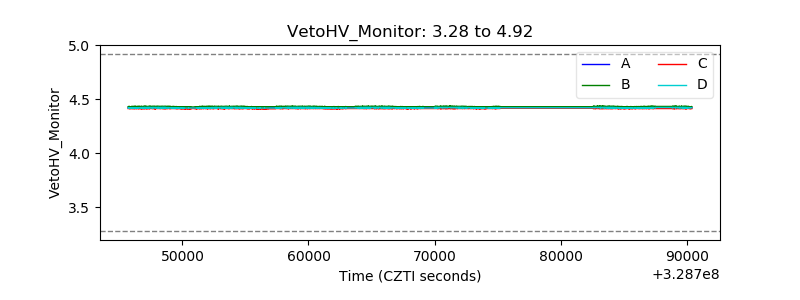 |
| Veto LLD | 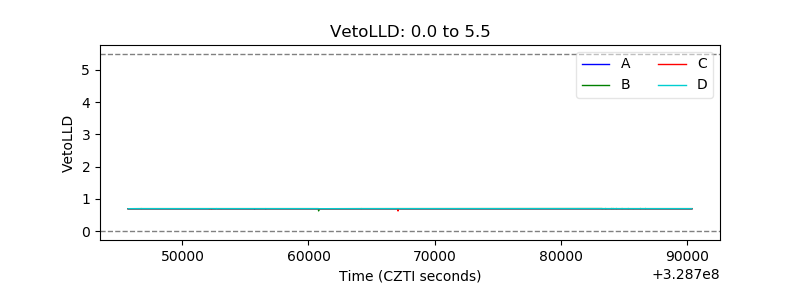 |
| Alpha Counter | 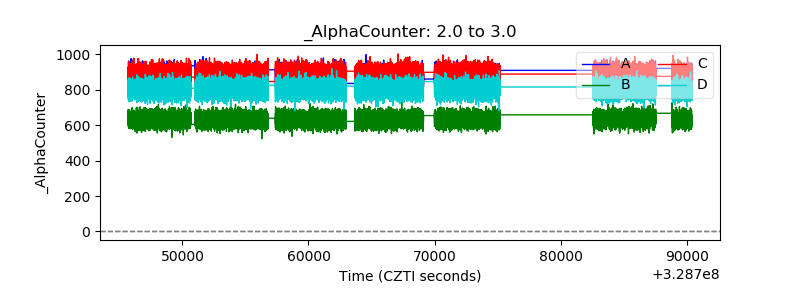 |
| _CPM_Rate | 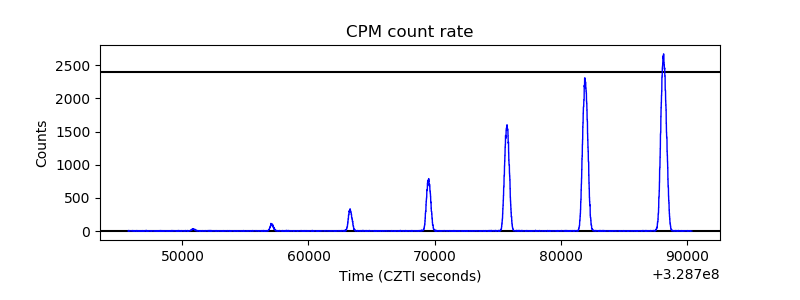 |
| CZT Counter | 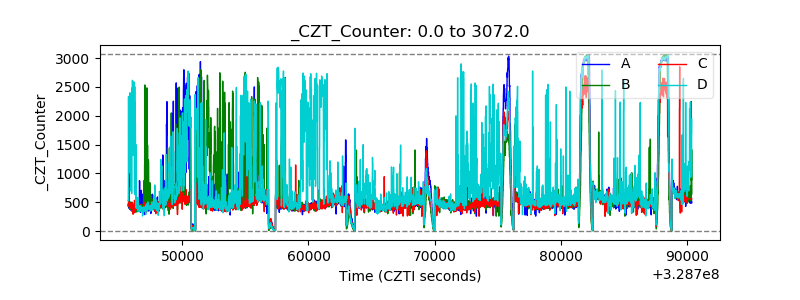 |
| +2.5 Volts monitor | 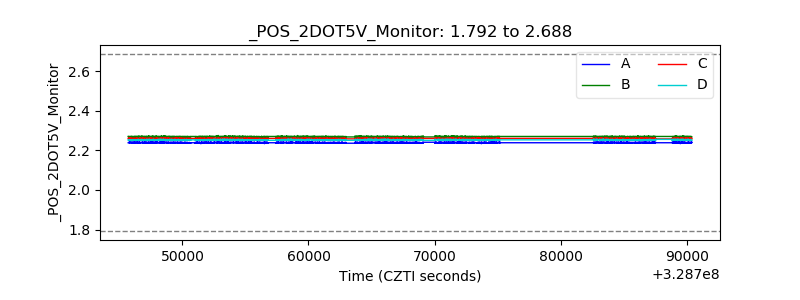 |
| +5 Volts monitor | 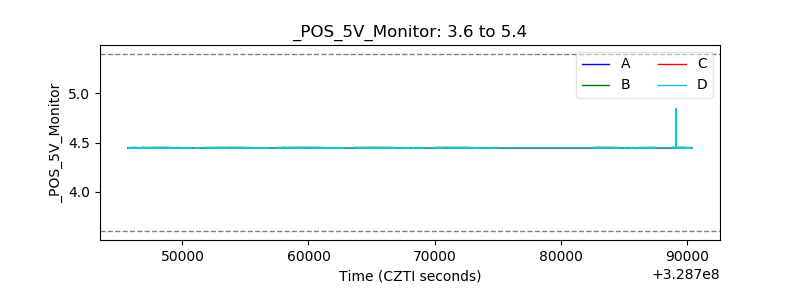 |
| _ROLL_ROT | 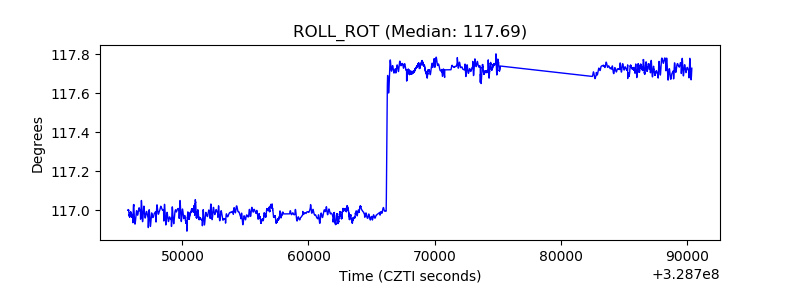 |
| _Roll_DEC |  |
| _Roll_RA | 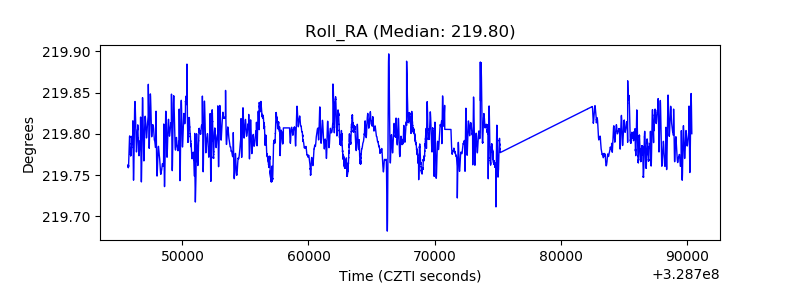 |
| Veto Counter | 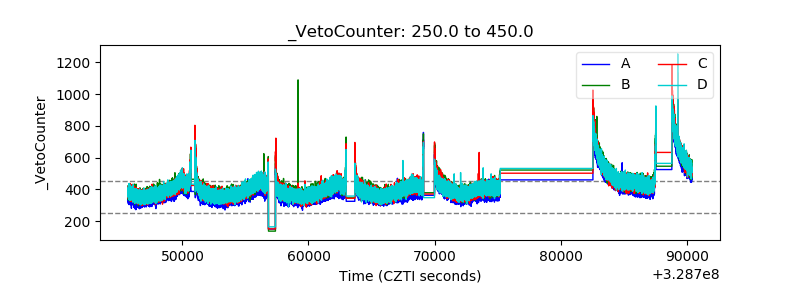 |