| Param | Original file | Final file |
|---|---|---|
| Filename | modeM0/AS1A09_022T01_9000003702_25301cztM0_level2.evt | modeM0/AS1A09_022T01_9000003702_25301cztM0_level2_quad_clean.evt |
| Size (bytes) | 563,253,120 | 116,686,080 |
| Size | 537.2 MB | 111.3 MB |
| Events in quadrant A | 3,132,930 | 830,648 |
| Events in quadrant B | 4,081,498 | 805,304 |
| Events in quadrant C | 3,122,843 | 779,270 |
| Events in quadrant D | 6,335,850 | 720,748 |
| Mode M9 | |||
|---|---|---|---|
| Quadrant | BADHDUFLAG | Total packets | Discarded packets |
| A | 0 | 13 | 0 |
| B | 0 | 13 | 0 |
| C | 0 | 13 | 0 |
| D | 0 | 13 | 0 |
| Mode M0 | |||
|---|---|---|---|
| Quadrant | BADHDUFLAG | Total packets | Discarded packets |
| A | 0 | 12796 | 0 |
| B | 0 | 15876 | 0 |
| C | 0 | 12687 | 0 |
| D | 0 | 22820 | 0 |
| Quadrant | Total seconds | Saturated seconds | Saturation percentage |
|---|---|---|---|
| A | 5685 | 101 | 1.776605% |
| B | 5686 | 339 | 5.962012% |
| C | 5686 | 122 | 2.145621% |
| D | 5685 | 948 | 16.675462% |
Noise dominated data is calculated using 1-second bins in cleaned event files. If a bin has >2000 counts, and if more than 50% of those come from <1% of pixels, then it is considered to be noise-dominated and hence unusable.
| Quadrant | # 1 sec bins | Bins with >0 counts | Bins with >2000 counts | High rate bins dominated by noise | Noise dominated (total time) | Noise dominated (detector-on time) | Marked lightcurve |
|---|---|---|---|---|---|---|---|
| A | 7000 | 5686 | 19 | 19 | 0.27% | 0.33% | 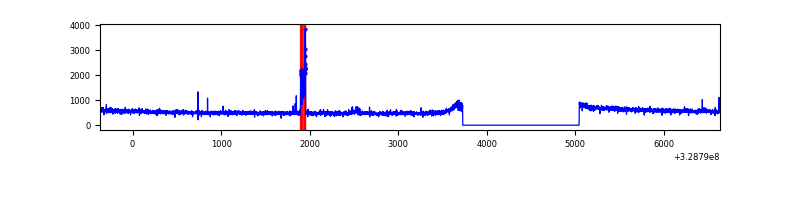 |
| B | 7001 | 5686 | 181 | 181 | 2.59% | 3.18% | 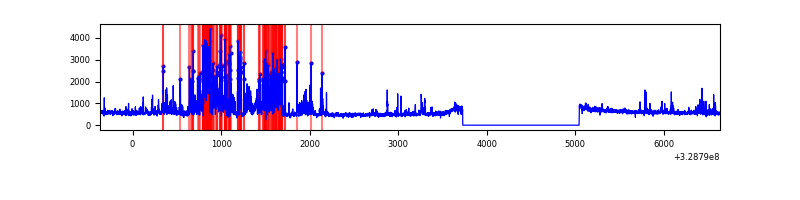 |
| C | 7001 | 5687 | 4 | 4 | 0.06% | 0.07% | 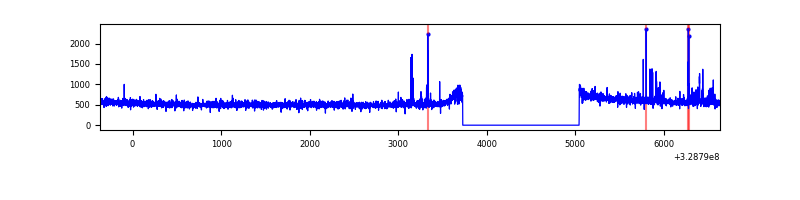 |
| D | 7001 | 5687 | 836 | 836 | 11.94% | 14.70% | 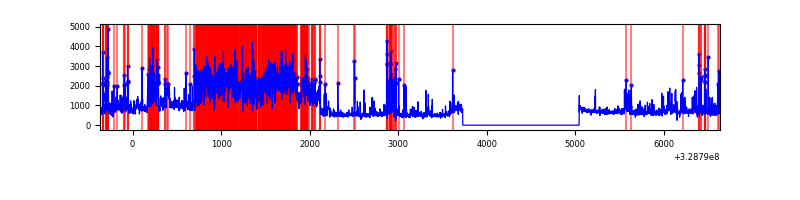 |
Top three noisy pixels from each quadrant. If the there are fewer than three noisy pixels in the level2.evt file, extra rows are filled as -1
| Pixel properties | Quadrant properties | ||||||
|---|---|---|---|---|---|---|---|
| Quadrant | DetID | PixID | Counts | Sigma | Mean | Median | Sigma |
| A | 6 | 16 | 92313 | 592.28 | 788 | 775 | 154.6 |
| A | 13 | 254 | 9793 | 58.35 | 788 | 775 | 154.6 |
| A | 0 | 226 | 6996 | 40.25 | 788 | 775 | 154.6 |
| B | 3 | 64 | 1049869 | 7581.2 | 757 | 741 | 138.4 |
| B | 0 | 190 | 55972 | 399.11 | 757 | 741 | 138.4 |
| B | 12 | 111 | 15602 | 107.39 | 757 | 741 | 138.4 |
| C | 14 | 238 | 121747 | 712.0 | 744 | 750 | 169.9 |
| C | 0 | 239 | 87705 | 511.68 | 744 | 750 | 169.9 |
| C | 3 | 233 | 6992 | 36.73 | 744 | 750 | 169.9 |
| D | 1 | 52 | 1576807 | 8952.54 | 733 | 712 | 176.0 |
| D | 12 | 33 | 1257880 | 7140.97 | 733 | 712 | 176.0 |
| D | 8 | 195 | 176949 | 1001.06 | 733 | 712 | 176.0 |
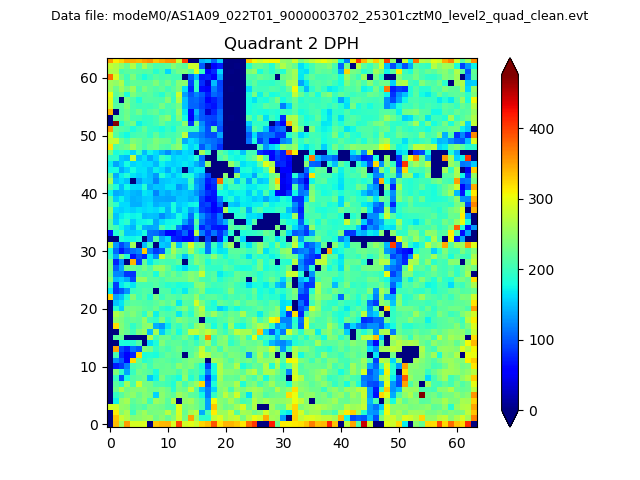
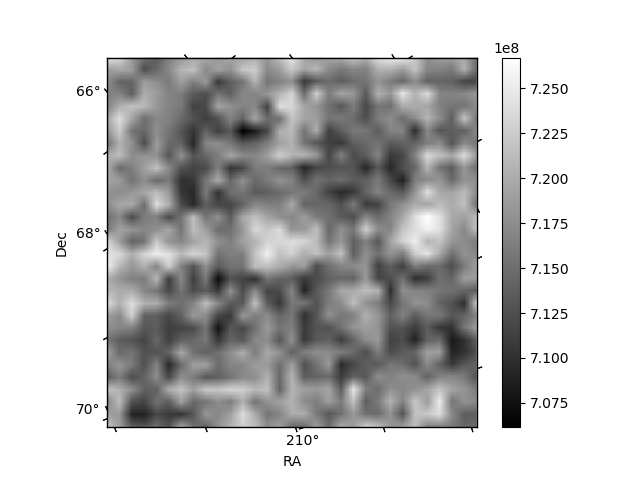
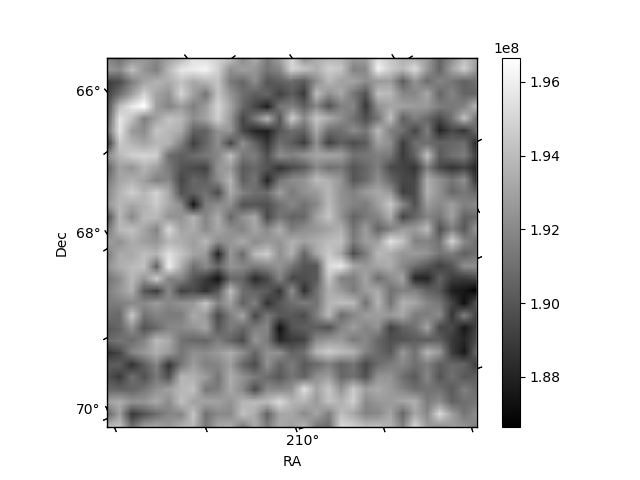
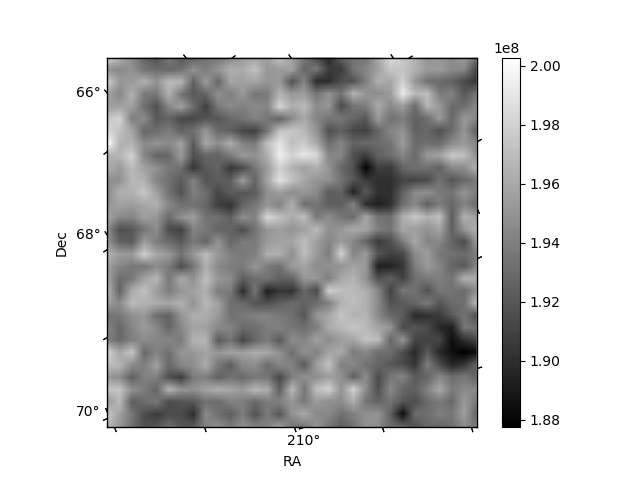
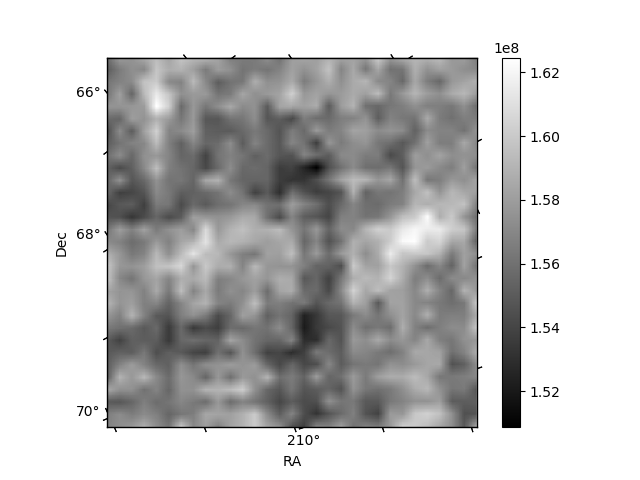
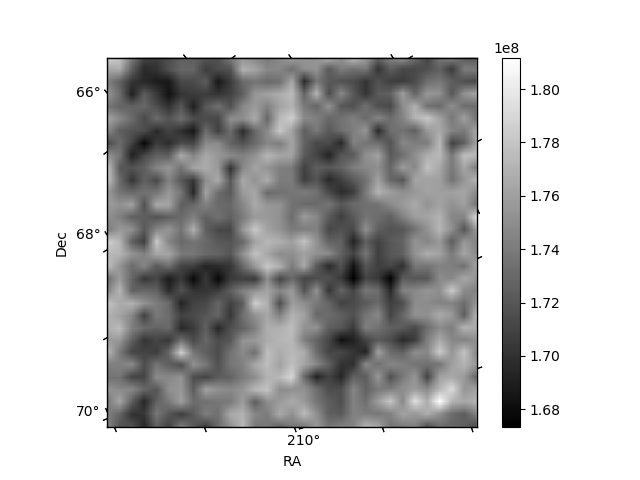
Histogram calculated using DETX and DETY for each event in the final _common_clean file
| Quadrant A | 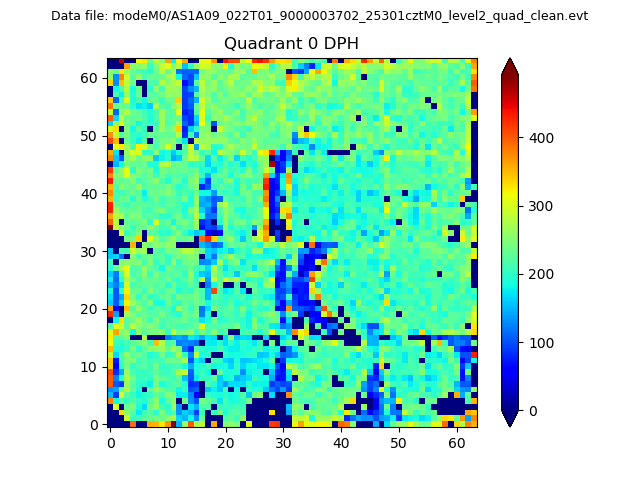 |
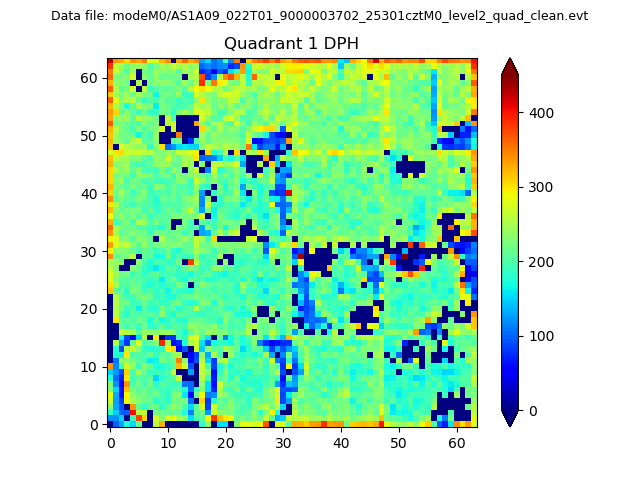 |
Quadrant B |
|---|---|---|---|
| Quadrant D | 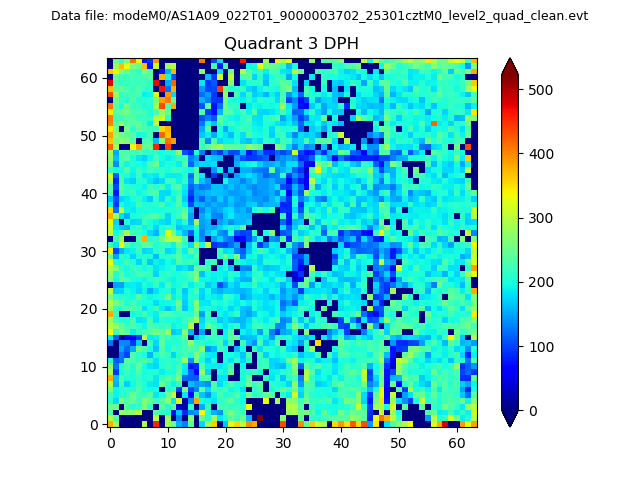 |
 |
Quadrant C |
| Plot type | Count rate plots | Images |
|---|---|---|
| Comparison with Poisson distribution Blue bars denote a histogram of data divided into 1 sec bins. Red curve is a Poisson curve with rate = median count rate of data. |
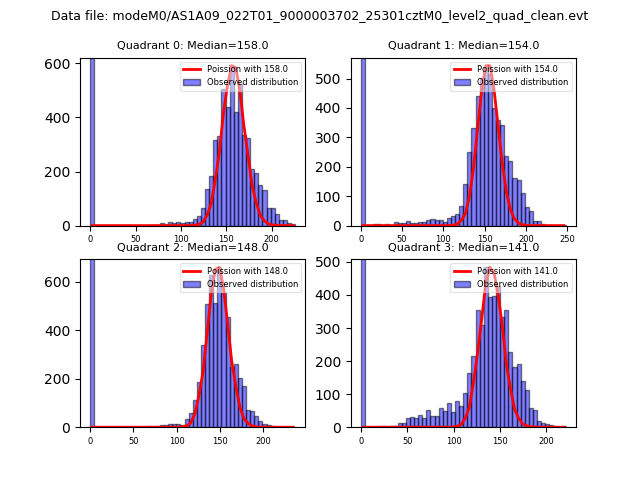 |
 |
| Quadrant-wise count rates Data is divided into 100 sec bins |
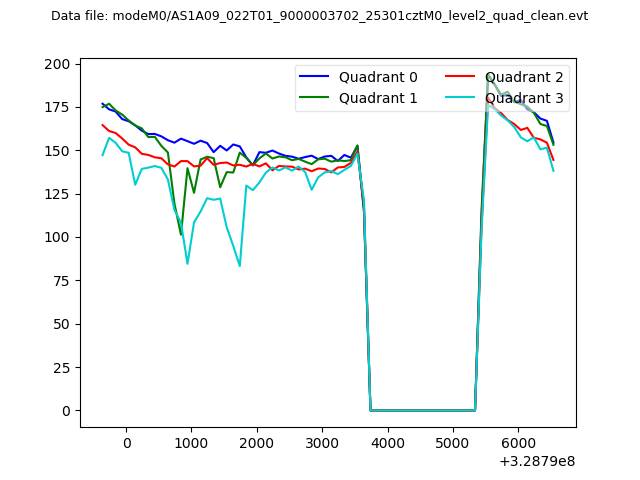 |
|
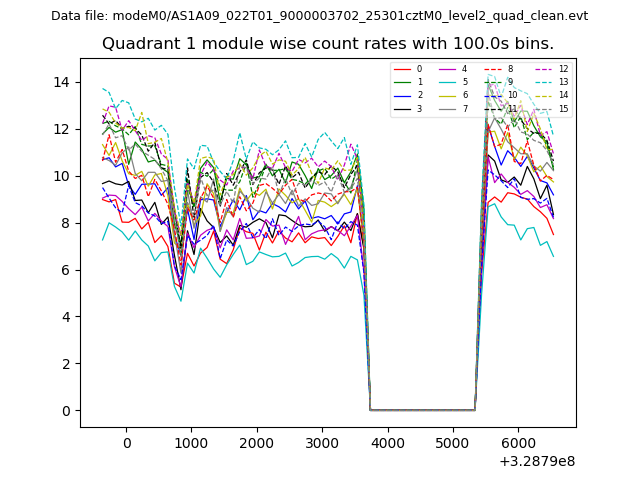
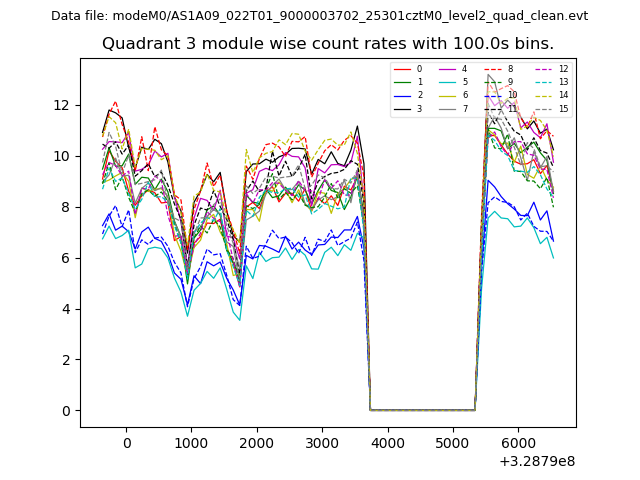
| Module-wise count rates for Quadrant A Data is divided into 100 sec bins |
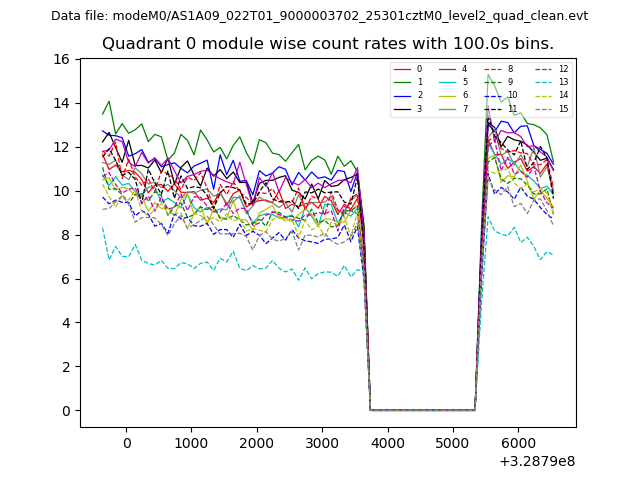 |
 |
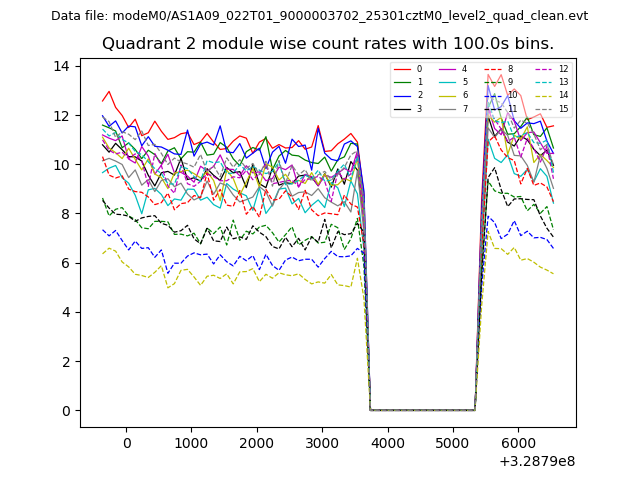
| Module-wise count rates for Quadrant B Data is divided into 100 sec bins |
 |
 |
| Module-wise count rates for Quadrant C Data is divided into 100 sec bins |
 |
 |
| Module-wise count rates for Quadrant D Data is divided into 100 sec bins |
 |
 |
| Parameter | Plot |
|---|---|
| CZT HV Monitor | 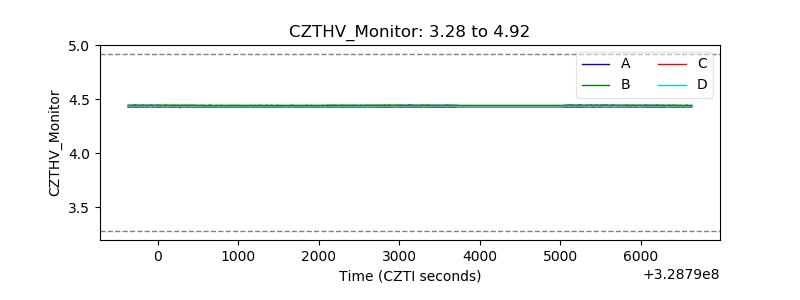 |
| D_VDD | 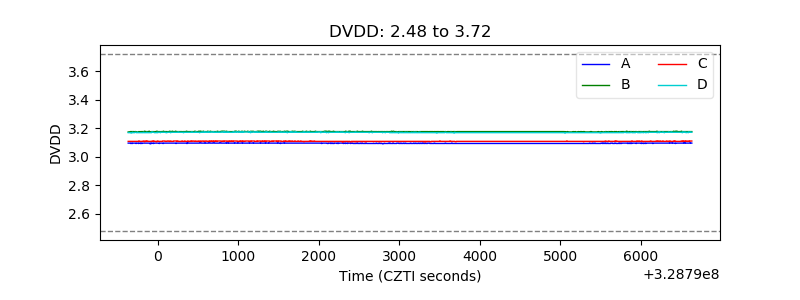 |
| Temperature 1 | 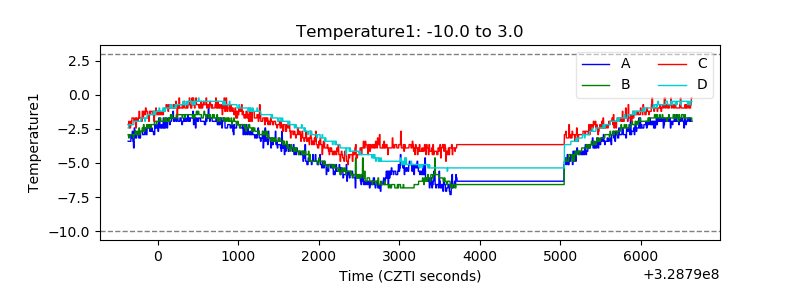 |
| Veto HV Monitor | 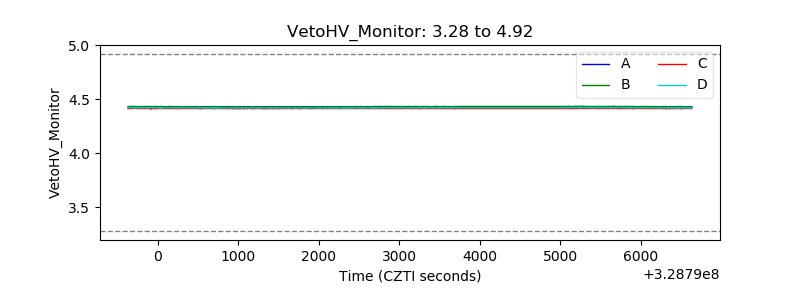 |
| Veto LLD | 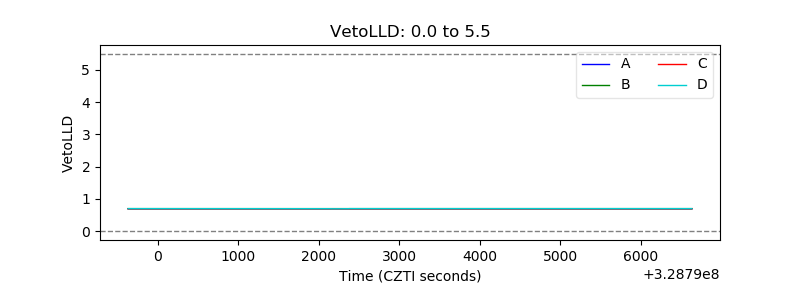 |
| Alpha Counter | 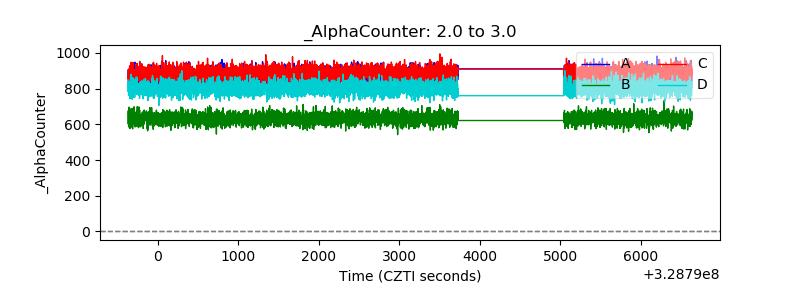 |
| _CPM_Rate | 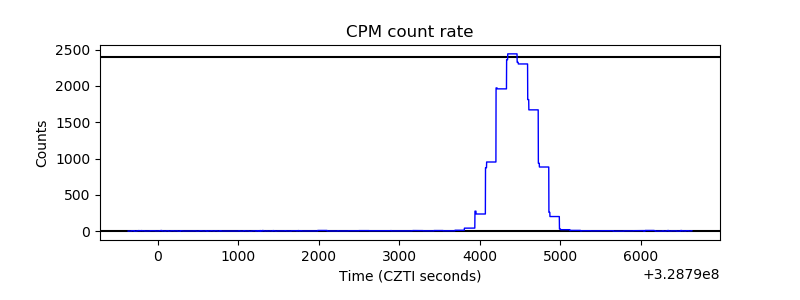 |
| CZT Counter | 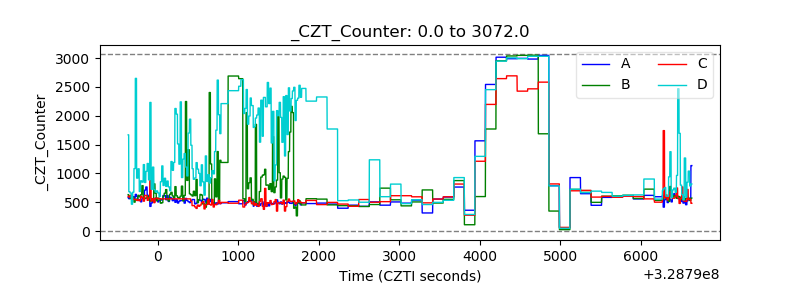 |
| +2.5 Volts monitor |  |
| +5 Volts monitor |  |
| _ROLL_ROT | 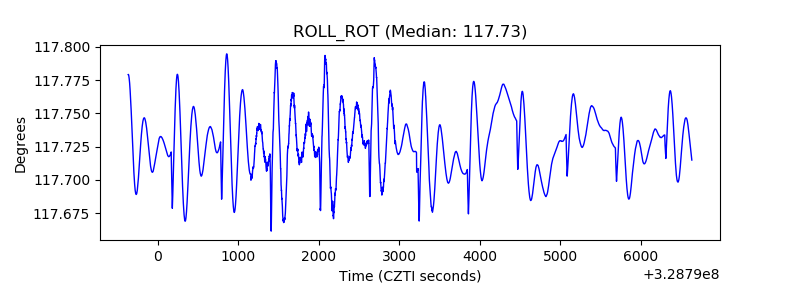 |
| _Roll_DEC |  |
| _Roll_RA | 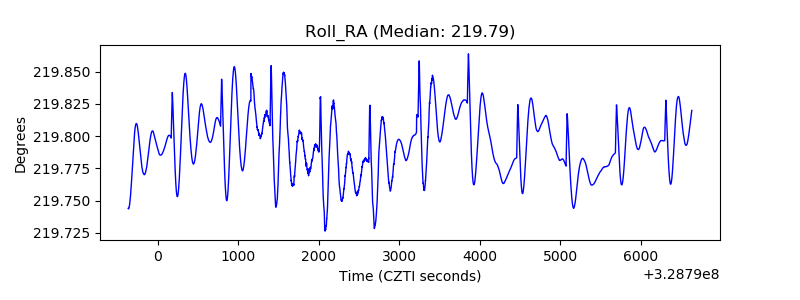 |
| Veto Counter | 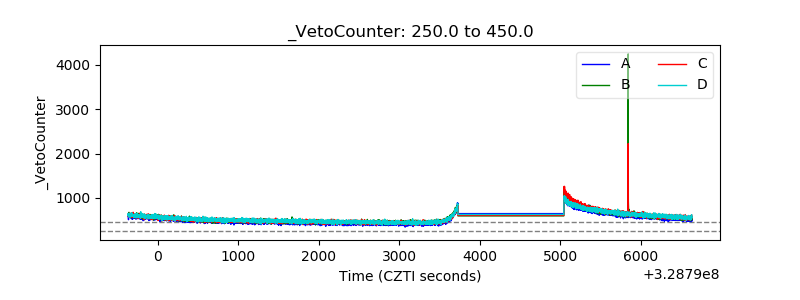 |