| Param | Original file | Final file |
|---|---|---|
| Filename | modeM0/AS1A09_022T01_9000003702_25302cztM0_level2.evt | modeM0/AS1A09_022T01_9000003702_25302cztM0_level2_quad_clean.evt |
| Size (bytes) | 521,945,280 | 132,609,600 |
| Size | 497.8 MB | 126.5 MB |
| Events in quadrant A | 3,949,968 | 921,896 |
| Events in quadrant B | 3,591,960 | 927,324 |
| Events in quadrant C | 3,428,502 | 882,079 |
| Events in quadrant D | 4,426,995 | 862,915 |
| Mode M9 | |||
|---|---|---|---|
| Quadrant | BADHDUFLAG | Total packets | Discarded packets |
| A | 0 | 14 | 0 |
| B | 0 | 14 | 0 |
| C | 0 | 14 | 0 |
| D | 0 | 14 | 0 |
| Mode M0 | |||
|---|---|---|---|
| Quadrant | BADHDUFLAG | Total packets | Discarded packets |
| A | 0 | 15814 | 0 |
| B | 0 | 14476 | 0 |
| C | 0 | 13887 | 0 |
| D | 0 | 17428 | 0 |
| Quadrant | Total seconds | Saturated seconds | Saturation percentage |
|---|---|---|---|
| A | 6052 | 117 | 1.933245% |
| B | 6053 | 148 | 2.445069% |
| C | 6053 | 144 | 2.378986% |
| D | 6052 | 203 | 3.354263% |
Noise dominated data is calculated using 1-second bins in cleaned event files. If a bin has >2000 counts, and if more than 50% of those come from <1% of pixels, then it is considered to be noise-dominated and hence unusable.
| Quadrant | # 1 sec bins | Bins with >0 counts | Bins with >2000 counts | High rate bins dominated by noise | Noise dominated (total time) | Noise dominated (detector-on time) | Marked lightcurve |
|---|---|---|---|---|---|---|---|
| A | 7417 | 6053 | 18 | 18 | 0.24% | 0.30% | 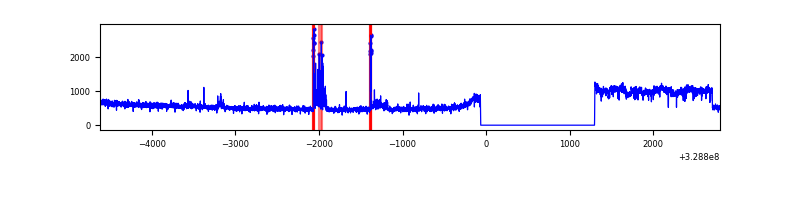 |
| B | 7418 | 6054 | 24 | 24 | 0.32% | 0.40% | 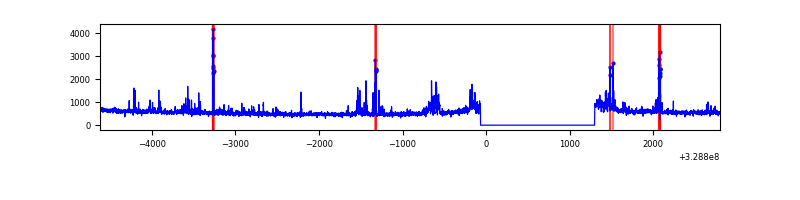 |
| C | 7418 | 6054 | 21 | 21 | 0.28% | 0.35% | 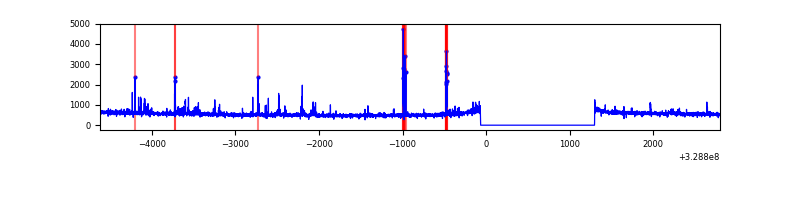 |
| D | 7418 | 6054 | 106 | 106 | 1.43% | 1.75% | 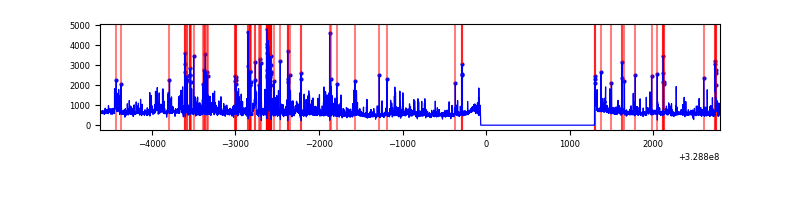 |
Top three noisy pixels from each quadrant. If the there are fewer than three noisy pixels in the level2.evt file, extra rows are filled as -1
| Pixel properties | Quadrant properties | ||||||
|---|---|---|---|---|---|---|---|
| Quadrant | DetID | PixID | Counts | Sigma | Mean | Median | Sigma |
| A | 15 | 173 | 593321 | 3584.0 | 835 | 819 | 165.3 |
| A | 11 | 29 | 118896 | 714.24 | 835 | 819 | 165.3 |
| A | 6 | 16 | 13674 | 77.76 | 835 | 819 | 165.3 |
| B | 3 | 64 | 351711 | 2341.1 | 815 | 798 | 149.9 |
| B | 15 | 33 | 31316 | 203.6 | 815 | 798 | 149.9 |
| B | 0 | 190 | 22031 | 141.65 | 815 | 798 | 149.9 |
| C | 0 | 239 | 171358 | 934.2 | 795 | 801 | 182.6 |
| C | 14 | 238 | 129039 | 702.4 | 795 | 801 | 182.6 |
| C | 3 | 233 | 27115 | 144.13 | 795 | 801 | 182.6 |
| D | 1 | 52 | 885018 | 4605.36 | 808 | 788 | 192.0 |
| D | 8 | 195 | 155983 | 808.31 | 808 | 788 | 192.0 |
| D | 12 | 235 | 91211 | 470.95 | 808 | 788 | 192.0 |
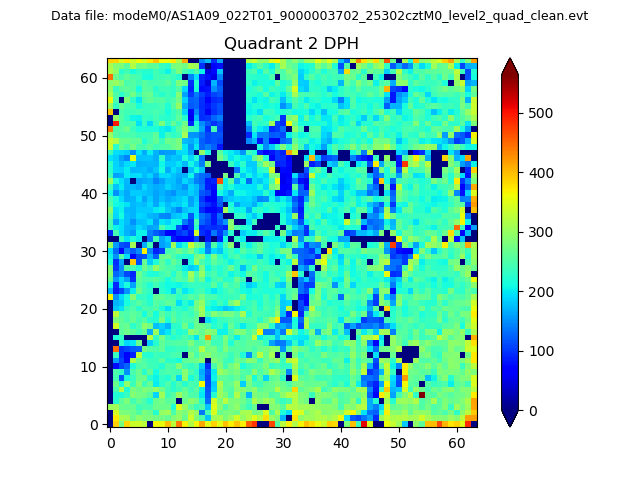
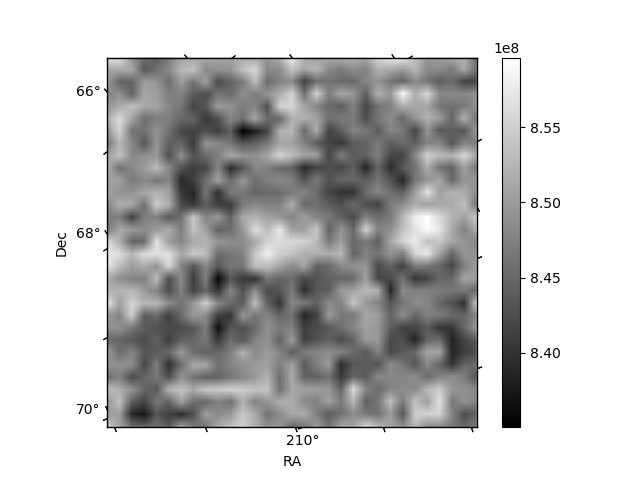
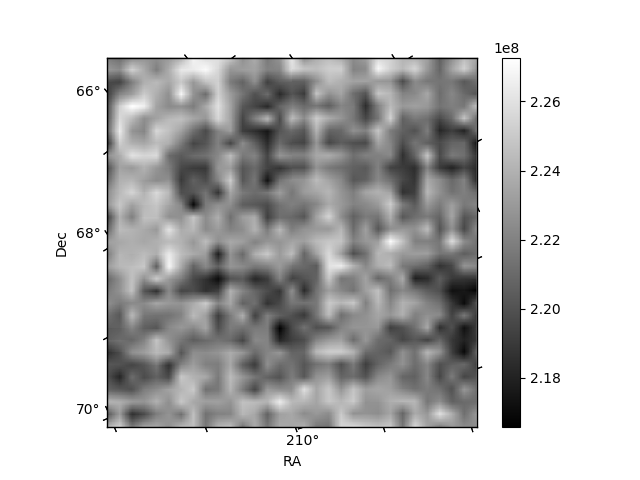
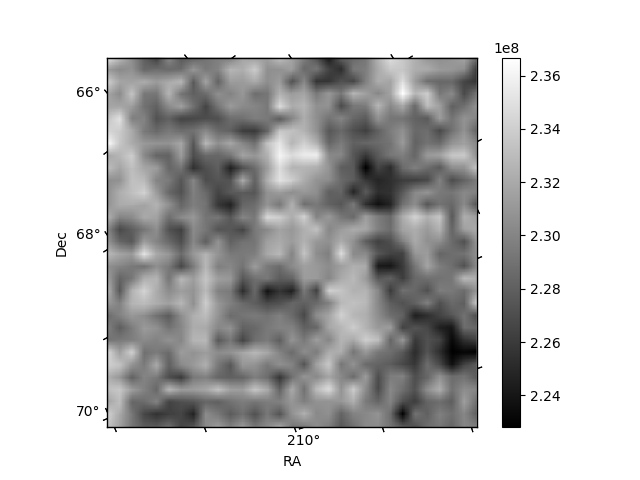
Histogram calculated using DETX and DETY for each event in the final _common_clean file
| Quadrant A | 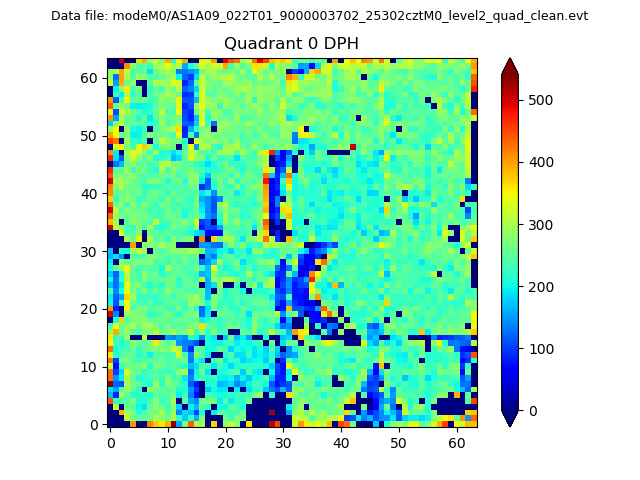 |
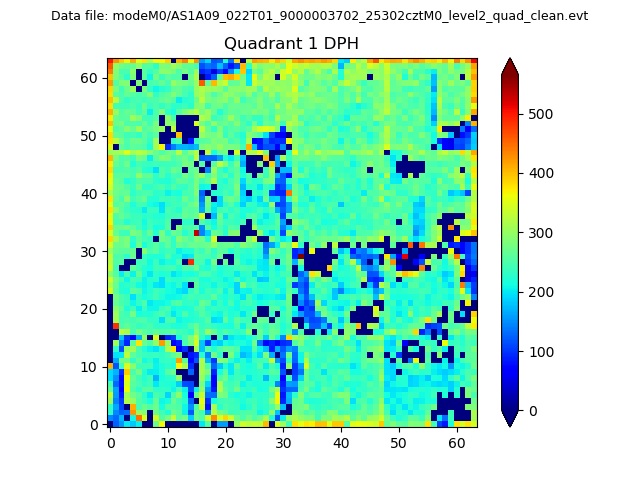 |
Quadrant B |
|---|---|---|---|
| Quadrant D | 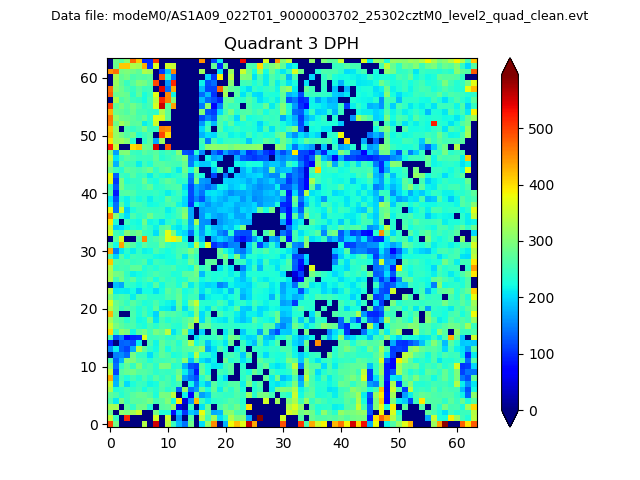 |
 |
Quadrant C |
| Plot type | Count rate plots | Images |
|---|---|---|
| Comparison with Poisson distribution Blue bars denote a histogram of data divided into 1 sec bins. Red curve is a Poisson curve with rate = median count rate of data. |
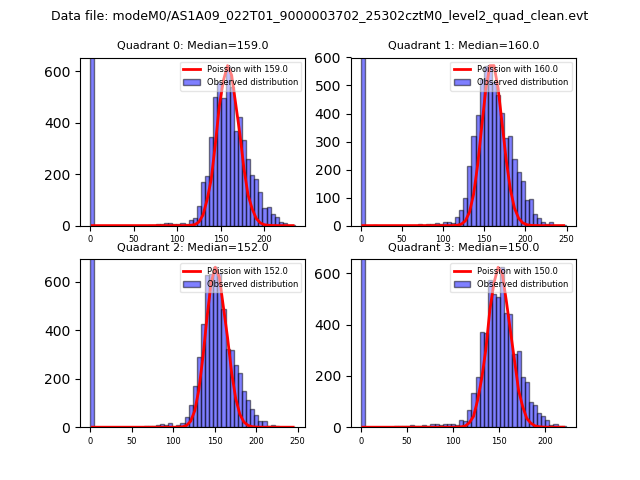 |
 |
| Quadrant-wise count rates Data is divided into 100 sec bins |
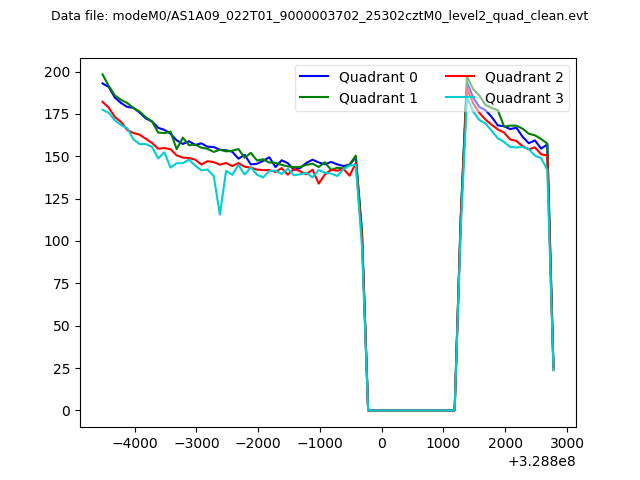 |
|
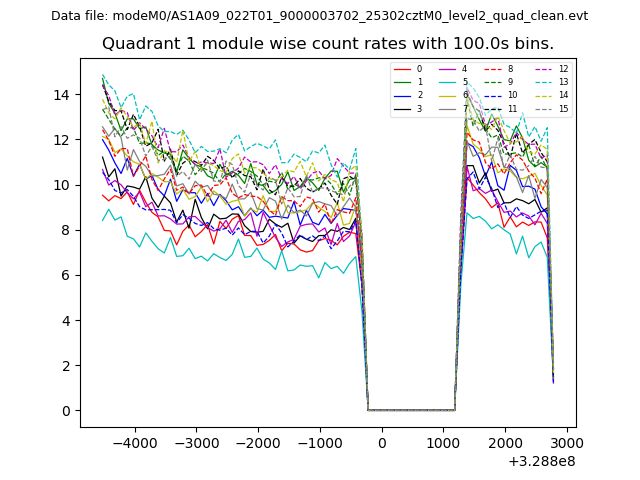
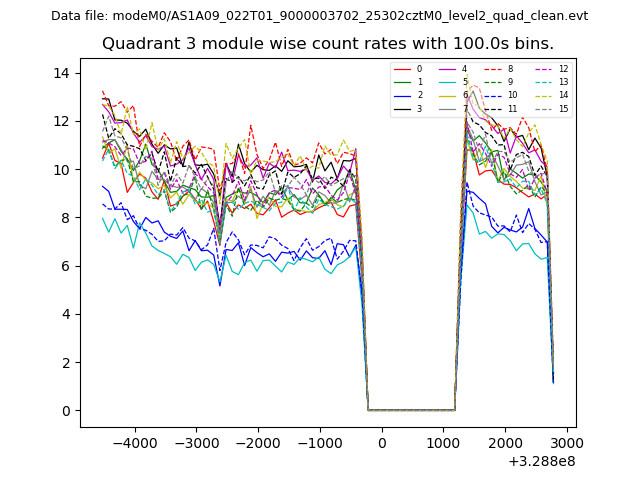
| Module-wise count rates for Quadrant A Data is divided into 100 sec bins |
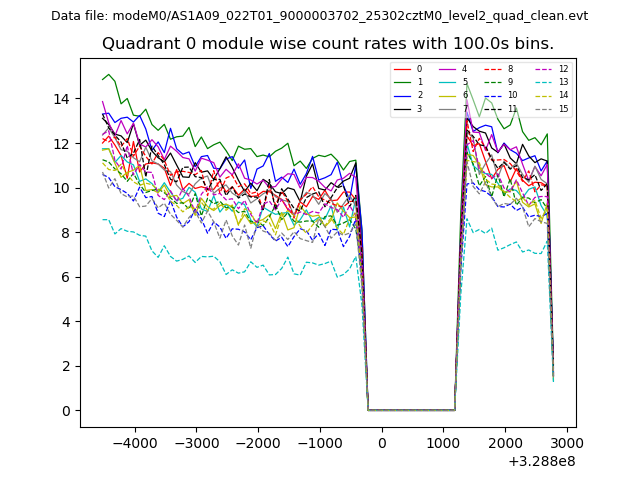 |
 |
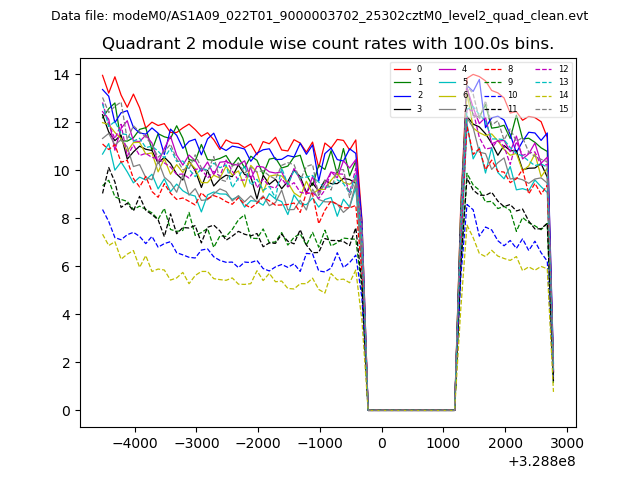
| Module-wise count rates for Quadrant B Data is divided into 100 sec bins |
 |
 |
| Module-wise count rates for Quadrant C Data is divided into 100 sec bins |
 |
 |
| Module-wise count rates for Quadrant D Data is divided into 100 sec bins |
 |
 |
| Parameter | Plot |
|---|---|
| CZT HV Monitor | 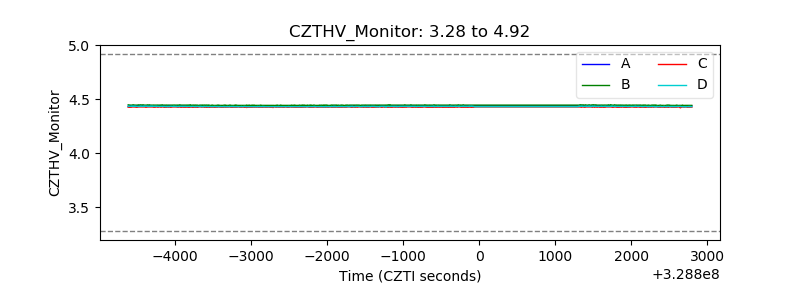 |
| D_VDD | 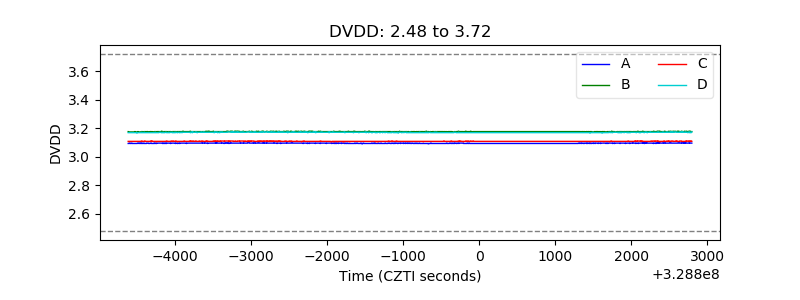 |
| Temperature 1 | 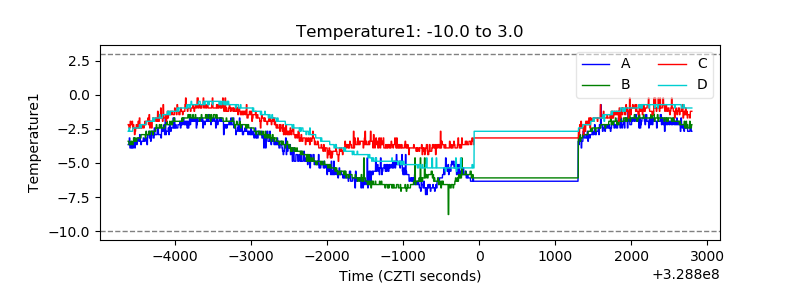 |
| Veto HV Monitor | 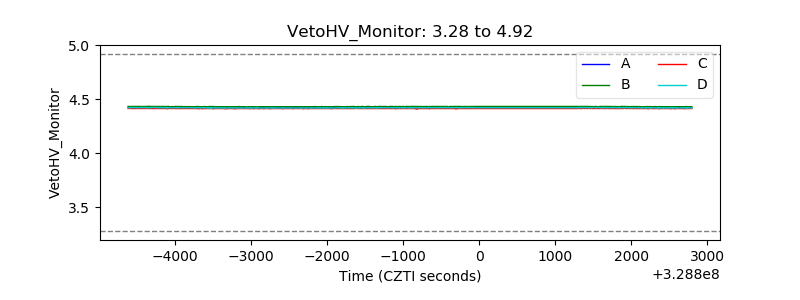 |
| Veto LLD | 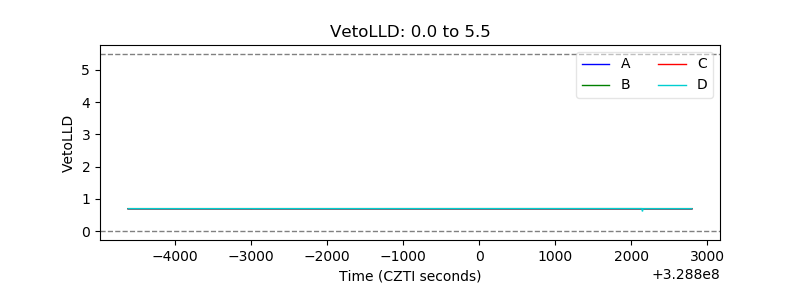 |
| Alpha Counter | 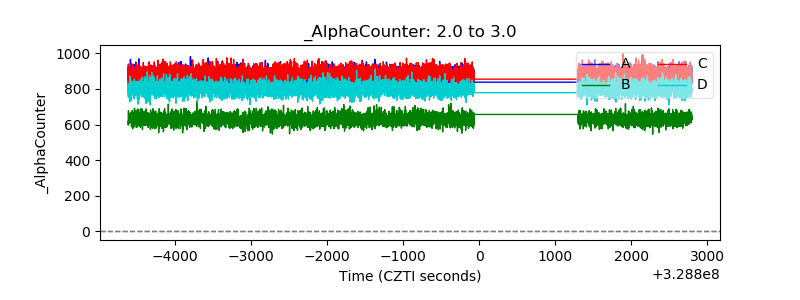 |
| _CPM_Rate | 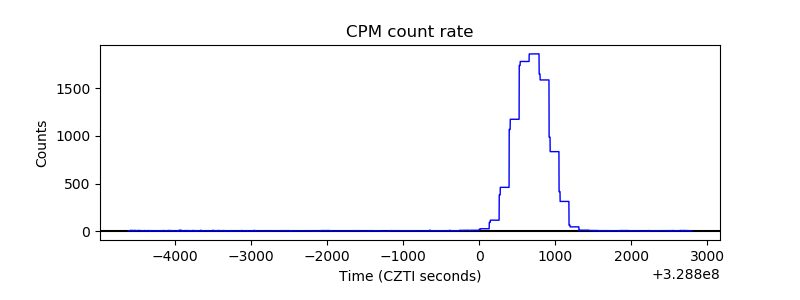 |
| CZT Counter | 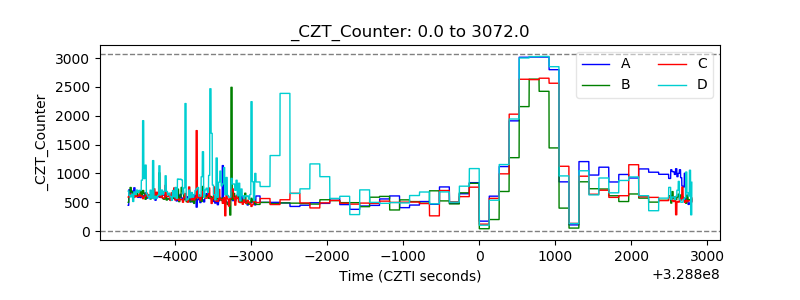 |
| +2.5 Volts monitor |  |
| +5 Volts monitor | 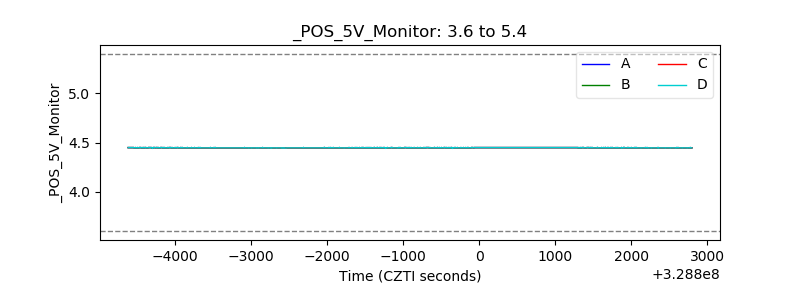 |
| _ROLL_ROT | 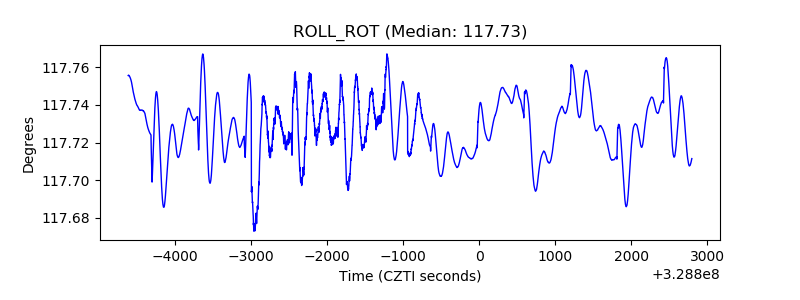 |
| _Roll_DEC | 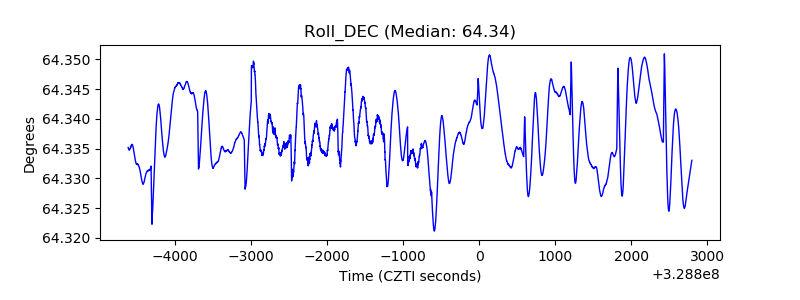 |
| _Roll_RA | 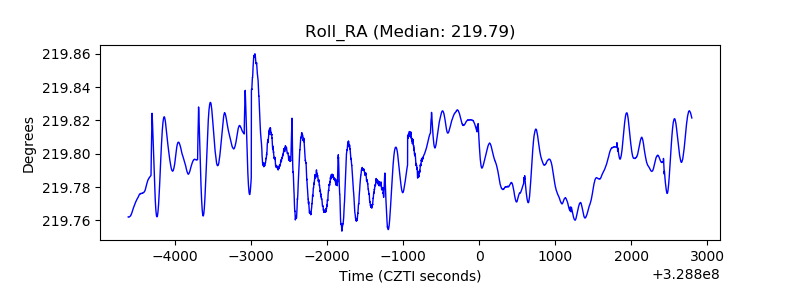 |
| Veto Counter | 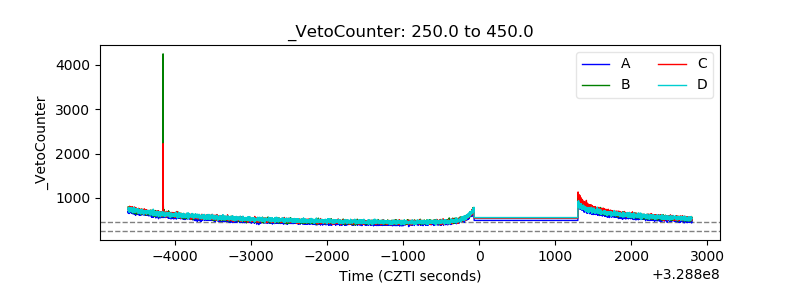 |