| Param | Original file | Final file |
|---|---|---|
| Filename | modeM0/AS1A09_022T01_9000003702_25306cztM0_level2.evt | modeM0/AS1A09_022T01_9000003702_25306cztM0_level2_quad_clean.evt |
| Size (bytes) | 702,403,200 | 117,233,280 |
| Size | 669.9 MB | 111.8 MB |
| Events in quadrant A | 3,608,247 | 797,654 |
| Events in quadrant B | 3,861,316 | 796,843 |
| Events in quadrant C | 3,691,916 | 772,293 |
| Events in quadrant D | 9,594,256 | 652,488 |
| Mode M9 | |||
|---|---|---|---|
| Quadrant | BADHDUFLAG | Total packets | Discarded packets |
| A | 0 | 7 | 0 |
| B | 0 | 8 | 0 |
| C | 0 | 8 | 0 |
| D | 0 | 8 | 0 |
| Mode M0 | |||
|---|---|---|---|
| Quadrant | BADHDUFLAG | Total packets | Discarded packets |
| A | 0 | 15850 | 0 |
| B | 0 | 16579 | 0 |
| C | 0 | 15970 | 0 |
| D | 0 | 33759 | 0 |
| Quadrant | Total seconds | Saturated seconds | Saturation percentage |
|---|---|---|---|
| A | 7627 | 54 | 0.708011% |
| B | 7627 | 147 | 1.927363% |
| C | 7627 | 147 | 1.927363% |
| D | 7627 | 2119 | 27.782877% |
Noise dominated data is calculated using 1-second bins in cleaned event files. If a bin has >2000 counts, and if more than 50% of those come from <1% of pixels, then it is considered to be noise-dominated and hence unusable.
| Quadrant | # 1 sec bins | Bins with >0 counts | Bins with >2000 counts | High rate bins dominated by noise | Noise dominated (total time) | Noise dominated (detector-on time) | Marked lightcurve |
|---|---|---|---|---|---|---|---|
| A | 7817 | 7629 | 0 | 0 | 0.00% | 0.00% | 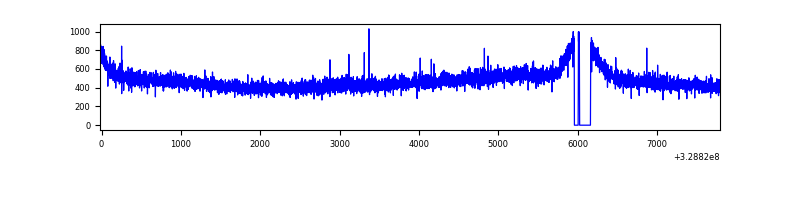 |
| B | 7817 | 7629 | 23 | 23 | 0.29% | 0.30% | 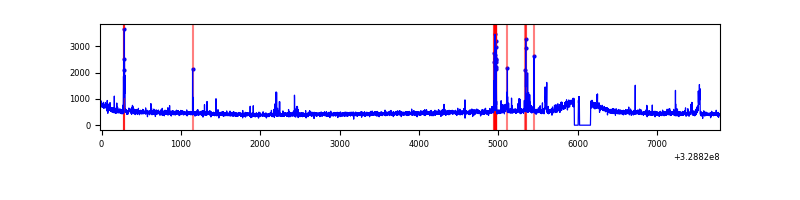 |
| C | 7817 | 7629 | 0 | 0 | 0.00% | 0.00% | 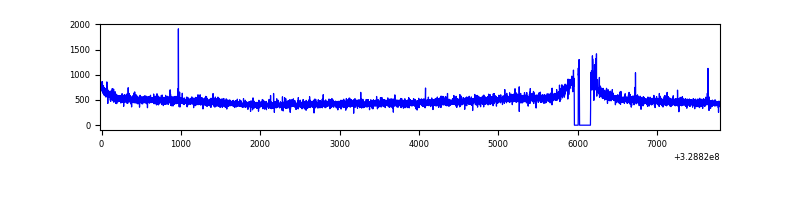 |
| D | 7817 | 7629 | 1744 | 1744 | 22.31% | 22.86% | 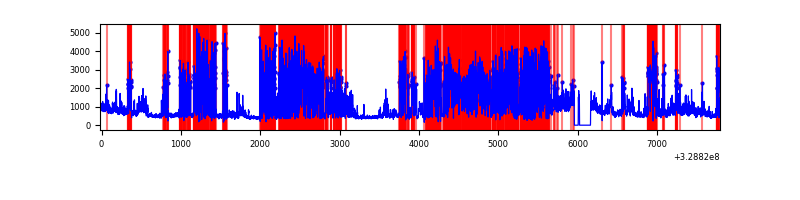 |
Top three noisy pixels from each quadrant. If the there are fewer than three noisy pixels in the level2.evt file, extra rows are filled as -1
| Pixel properties | Quadrant properties | ||||||
|---|---|---|---|---|---|---|---|
| Quadrant | DetID | PixID | Counts | Sigma | Mean | Median | Sigma |
| A | 13 | 158 | 14460 | 72.27 | 928 | 907 | 187.5 |
| A | 13 | 254 | 14126 | 70.49 | 928 | 907 | 187.5 |
| A | 3 | 137 | 8514 | 40.57 | 928 | 907 | 187.5 |
| B | 3 | 64 | 195780 | 1123.44 | 920 | 894 | 173.5 |
| B | 0 | 190 | 25351 | 140.98 | 920 | 894 | 173.5 |
| B | 12 | 111 | 21069 | 116.3 | 920 | 894 | 173.5 |
| C | 14 | 238 | 141456 | 666.67 | 897 | 901 | 210.8 |
| C | 3 | 233 | 48268 | 224.67 | 897 | 901 | 210.8 |
| C | 13 | 61 | 6344 | 25.81 | 897 | 901 | 210.8 |
| D | 1 | 52 | 5445325 | 27782.21 | 807 | 783 | 196.0 |
| D | 8 | 195 | 653395 | 3330.12 | 807 | 783 | 196.0 |
| D | 12 | 235 | 238755 | 1214.31 | 807 | 783 | 196.0 |
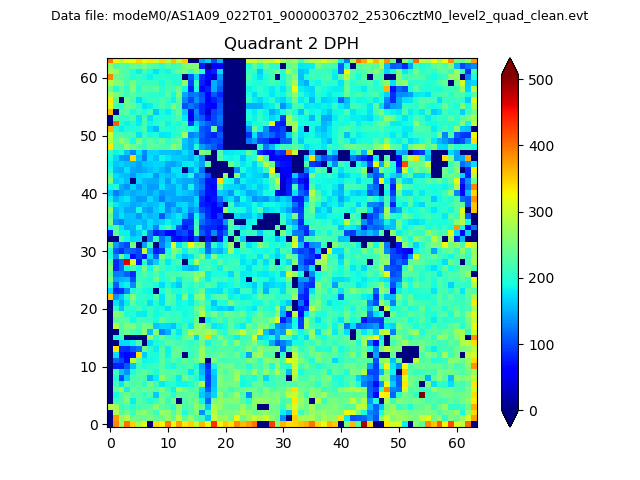
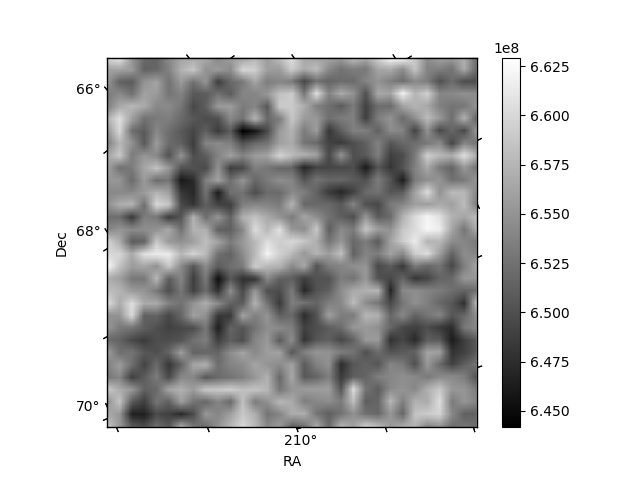
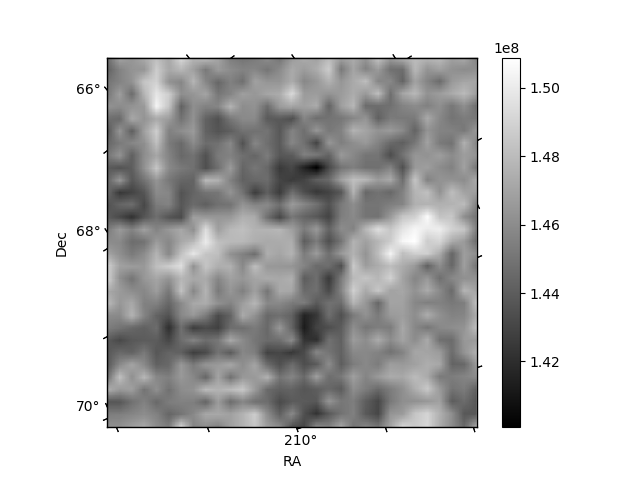
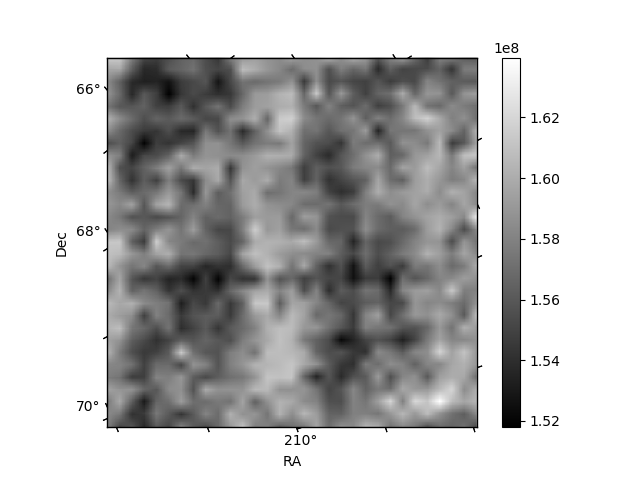
Histogram calculated using DETX and DETY for each event in the final _common_clean file
| Quadrant A | 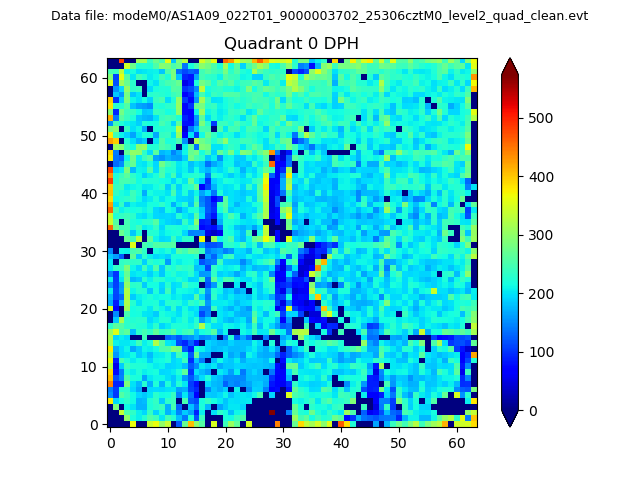 |
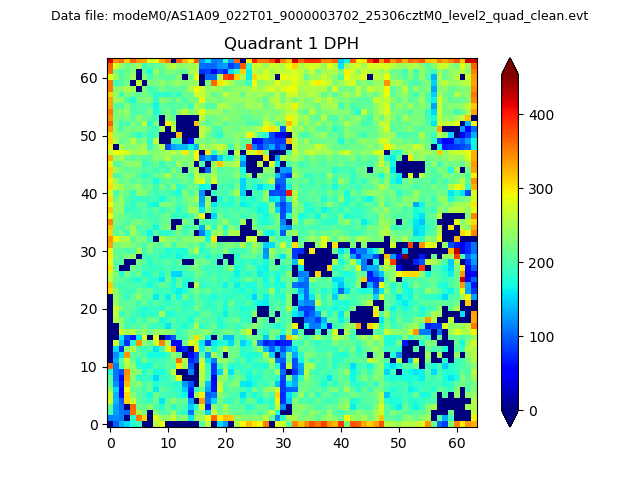 |
Quadrant B |
|---|---|---|---|
| Quadrant D | 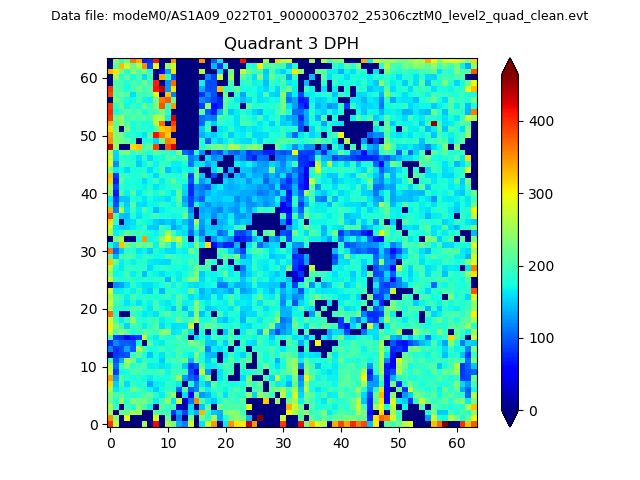 |
 |
Quadrant C |
| Plot type | Count rate plots | Images |
|---|---|---|
| Comparison with Poisson distribution Blue bars denote a histogram of data divided into 1 sec bins. Red curve is a Poisson curve with rate = median count rate of data. |
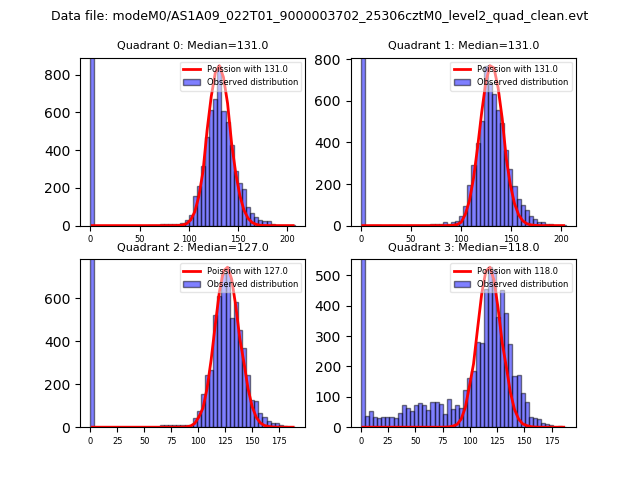 |
 |
| Quadrant-wise count rates Data is divided into 100 sec bins |
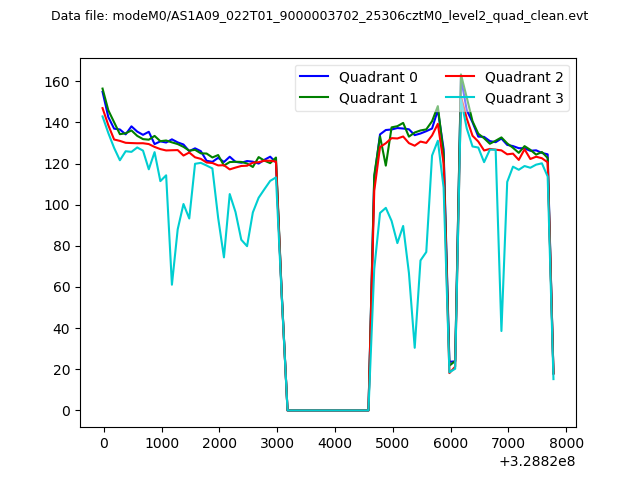 |
|
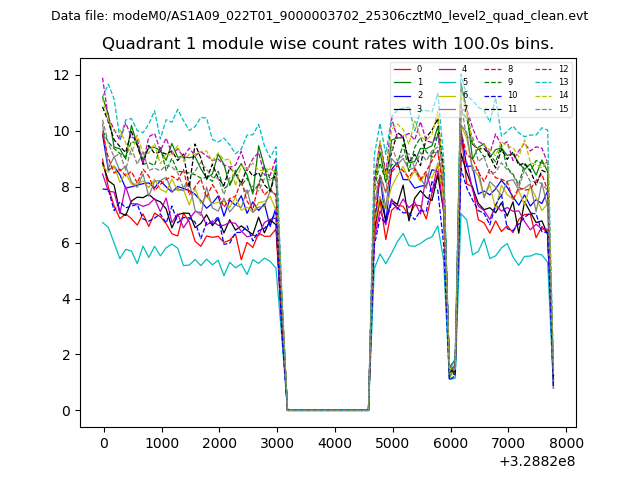
| Module-wise count rates for Quadrant A Data is divided into 100 sec bins |
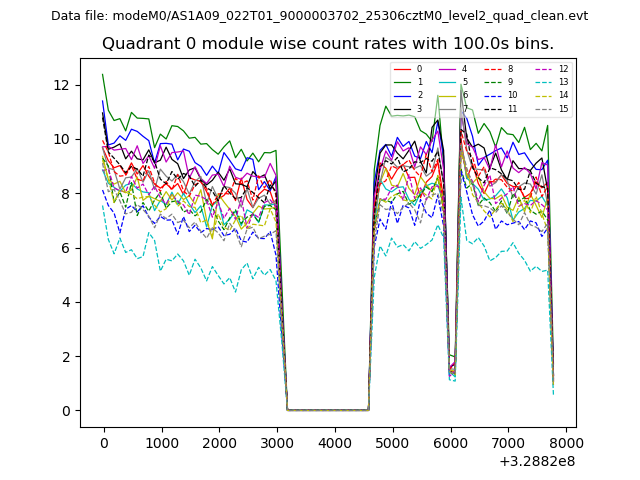 |
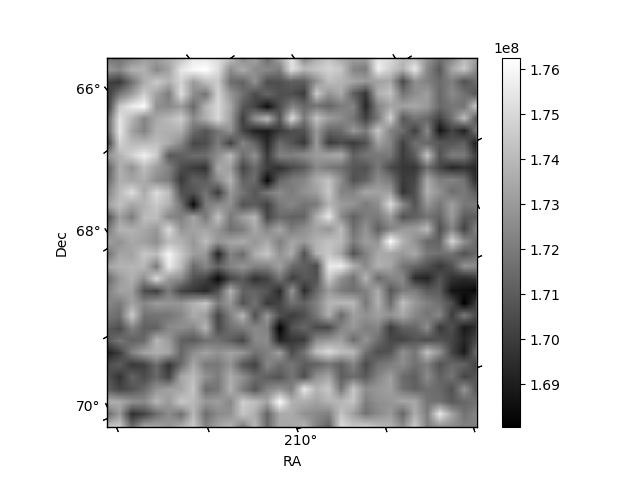 |
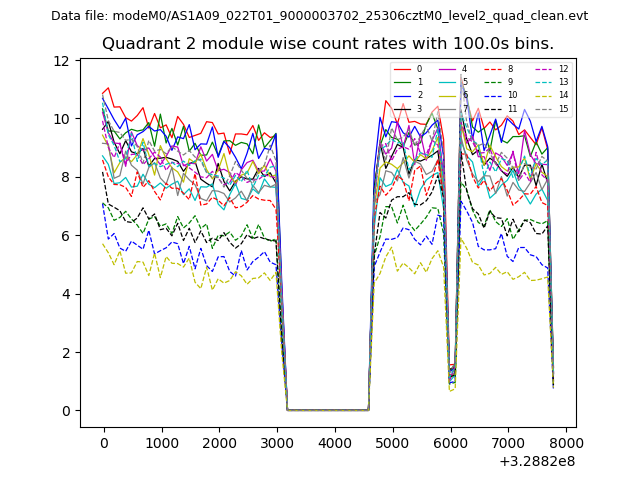
| Module-wise count rates for Quadrant B Data is divided into 100 sec bins |
 |
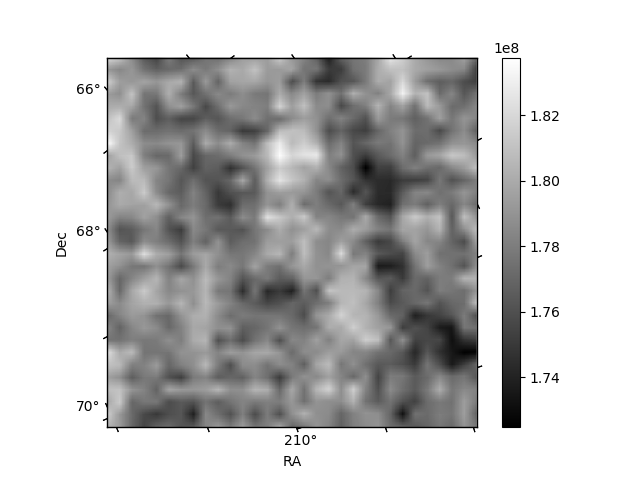 |
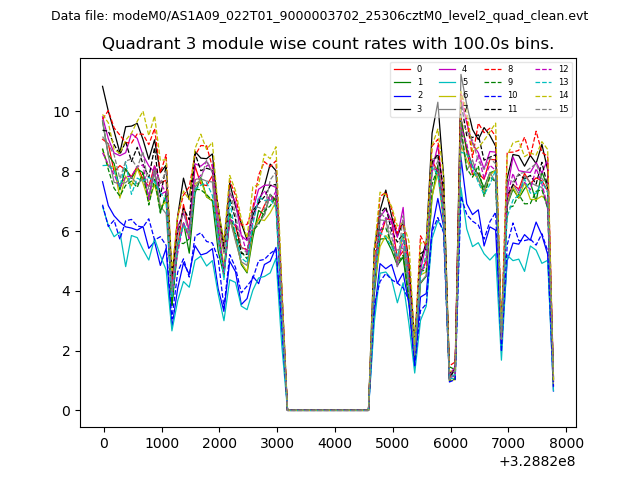
| Module-wise count rates for Quadrant C Data is divided into 100 sec bins |
 |
 |
| Module-wise count rates for Quadrant D Data is divided into 100 sec bins |
 |
 |
| Parameter | Plot |
|---|---|
| CZT HV Monitor | 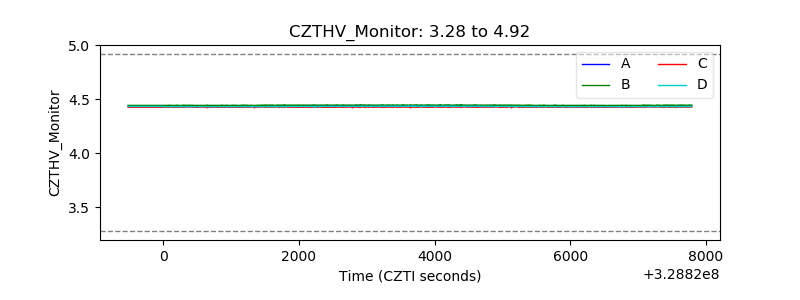 |
| D_VDD | 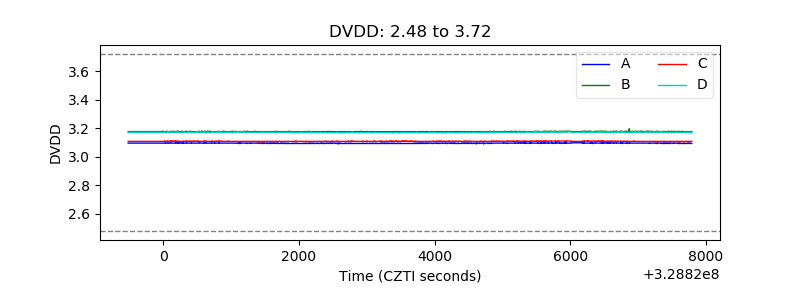 |
| Temperature 1 | 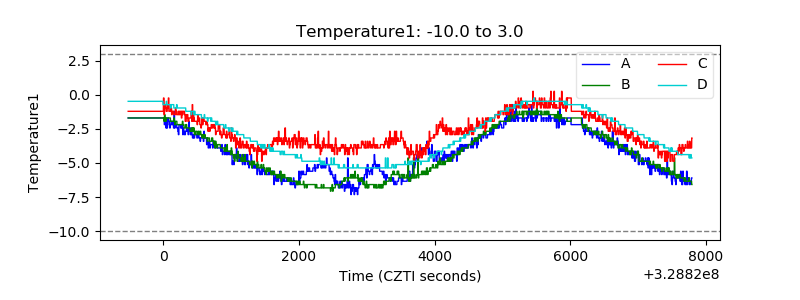 |
| Veto HV Monitor | 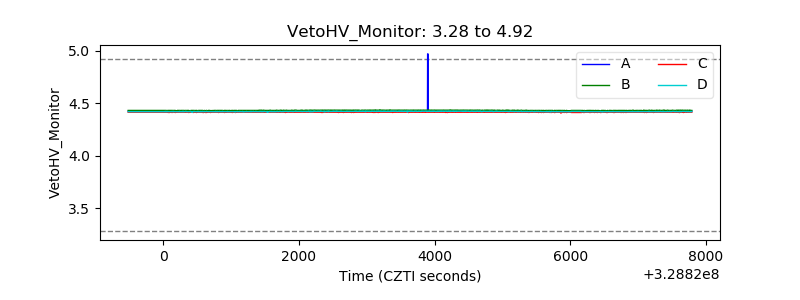 |
| Veto LLD | 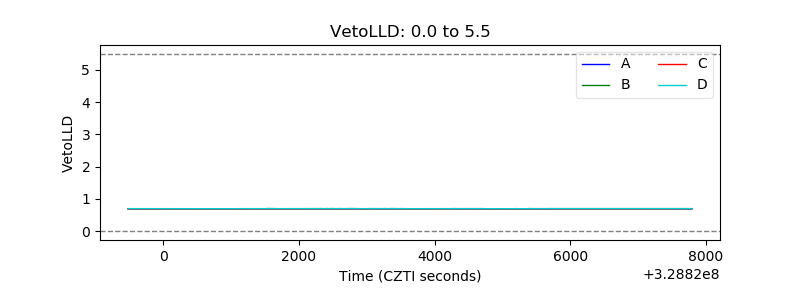 |
| Alpha Counter | 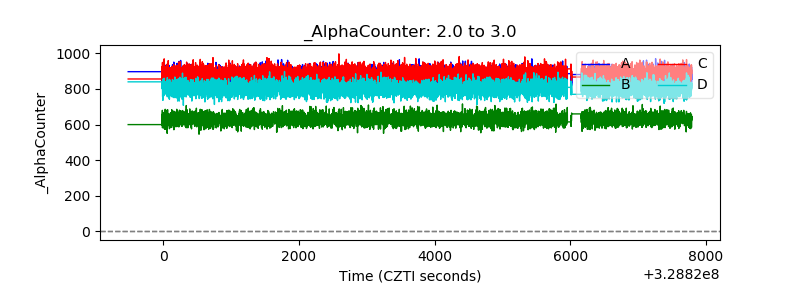 |
| _CPM_Rate | 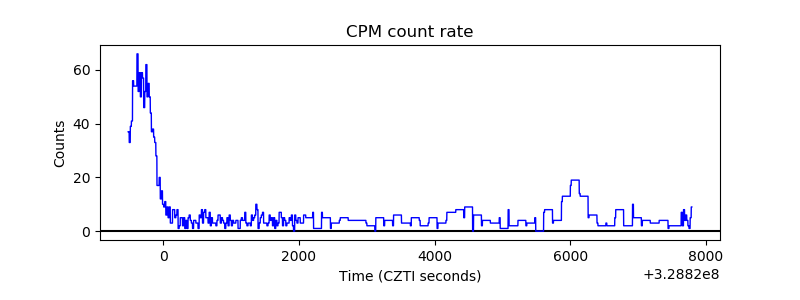 |
| CZT Counter | 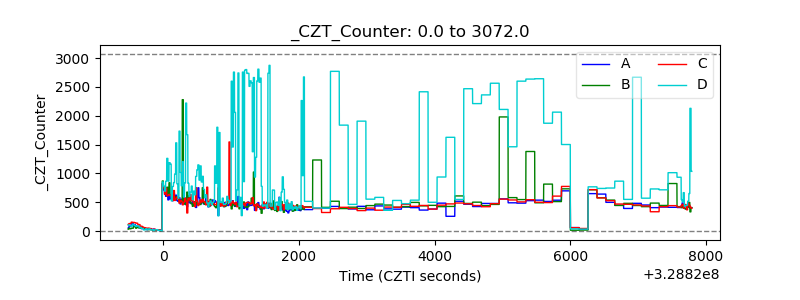 |
| +2.5 Volts monitor |  |
| +5 Volts monitor |  |
| _ROLL_ROT | 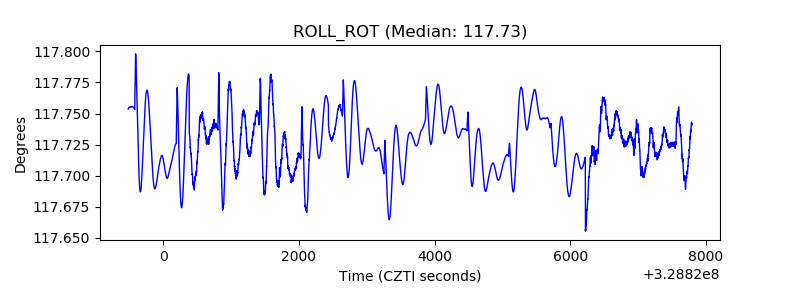 |
| _Roll_DEC | 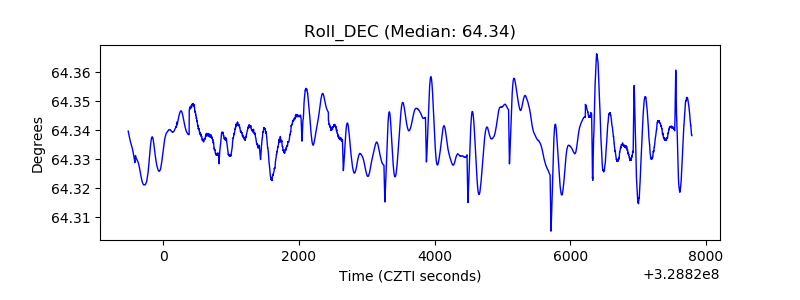 |
| _Roll_RA | 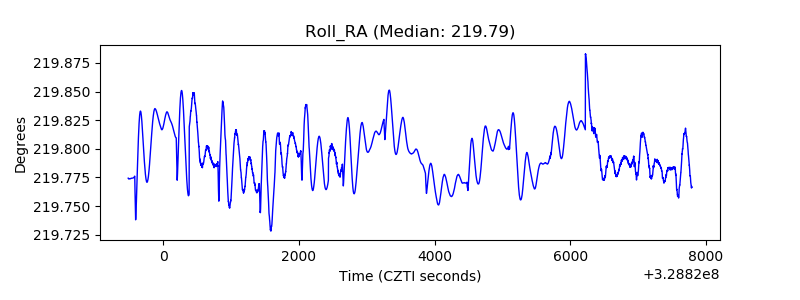 |
| Veto Counter | 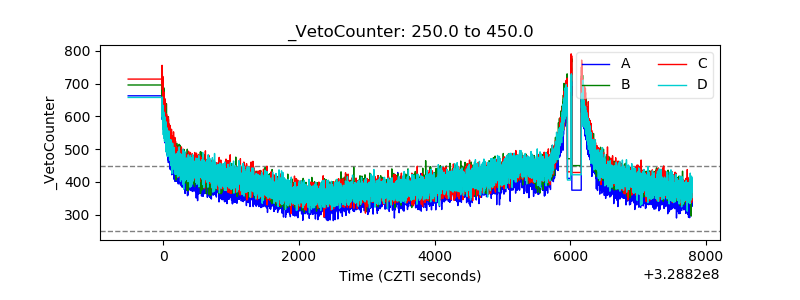 |