| Param | Original file | Final file |
|---|---|---|
| Filename | modeM0/AS1A09_022T01_9000003702_25307cztM0_level2.evt | modeM0/AS1A09_022T01_9000003702_25307cztM0_level2_quad_clean.evt |
| Size (bytes) | 614,076,480 | 127,848,960 |
| Size | 585.6 MB | 121.9 MB |
| Events in quadrant A | 3,808,366 | 851,279 |
| Events in quadrant B | 4,008,348 | 854,266 |
| Events in quadrant C | 3,964,162 | 823,541 |
| Events in quadrant D | 6,269,076 | 781,693 |
| Mode M9 | |||
|---|---|---|---|
| Quadrant | BADHDUFLAG | Total packets | Discarded packets |
| A | 0 | 5 | 0 |
| B | 0 | 5 | 0 |
| C | 0 | 5 | 0 |
| D | 0 | 5 | 0 |
| Mode M0 | |||
|---|---|---|---|
| Quadrant | BADHDUFLAG | Total packets | Discarded packets |
| A | 0 | 16888 | 0 |
| B | 0 | 17344 | 0 |
| C | 0 | 17109 | 0 |
| D | 0 | 24131 | 0 |
| Quadrant | Total seconds | Saturated seconds | Saturation percentage |
|---|---|---|---|
| A | 8080 | 83 | 1.027228% |
| B | 8081 | 143 | 1.769583% |
| C | 8081 | 192 | 2.375944% |
| D | 8080 | 538 | 6.658416% |
Noise dominated data is calculated using 1-second bins in cleaned event files. If a bin has >2000 counts, and if more than 50% of those come from <1% of pixels, then it is considered to be noise-dominated and hence unusable.
| Quadrant | # 1 sec bins | Bins with >0 counts | Bins with >2000 counts | High rate bins dominated by noise | Noise dominated (total time) | Noise dominated (detector-on time) | Marked lightcurve |
|---|---|---|---|---|---|---|---|
| A | 8515 | 8083 | 0 | 0 | 0.00% | 0.00% | 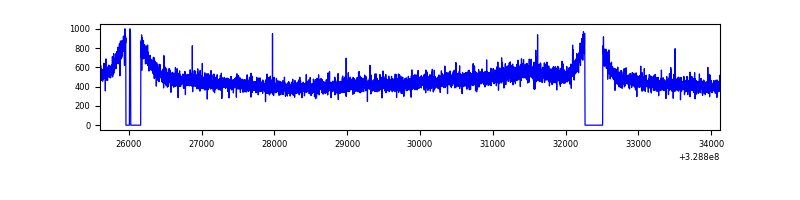 |
| B | 8516 | 8084 | 6 | 6 | 0.07% | 0.07% | 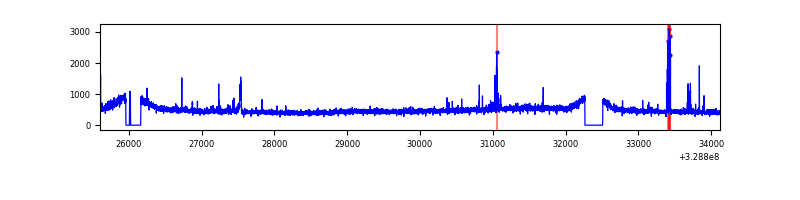 |
| C | 8516 | 8084 | 0 | 0 | 0.00% | 0.00% | 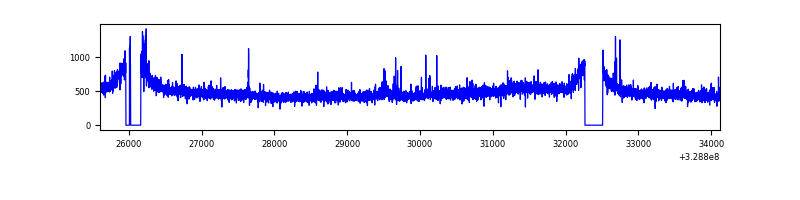 |
| D | 8516 | 8084 | 329 | 329 | 3.86% | 4.07% | 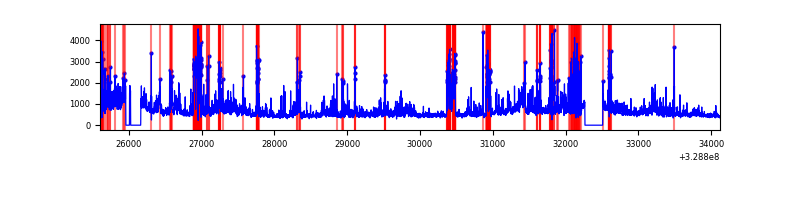 |
Top three noisy pixels from each quadrant. If the there are fewer than three noisy pixels in the level2.evt file, extra rows are filled as -1
| Pixel properties | Quadrant properties | ||||||
|---|---|---|---|---|---|---|---|
| Quadrant | DetID | PixID | Counts | Sigma | Mean | Median | Sigma |
| A | 13 | 254 | 14330 | 67.15 | 986 | 963 | 199.1 |
| A | 3 | 137 | 9005 | 40.4 | 986 | 963 | 199.1 |
| A | 0 | 226 | 8499 | 37.86 | 986 | 963 | 199.1 |
| B | 3 | 64 | 101508 | 537.24 | 981 | 952 | 187.2 |
| B | 3 | 112 | 34651 | 180.04 | 981 | 952 | 187.2 |
| B | 12 | 111 | 22715 | 116.27 | 981 | 952 | 187.2 |
| C | 14 | 238 | 151376 | 671.76 | 955 | 960 | 223.9 |
| C | 3 | 233 | 57984 | 254.67 | 955 | 960 | 223.9 |
| C | 0 | 239 | 23777 | 101.9 | 955 | 960 | 223.9 |
| D | 1 | 52 | 1132096 | 4952.68 | 941 | 913 | 228.4 |
| D | 8 | 195 | 765959 | 3349.61 | 941 | 913 | 228.4 |
| D | 12 | 233 | 367524 | 1605.14 | 941 | 913 | 228.4 |
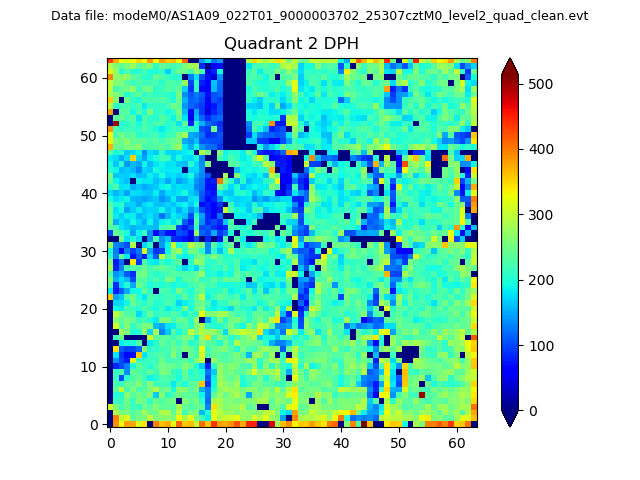
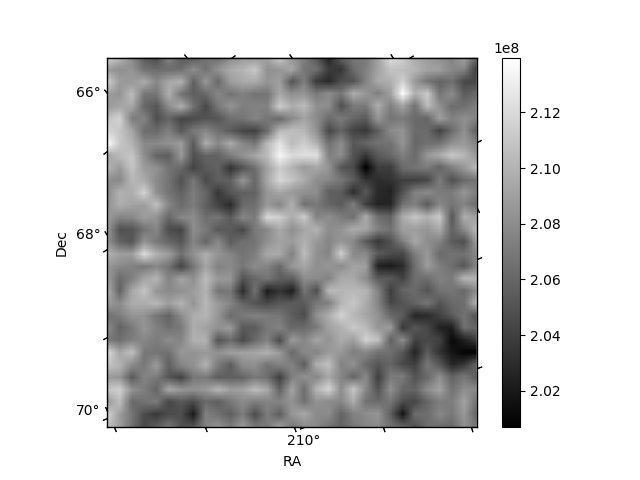
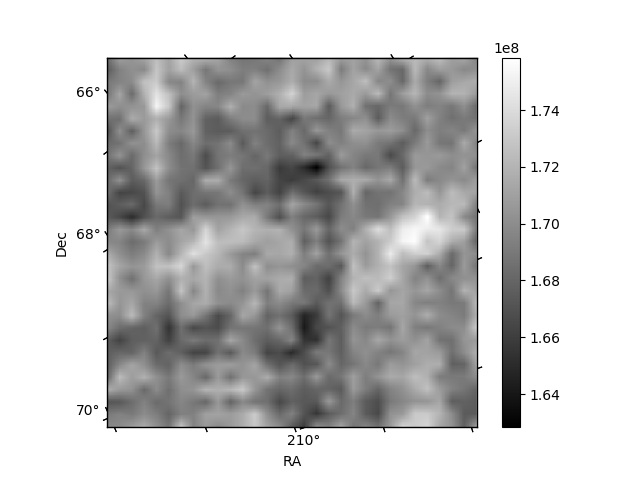
Histogram calculated using DETX and DETY for each event in the final _common_clean file
| Quadrant A | 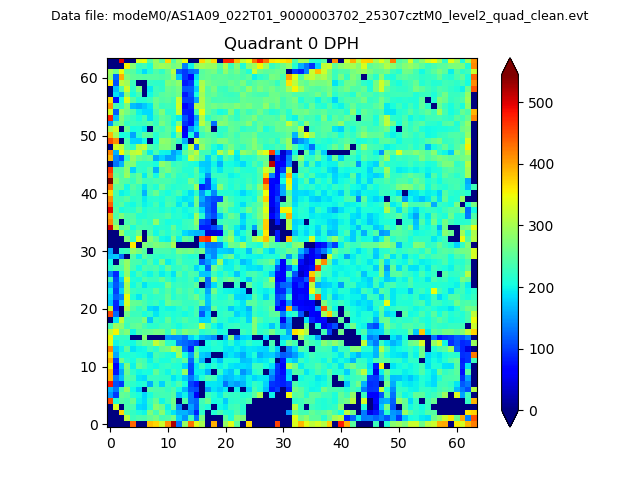 |
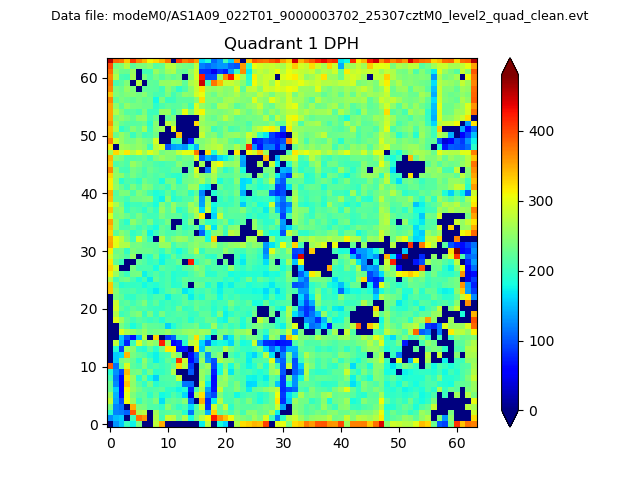 |
Quadrant B |
|---|---|---|---|
| Quadrant D | 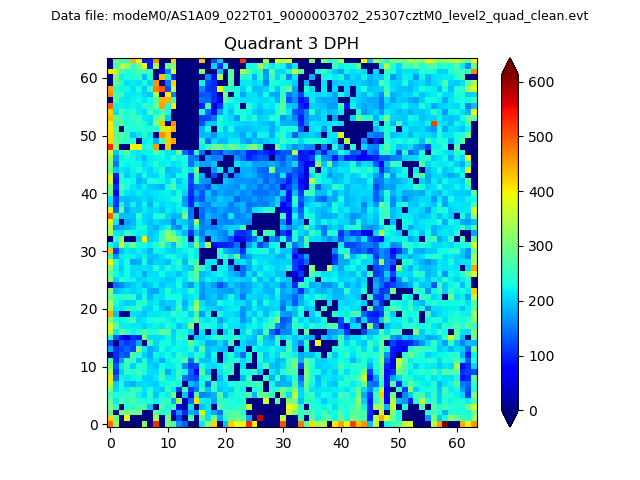 |
 |
Quadrant C |
| Plot type | Count rate plots | Images |
|---|---|---|
| Comparison with Poisson distribution Blue bars denote a histogram of data divided into 1 sec bins. Red curve is a Poisson curve with rate = median count rate of data. |
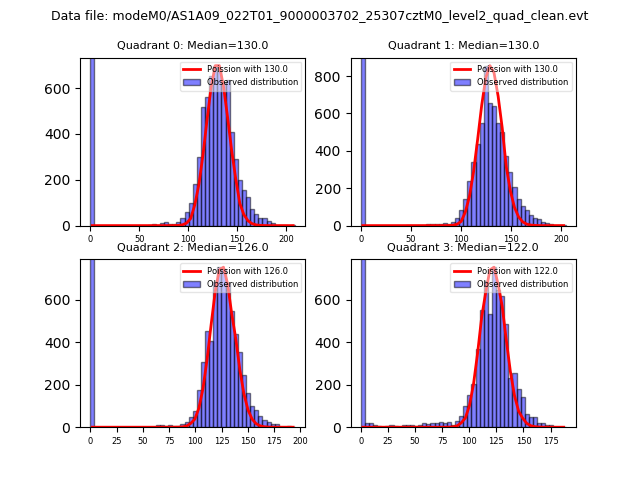 |
 |
| Quadrant-wise count rates Data is divided into 100 sec bins |
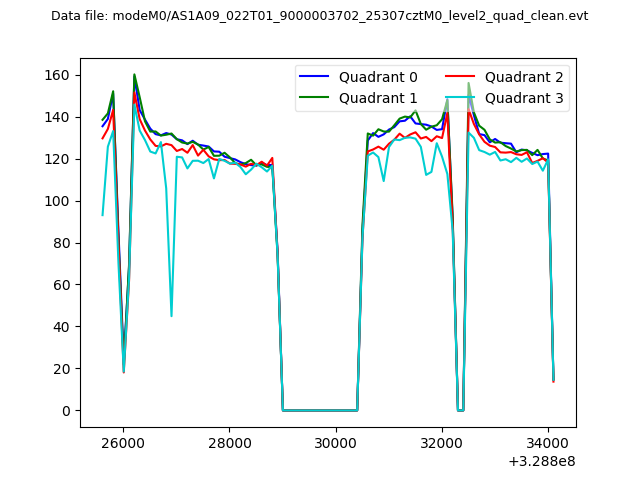 |
|
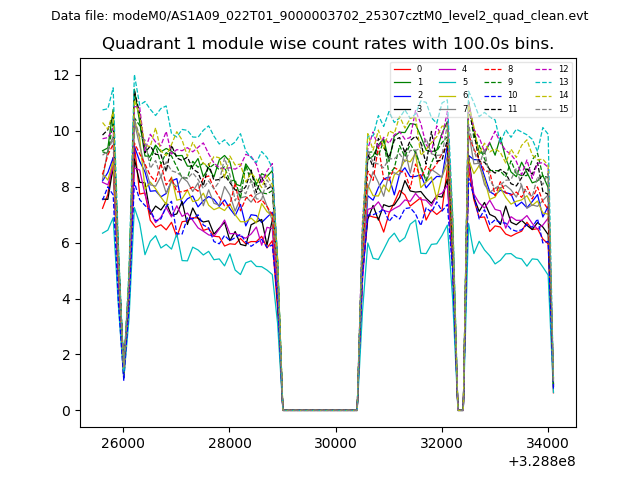
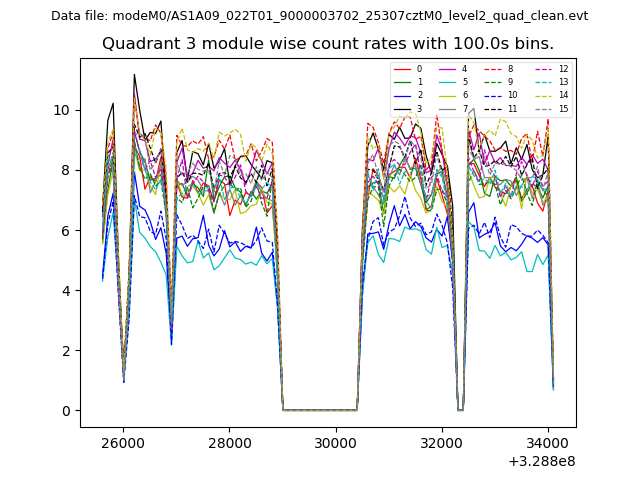
| Module-wise count rates for Quadrant A Data is divided into 100 sec bins |
 |
 |
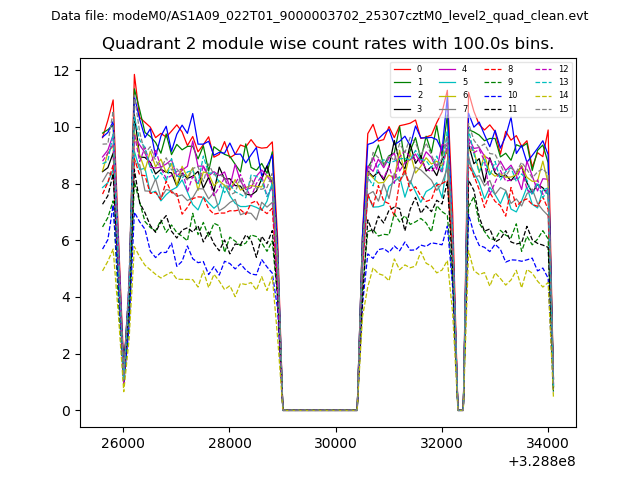
| Module-wise count rates for Quadrant B Data is divided into 100 sec bins |
 |
 |
| Module-wise count rates for Quadrant C Data is divided into 100 sec bins |
 |
 |
| Module-wise count rates for Quadrant D Data is divided into 100 sec bins |
 |
 |
| Parameter | Plot |
|---|---|
| CZT HV Monitor | 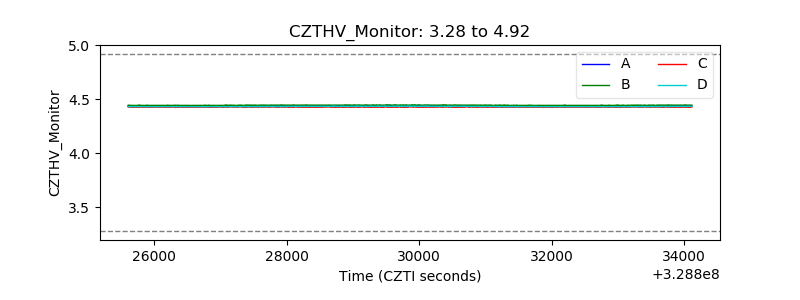 |
| D_VDD | 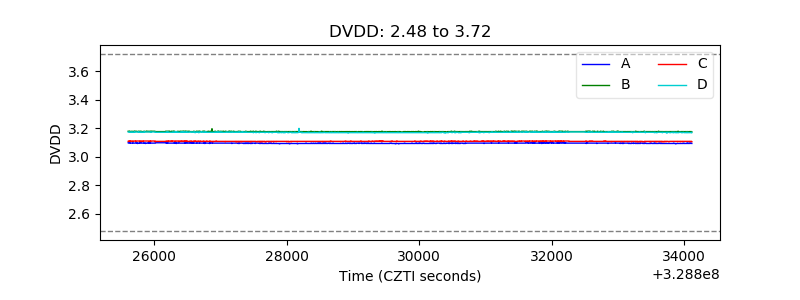 |
| Temperature 1 | 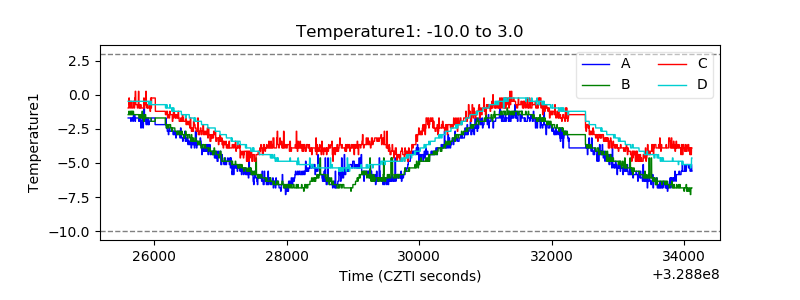 |
| Veto HV Monitor | 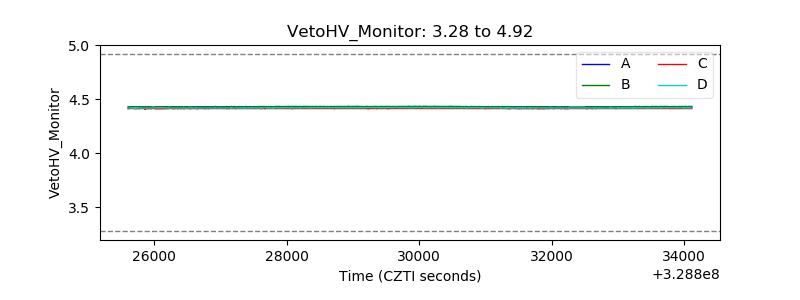 |
| Veto LLD | 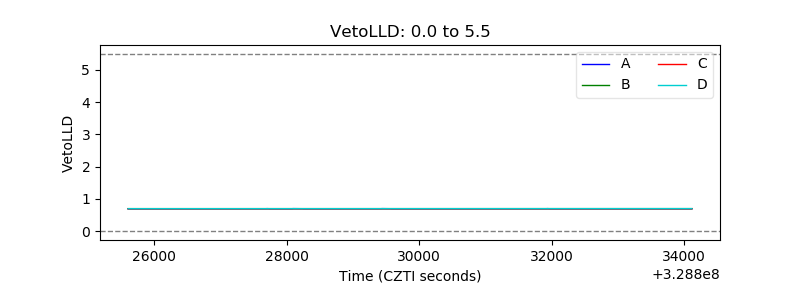 |
| Alpha Counter | 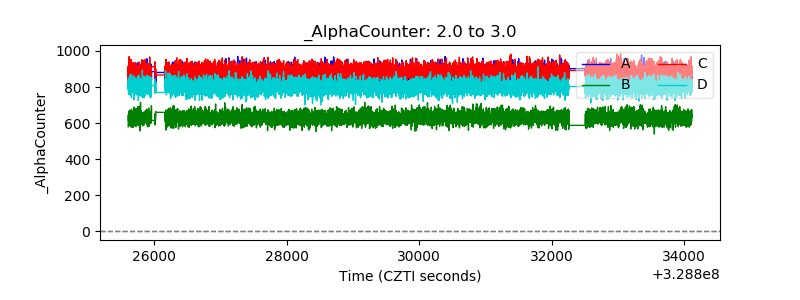 |
| _CPM_Rate | 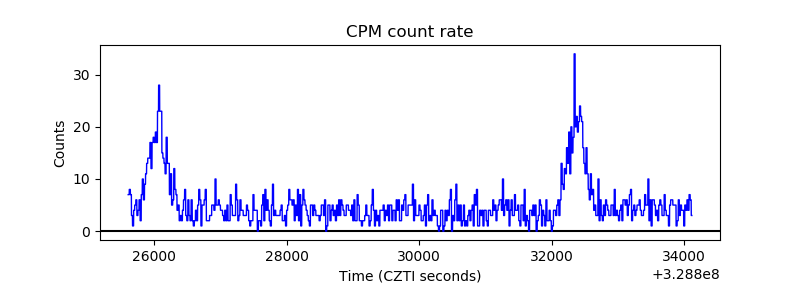 |
| CZT Counter | 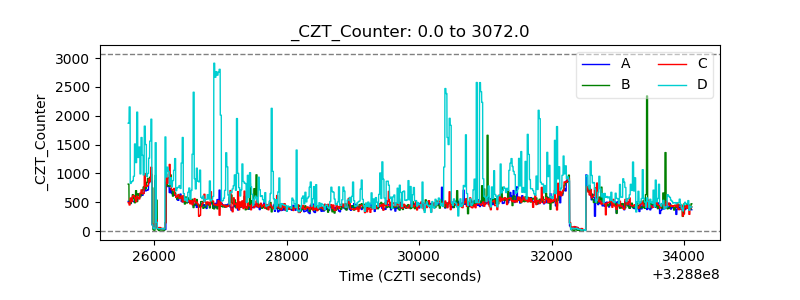 |
| +2.5 Volts monitor |  |
| +5 Volts monitor |  |
| _ROLL_ROT |  |
| _Roll_DEC | 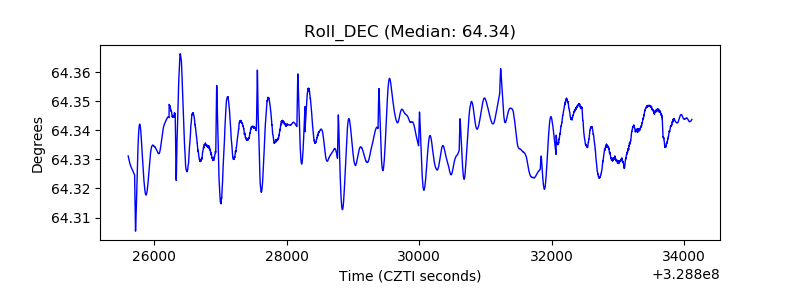 |
| _Roll_RA | 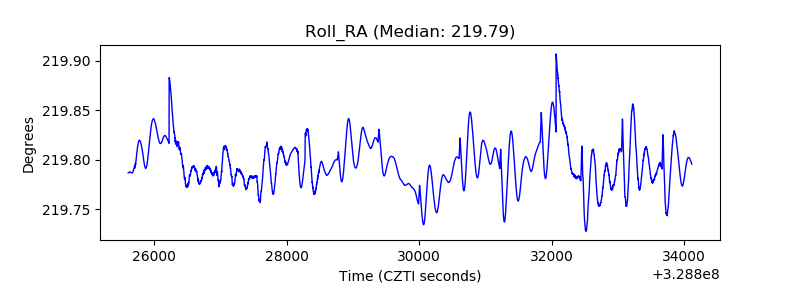 |
| Veto Counter | 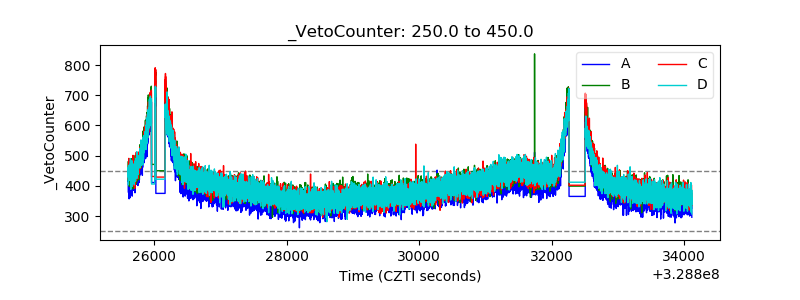 |