| Param | Original file | Final file |
|---|---|---|
| Filename | modeM0/AS1A09_022T01_9000003702_25311cztM0_level2.evt | modeM0/AS1A09_022T01_9000003702_25311cztM0_level2_quad_clean.evt |
| Size (bytes) | 677,105,280 | 76,769,280 |
| Size | 645.7 MB | 73.2 MB |
| Events in quadrant A | 3,176,771 | 551,670 |
| Events in quadrant B | 3,400,233 | 555,948 |
| Events in quadrant C | 3,195,211 | 530,668 |
| Events in quadrant D | 10,272,895 | 211,359 |
| Mode M9 | |||
|---|---|---|---|
| Quadrant | BADHDUFLAG | Total packets | Discarded packets |
| A | 0 | 12 | 0 |
| B | 0 | 13 | 0 |
| C | 0 | 13 | 0 |
| D | 0 | 13 | 0 |
| Mode M0 | |||
|---|---|---|---|
| Quadrant | BADHDUFLAG | Total packets | Discarded packets |
| A | 0 | 13788 | 0 |
| B | 0 | 14367 | 0 |
| C | 0 | 13815 | 0 |
| D | 0 | 35147 | 0 |
| Quadrant | Total seconds | Saturated seconds | Saturation percentage |
|---|---|---|---|
| A | 6801 | 23 | 0.338186% |
| B | 6801 | 46 | 0.676371% |
| C | 6801 | 54 | 0.794001% |
| D | 6801 | 3454 | 50.786649% |
Noise dominated data is calculated using 1-second bins in cleaned event files. If a bin has >2000 counts, and if more than 50% of those come from <1% of pixels, then it is considered to be noise-dominated and hence unusable.
| Quadrant | # 1 sec bins | Bins with >0 counts | Bins with >2000 counts | High rate bins dominated by noise | Noise dominated (total time) | Noise dominated (detector-on time) | Marked lightcurve |
|---|---|---|---|---|---|---|---|
| A | 7766 | 6802 | 0 | 0 | 0.00% | 0.00% | 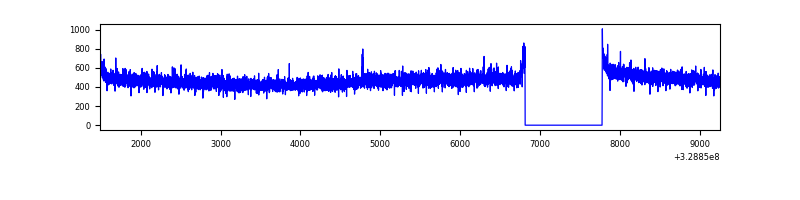 |
| B | 7766 | 6802 | 7 | 7 | 0.09% | 0.10% | 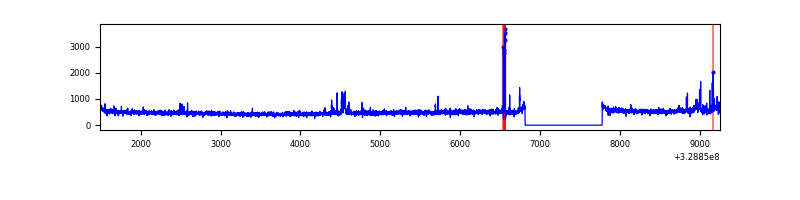 |
| C | 7766 | 6802 | 0 | 0 | 0.00% | 0.00% | 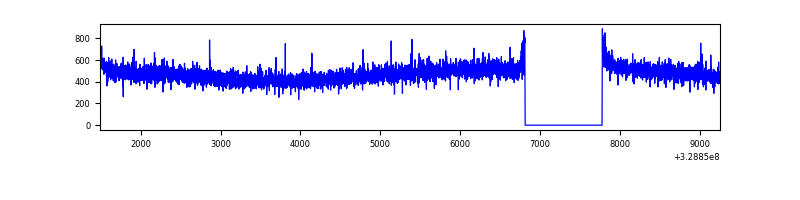 |
| D | 7766 | 6801 | 3181 | 3181 | 40.96% | 46.77% | 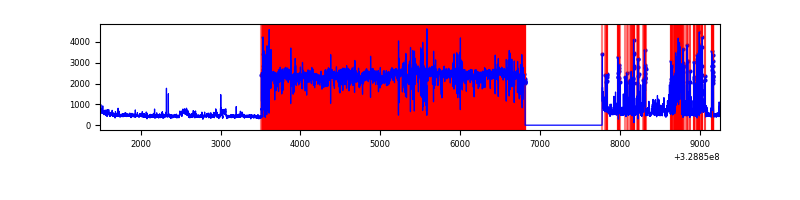 |
Top three noisy pixels from each quadrant. If the there are fewer than three noisy pixels in the level2.evt file, extra rows are filled as -1
| Pixel properties | Quadrant properties | ||||||
|---|---|---|---|---|---|---|---|
| Quadrant | DetID | PixID | Counts | Sigma | Mean | Median | Sigma |
| A | 13 | 254 | 10873 | 61.03 | 822 | 804 | 165.0 |
| A | 3 | 137 | 7441 | 40.23 | 822 | 804 | 165.0 |
| A | 0 | 226 | 7092 | 38.11 | 822 | 804 | 165.0 |
| B | 3 | 64 | 130355 | 833.14 | 817 | 797 | 155.5 |
| B | 0 | 190 | 40769 | 257.04 | 817 | 797 | 155.5 |
| B | 12 | 111 | 19228 | 118.52 | 817 | 797 | 155.5 |
| C | 14 | 238 | 124637 | 670.99 | 785 | 790 | 184.6 |
| C | 3 | 233 | 5849 | 27.41 | 785 | 790 | 184.6 |
| C | 13 | 61 | 5308 | 24.48 | 785 | 790 | 184.6 |
| D | 12 | 235 | 7707447 | 66995.72 | 470 | 456 | 115.0 |
| D | 7 | 38 | 211502 | 1834.59 | 470 | 456 | 115.0 |
| D | 12 | 251 | 182729 | 1584.47 | 470 | 456 | 115.0 |
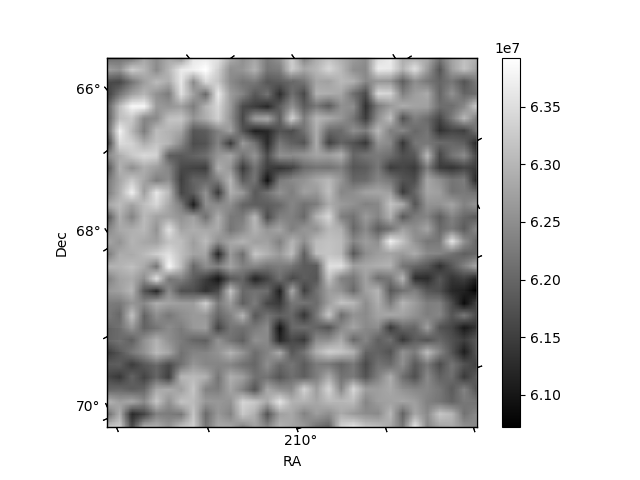
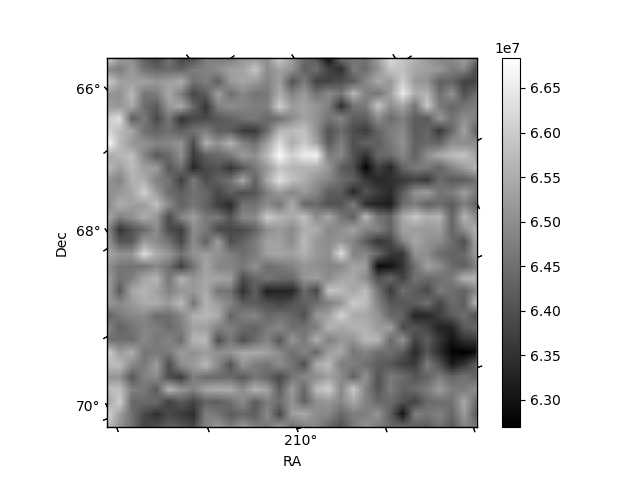
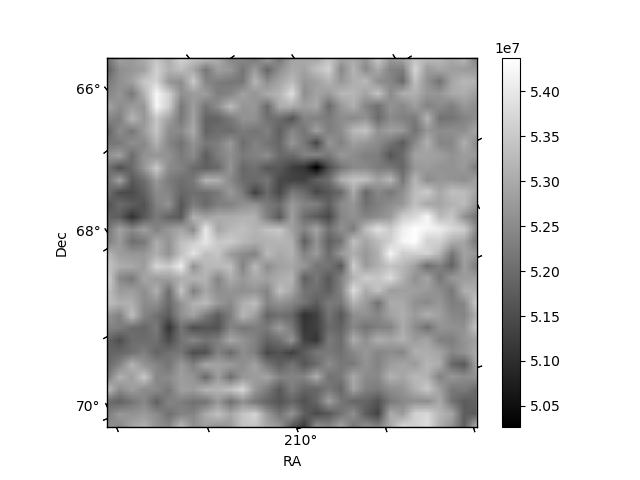
Histogram calculated using DETX and DETY for each event in the final _common_clean file
| Quadrant A | 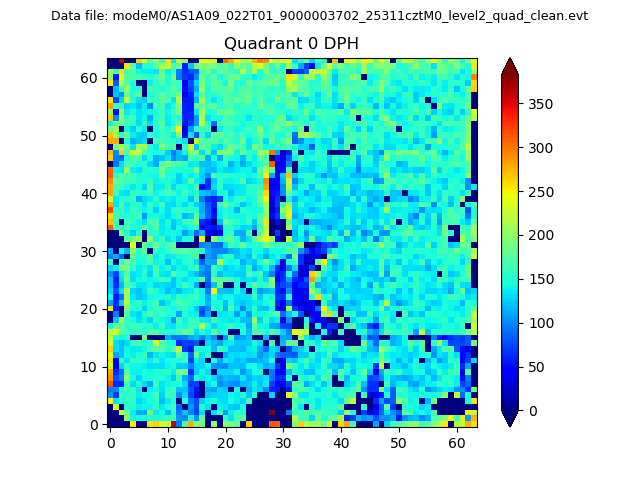 |
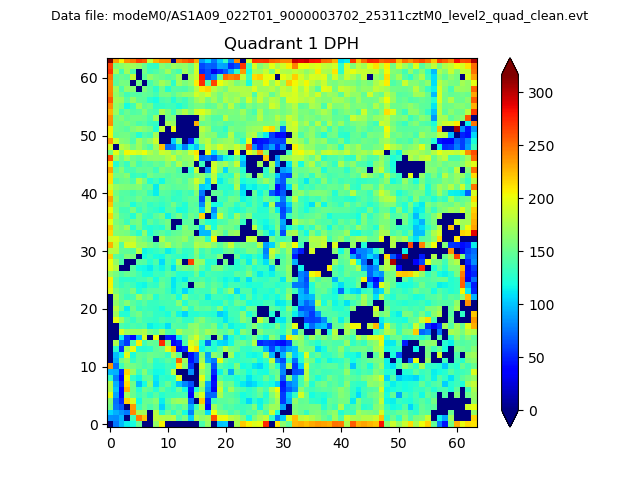 |
Quadrant B |
|---|---|---|---|
| Quadrant D |  |
 |
Quadrant C |
| Plot type | Count rate plots | Images |
|---|---|---|
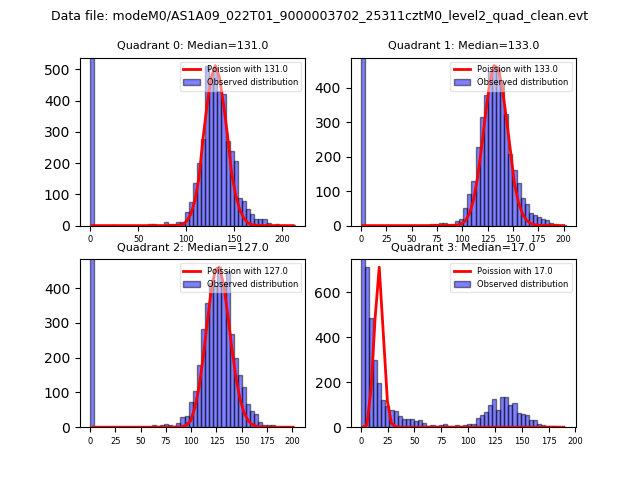
| Comparison with Poisson distribution Blue bars denote a histogram of data divided into 1 sec bins. Red curve is a Poisson curve with rate = median count rate of data. |
 |
 |
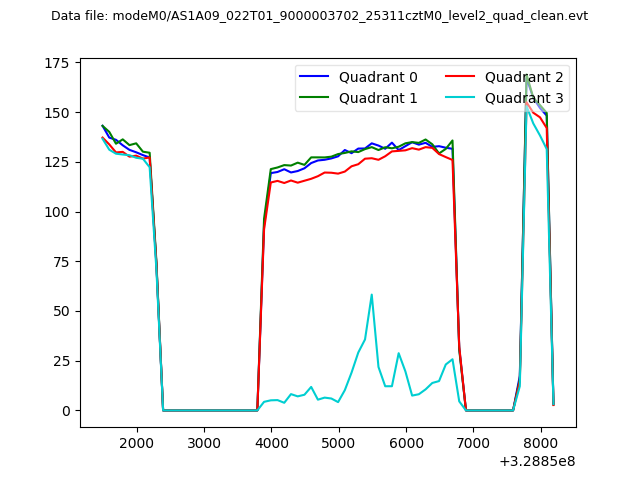
| Quadrant-wise count rates Data is divided into 100 sec bins |
 |
|
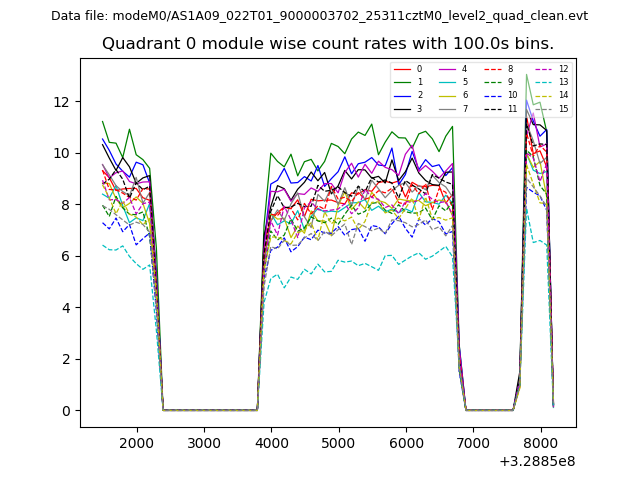
| Module-wise count rates for Quadrant A Data is divided into 100 sec bins |
 |
 |
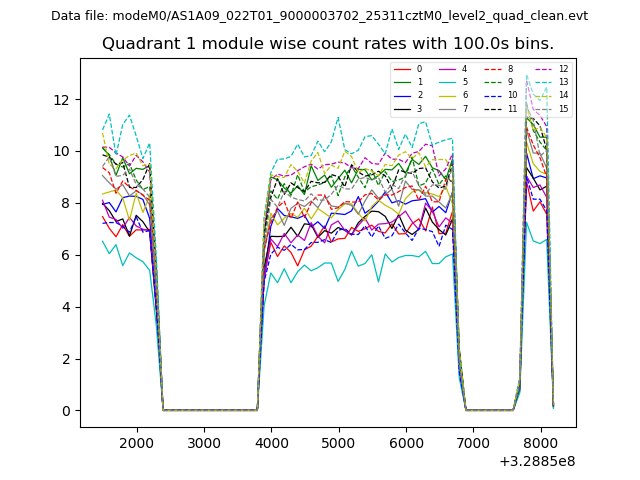
| Module-wise count rates for Quadrant B Data is divided into 100 sec bins |
 |
 |
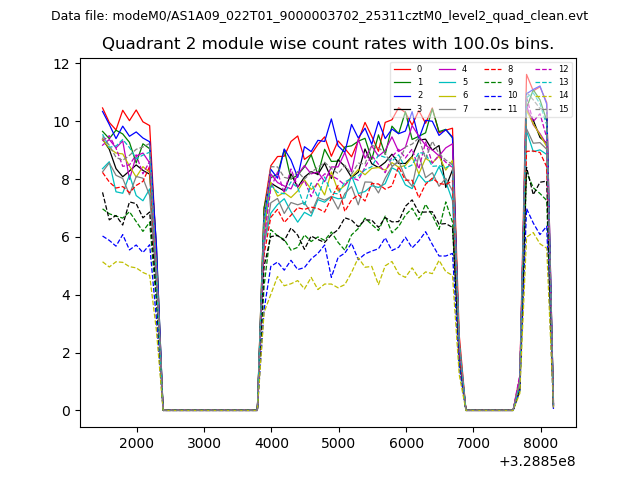
| Module-wise count rates for Quadrant C Data is divided into 100 sec bins |
 |
 |
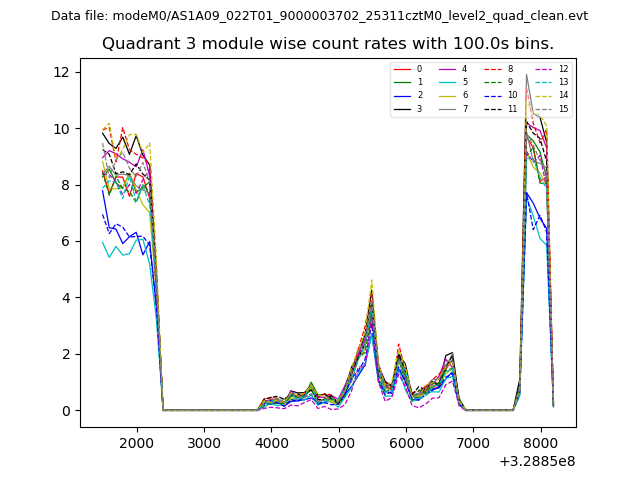
| Module-wise count rates for Quadrant D Data is divided into 100 sec bins |
 |
 |
| Parameter | Plot |
|---|---|
| CZT HV Monitor | 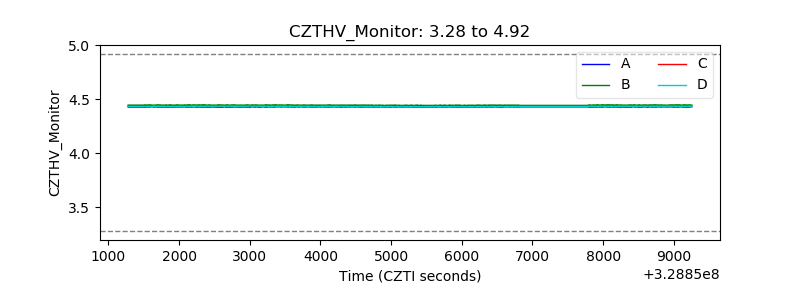 |
| D_VDD | 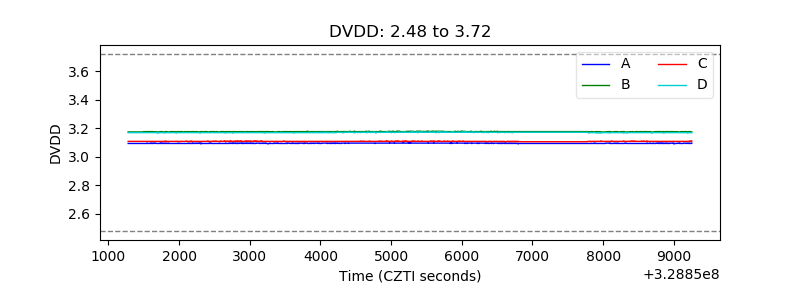 |
| Temperature 1 | 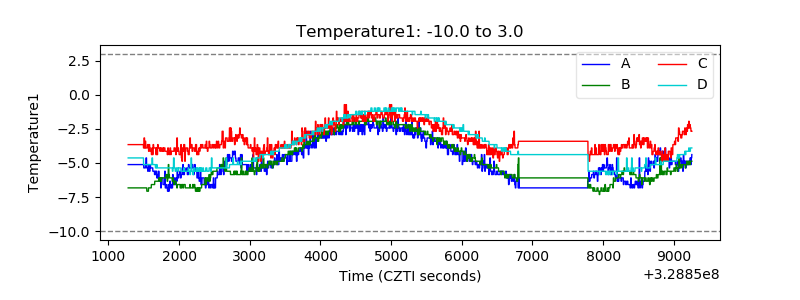 |
| Veto HV Monitor | 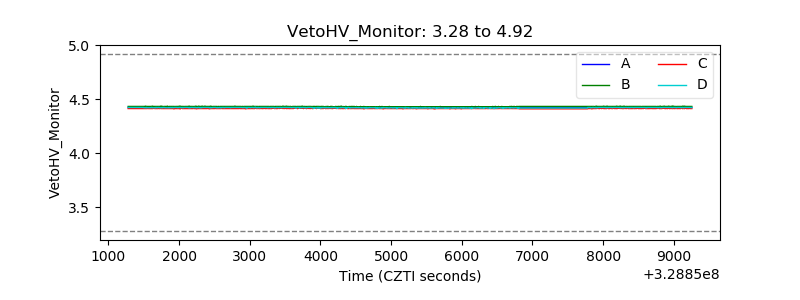 |
| Veto LLD | 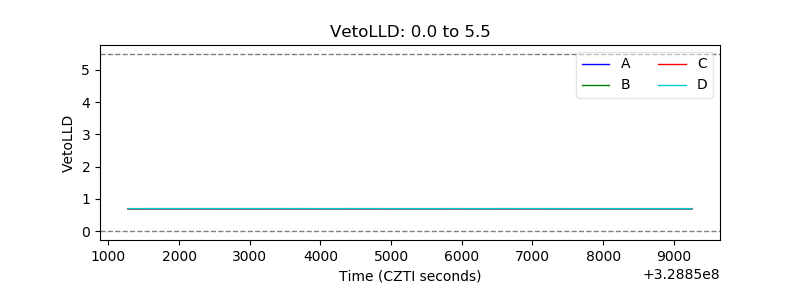 |
| Alpha Counter | 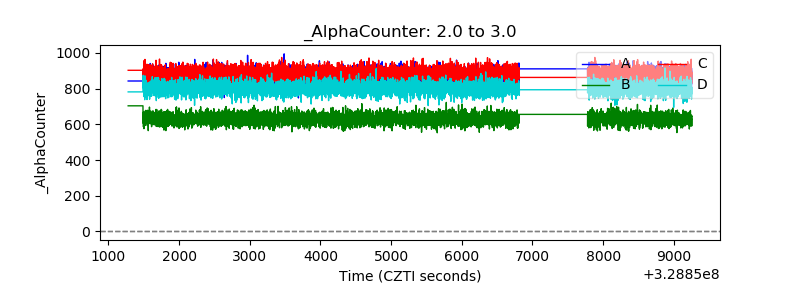 |
| _CPM_Rate | 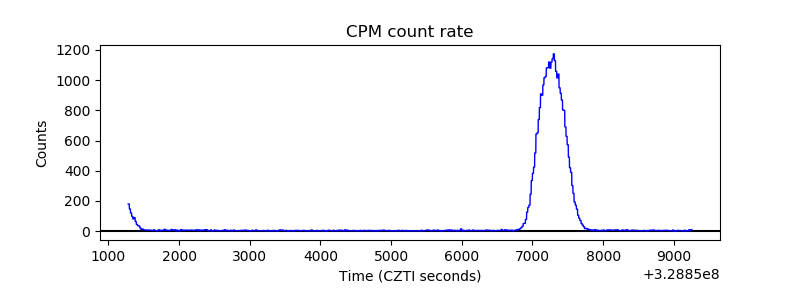 |
| CZT Counter |  |
| +2.5 Volts monitor |  |
| +5 Volts monitor | 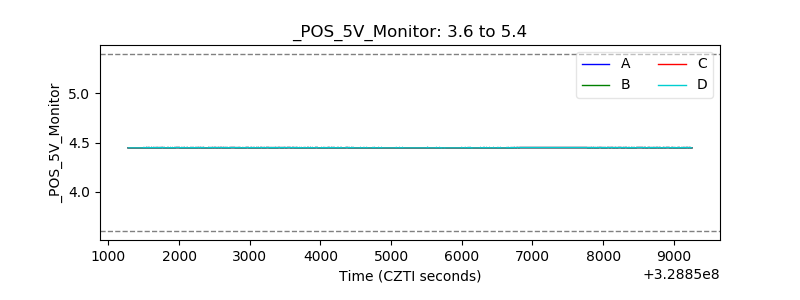 |
| _ROLL_ROT | 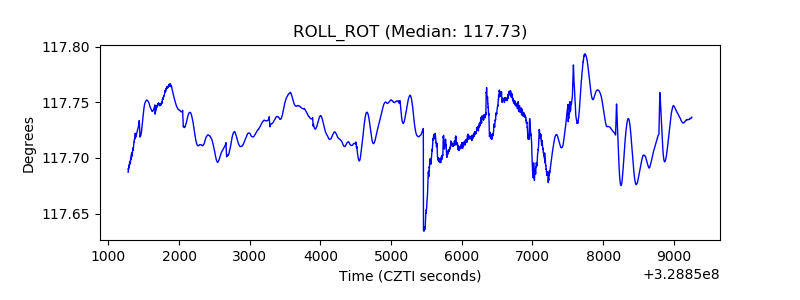 |
| _Roll_DEC | 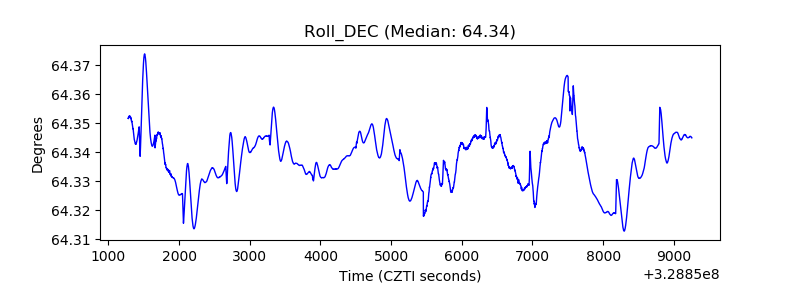 |
| _Roll_RA | 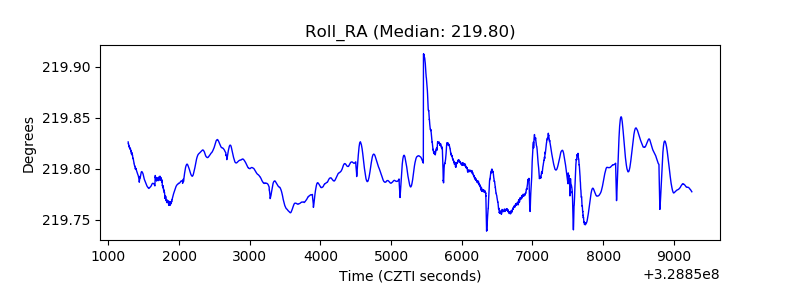 |
| Veto Counter | 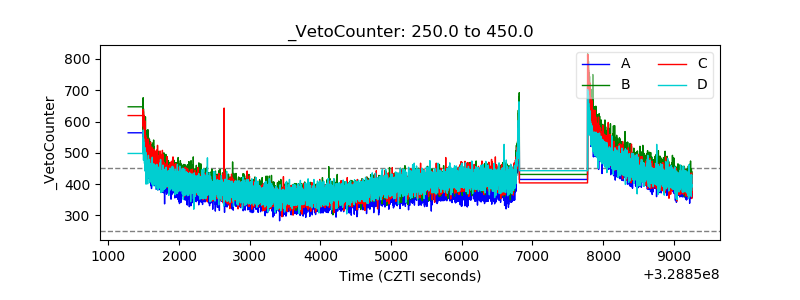 |