| Param | Original file | Final file |
|---|---|---|
| Filename | modeM0/AS1A09_022T01_9000003702_25313cztM0_level2.evt | modeM0/AS1A09_022T01_9000003702_25313cztM0_level2_quad_clean.evt |
| Size (bytes) | 630,103,680 | 71,300,160 |
| Size | 600.9 MB | 68.0 MB |
| Events in quadrant A | 3,148,672 | 486,899 |
| Events in quadrant B | 3,315,654 | 488,795 |
| Events in quadrant C | 3,180,596 | 461,003 |
| Events in quadrant D | 9,003,380 | 274,083 |
| Mode M9 | |||
|---|---|---|---|
| Quadrant | BADHDUFLAG | Total packets | Discarded packets |
| A | 0 | 14 | 0 |
| B | 0 | 15 | 0 |
| C | 0 | 15 | 0 |
| D | 0 | 15 | 0 |
| Mode M0 | |||
|---|---|---|---|
| Quadrant | BADHDUFLAG | Total packets | Discarded packets |
| A | 0 | 13359 | 0 |
| B | 0 | 13835 | 0 |
| C | 0 | 13416 | 0 |
| D | 0 | 31098 | 0 |
| Quadrant | Total seconds | Saturated seconds | Saturation percentage |
|---|---|---|---|
| A | 6409 | 50 | 0.780153% |
| B | 6409 | 56 | 0.873771% |
| C | 6409 | 86 | 1.341863% |
| D | 6409 | 2475 | 38.617569% |
Noise dominated data is calculated using 1-second bins in cleaned event files. If a bin has >2000 counts, and if more than 50% of those come from <1% of pixels, then it is considered to be noise-dominated and hence unusable.
| Quadrant | # 1 sec bins | Bins with >0 counts | Bins with >2000 counts | High rate bins dominated by noise | Noise dominated (total time) | Noise dominated (detector-on time) | Marked lightcurve |
|---|---|---|---|---|---|---|---|
| A | 7509 | 6410 | 0 | 0 | 0.00% | 0.00% | 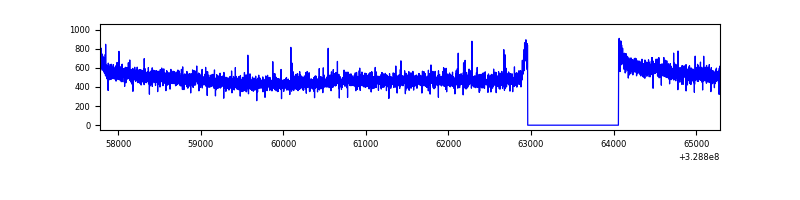 |
| B | 7509 | 6409 | 1 | 1 | 0.01% | 0.02% | 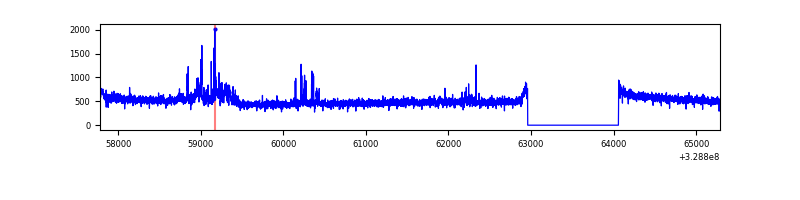 |
| C | 7509 | 6410 | 6 | 6 | 0.08% | 0.09% | 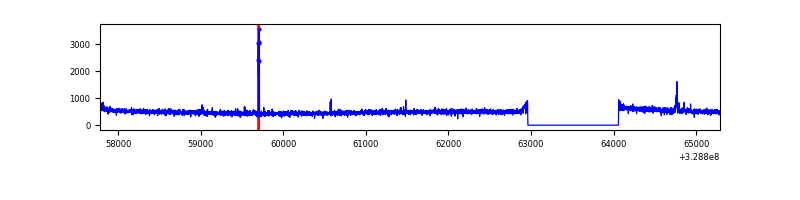 |
| D | 7509 | 6410 | 1972 | 1972 | 26.26% | 30.76% | 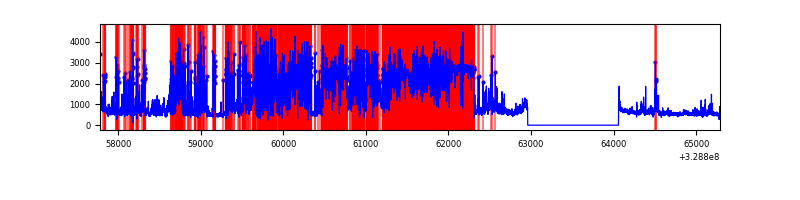 |
Top three noisy pixels from each quadrant. If the there are fewer than three noisy pixels in the level2.evt file, extra rows are filled as -1
| Pixel properties | Quadrant properties | ||||||
|---|---|---|---|---|---|---|---|
| Quadrant | DetID | PixID | Counts | Sigma | Mean | Median | Sigma |
| A | 13 | 254 | 10388 | 58.86 | 816 | 799 | 162.9 |
| A | 3 | 137 | 7201 | 39.3 | 816 | 799 | 162.9 |
| A | 0 | 226 | 7058 | 38.42 | 816 | 799 | 162.9 |
| B | 3 | 64 | 120133 | 786.52 | 803 | 784 | 151.7 |
| B | 0 | 190 | 33590 | 216.19 | 803 | 784 | 151.7 |
| B | 12 | 111 | 18395 | 116.06 | 803 | 784 | 151.7 |
| C | 14 | 238 | 123906 | 692.09 | 766 | 771 | 177.9 |
| C | 3 | 233 | 28132 | 153.78 | 766 | 771 | 177.9 |
| C | 9 | 16 | 22939 | 124.6 | 766 | 771 | 177.9 |
| D | 12 | 235 | 4270965 | 29273.27 | 609 | 592 | 145.9 |
| D | 7 | 238 | 938898 | 6432.06 | 609 | 592 | 145.9 |
| D | 1 | 52 | 746961 | 5116.34 | 609 | 592 | 145.9 |
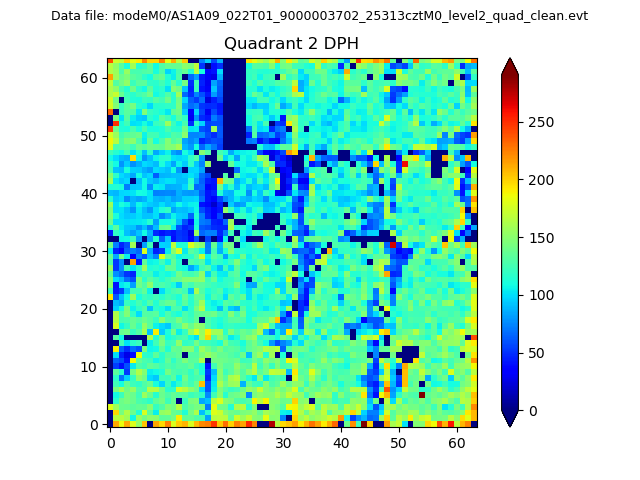
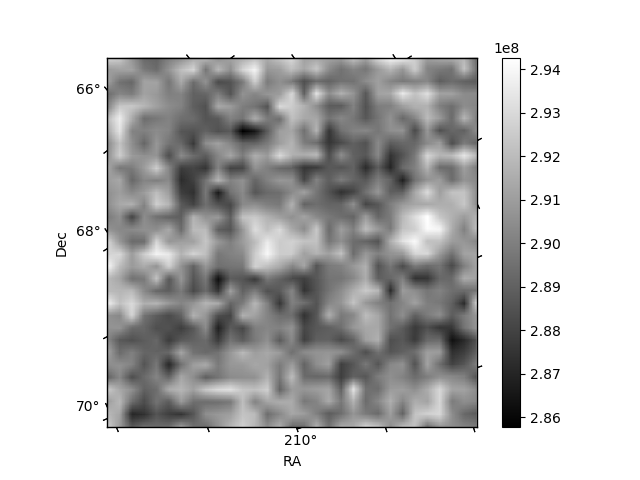
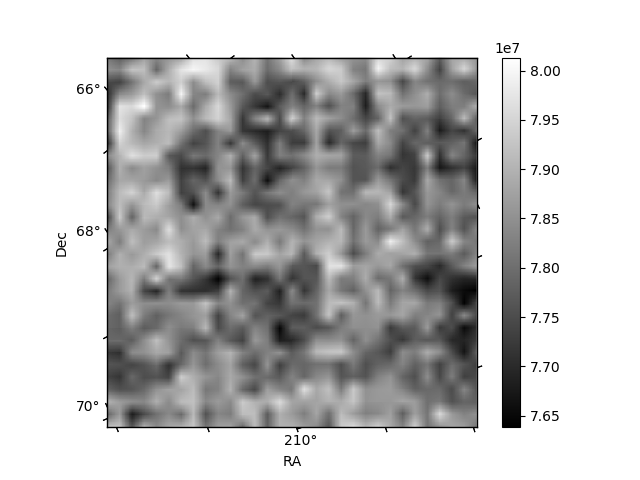
Histogram calculated using DETX and DETY for each event in the final _common_clean file
| Quadrant A | 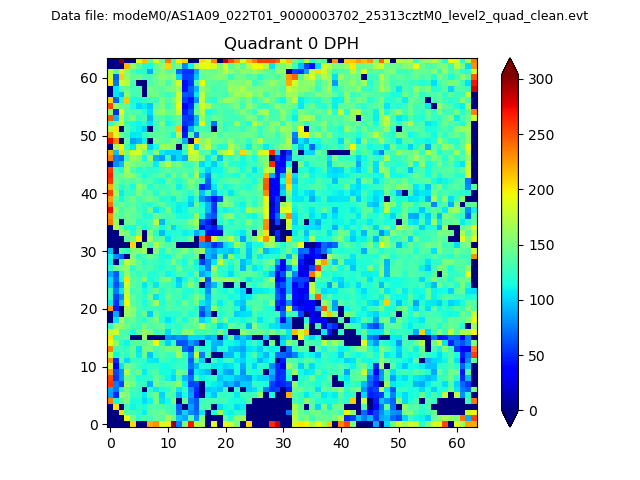 |
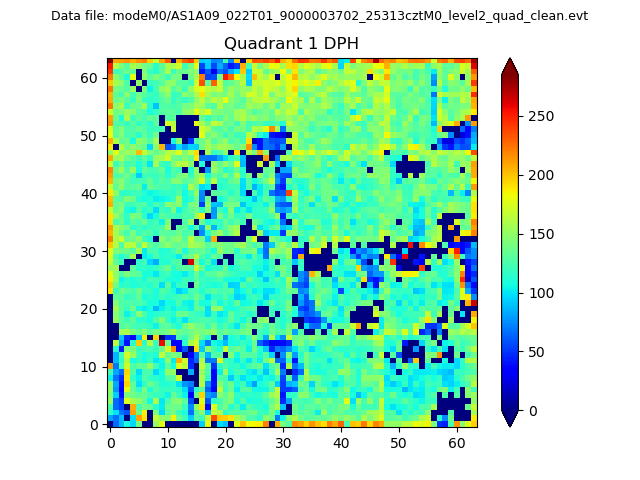 |
Quadrant B |
|---|---|---|---|
| Quadrant D | 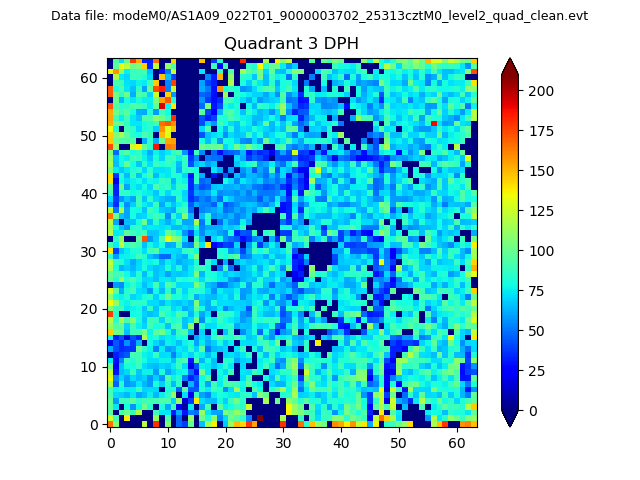 |
 |
Quadrant C |
| Plot type | Count rate plots | Images |
|---|---|---|
| Comparison with Poisson distribution Blue bars denote a histogram of data divided into 1 sec bins. Red curve is a Poisson curve with rate = median count rate of data. |
 |
 |
| Quadrant-wise count rates Data is divided into 100 sec bins |
 |
|
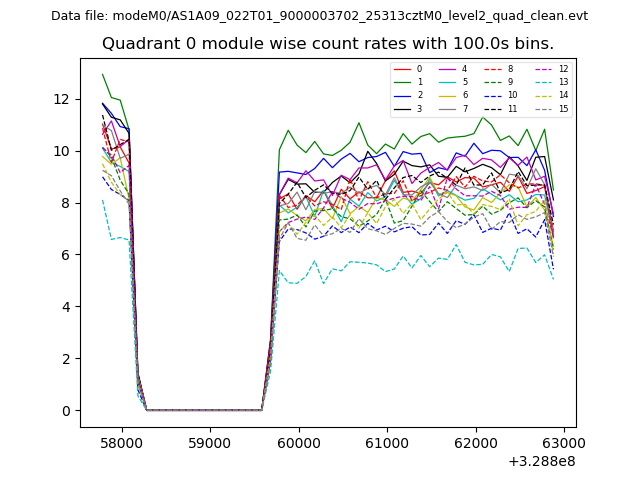
| Module-wise count rates for Quadrant A Data is divided into 100 sec bins |
 |
 |
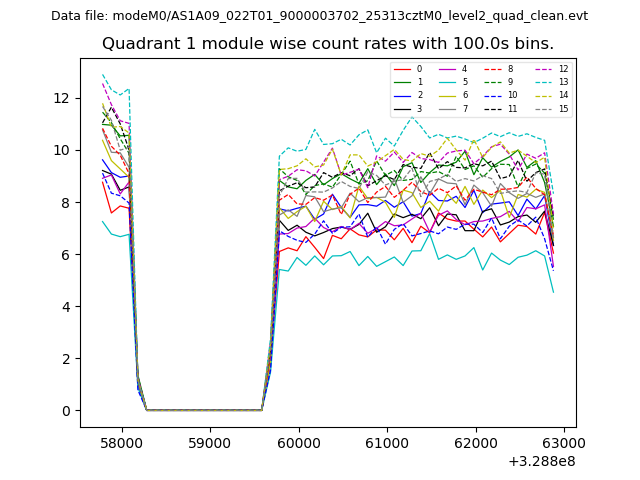
| Module-wise count rates for Quadrant B Data is divided into 100 sec bins |
 |
 |
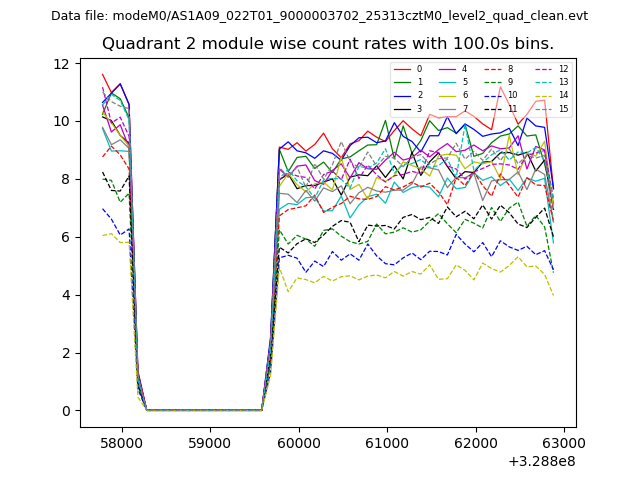
| Module-wise count rates for Quadrant C Data is divided into 100 sec bins |
 |
 |
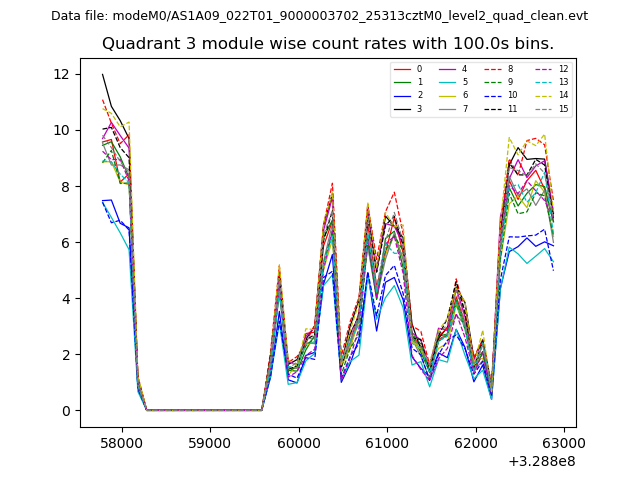
| Module-wise count rates for Quadrant D Data is divided into 100 sec bins |
 |
 |
| Parameter | Plot |
|---|---|
| CZT HV Monitor | 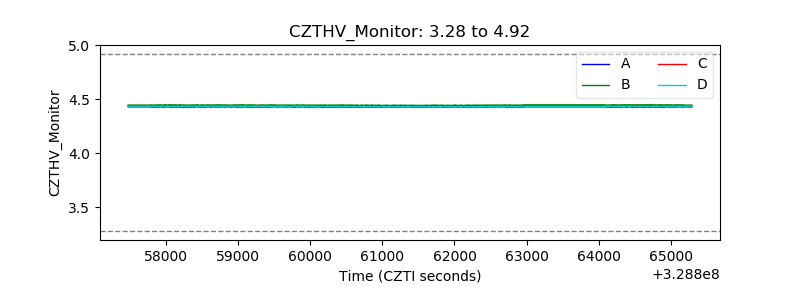 |
| D_VDD | 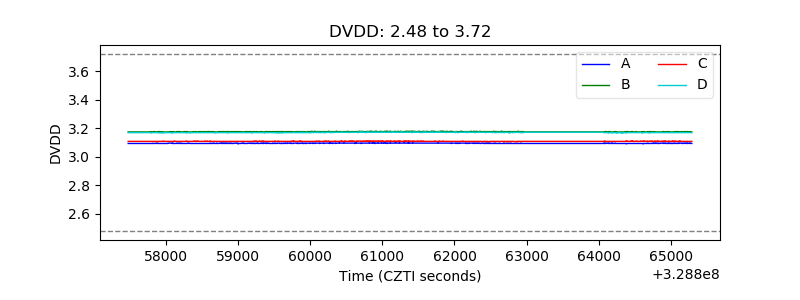 |
| Temperature 1 |  |
| Veto HV Monitor | 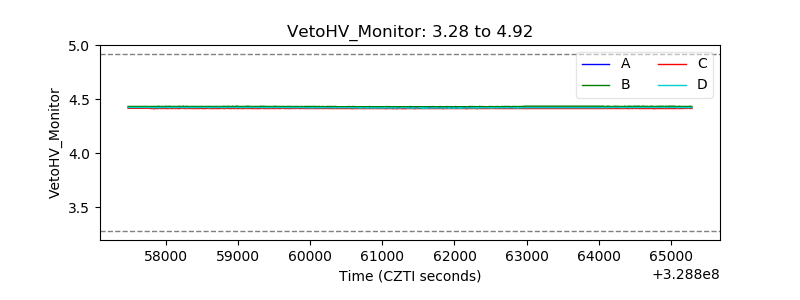 |
| Veto LLD | 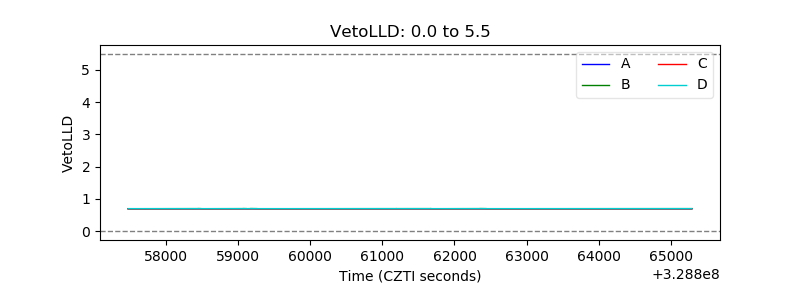 |
| Alpha Counter | 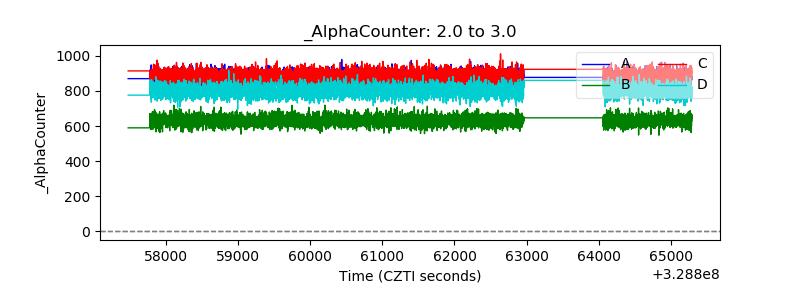 |
| _CPM_Rate |  |
| CZT Counter | 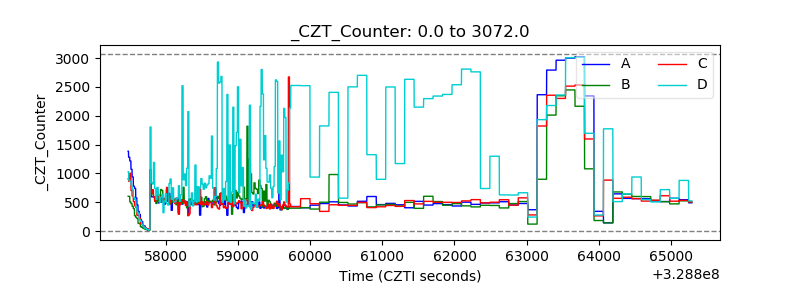 |
| +2.5 Volts monitor | 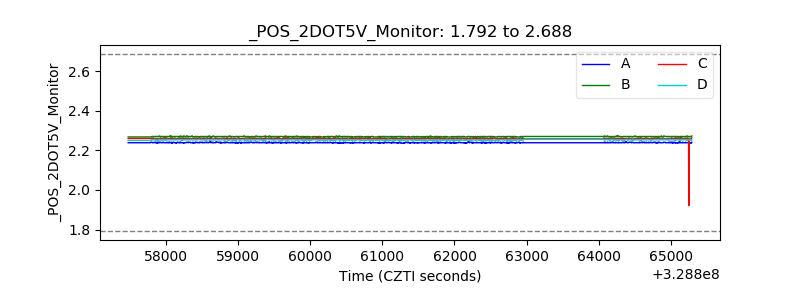 |
| +5 Volts monitor | 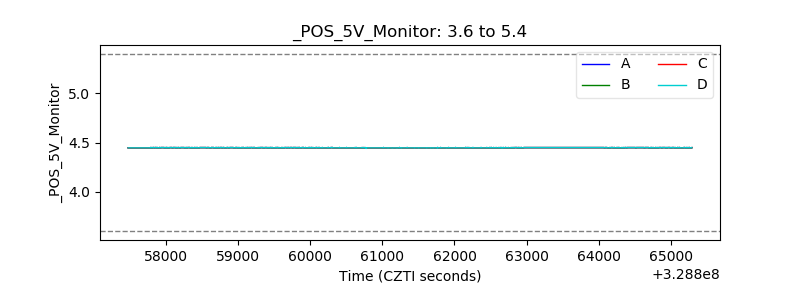 |
| _ROLL_ROT | 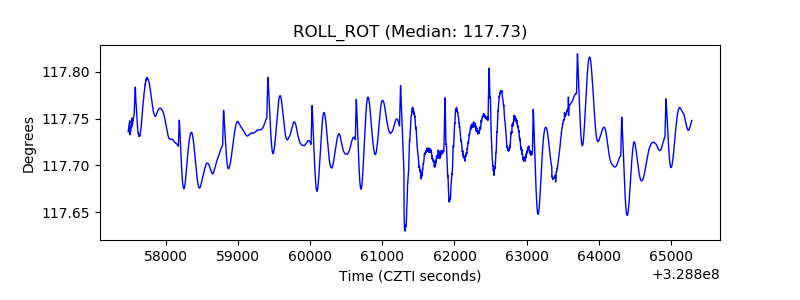 |
| _Roll_DEC |  |
| _Roll_RA | 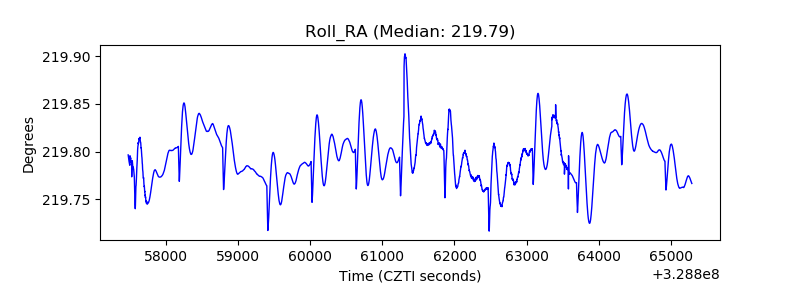 |
| Veto Counter | 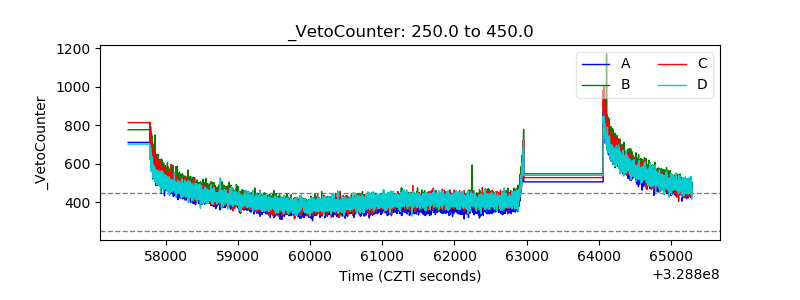 |