| Param | Original file | Final file |
|---|---|---|
| Filename | modeM0/AS1A09_022T01_9000003702_25314cztM0_level2.evt | modeM0/AS1A09_022T01_9000003702_25314cztM0_level2_quad_clean.evt |
| Size (bytes) | 379,517,760 | 54,789,120 |
| Size | 361.9 MB | 52.3 MB |
| Events in quadrant A | 2,562,413 | 358,620 |
| Events in quadrant B | 2,102,234 | 363,512 |
| Events in quadrant C | 2,111,837 | 339,922 |
| Events in quadrant D | 4,434,473 | 303,468 |
| Mode M9 | |||
|---|---|---|---|
| Quadrant | BADHDUFLAG | Total packets | Discarded packets |
| A | 0 | 3 | 0 |
| B | 0 | 4 | 0 |
| C | 0 | 4 | 0 |
| D | 0 | 4 | 0 |
| Mode M0 | |||
|---|---|---|---|
| Quadrant | BADHDUFLAG | Total packets | Discarded packets |
| A | 0 | 10275 | 0 |
| B | 0 | 8788 | 0 |
| C | 0 | 8772 | 0 |
| D | 0 | 15933 | 0 |
| Quadrant | Total seconds | Saturated seconds | Saturation percentage |
|---|---|---|---|
| A | 4156 | 13 | 0.312801% |
| B | 4156 | 14 | 0.336862% |
| C | 4156 | 29 | 0.697786% |
| D | 4156 | 495 | 11.910491% |
Noise dominated data is calculated using 1-second bins in cleaned event files. If a bin has >2000 counts, and if more than 50% of those come from <1% of pixels, then it is considered to be noise-dominated and hence unusable.
| Quadrant | # 1 sec bins | Bins with >0 counts | Bins with >2000 counts | High rate bins dominated by noise | Noise dominated (total time) | Noise dominated (detector-on time) | Marked lightcurve |
|---|---|---|---|---|---|---|---|
| A | 4156 | 4156 | 0 | 0 | 0.00% | 0.00% | 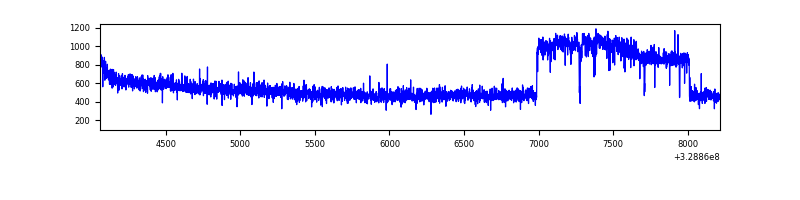 |
| B | 4156 | 4156 | 0 | 0 | 0.00% | 0.00% | 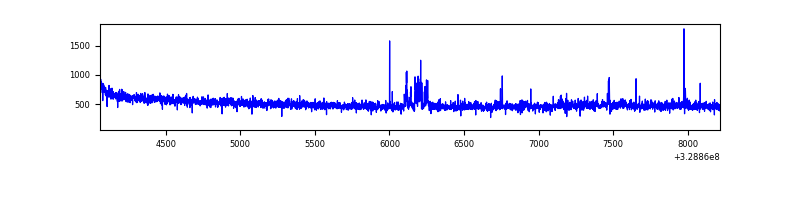 |
| C | 4156 | 4156 | 1 | 1 | 0.02% | 0.02% | 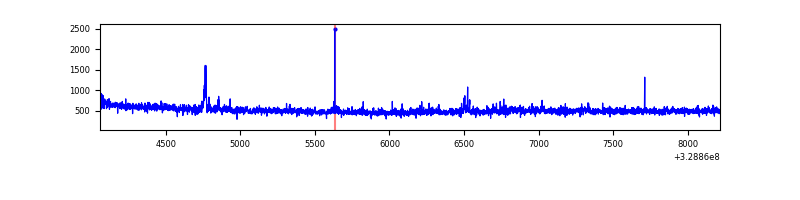 |
| D | 4156 | 4156 | 457 | 457 | 11.00% | 11.00% | 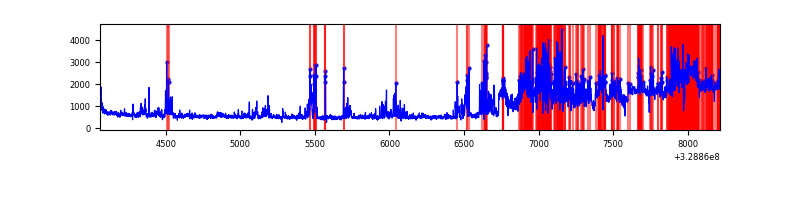 |
Top three noisy pixels from each quadrant. If the there are fewer than three noisy pixels in the level2.evt file, extra rows are filled as -1
| Pixel properties | Quadrant properties | ||||||
|---|---|---|---|---|---|---|---|
| Quadrant | DetID | PixID | Counts | Sigma | Mean | Median | Sigma |
| A | 15 | 173 | 494970 | 4659.35 | 536 | 528 | 106.1 |
| A | 13 | 254 | 6594 | 57.16 | 536 | 528 | 106.1 |
| A | 0 | 226 | 4627 | 38.63 | 536 | 528 | 106.1 |
| B | 0 | 190 | 34070 | 339.57 | 525 | 514 | 98.8 |
| B | 12 | 111 | 11382 | 109.98 | 525 | 514 | 98.8 |
| B | 11 | 111 | 10254 | 98.56 | 525 | 514 | 98.8 |
| C | 14 | 238 | 82918 | 709.61 | 501 | 504 | 116.1 |
| C | 3 | 233 | 53541 | 456.67 | 501 | 504 | 116.1 |
| C | 9 | 54 | 18450 | 154.52 | 501 | 504 | 116.1 |
| D | 1 | 52 | 1931913 | 16029.6 | 495 | 481 | 120.5 |
| D | 12 | 235 | 241895 | 2003.58 | 495 | 481 | 120.5 |
| D | 12 | 233 | 157901 | 1306.48 | 495 | 481 | 120.5 |
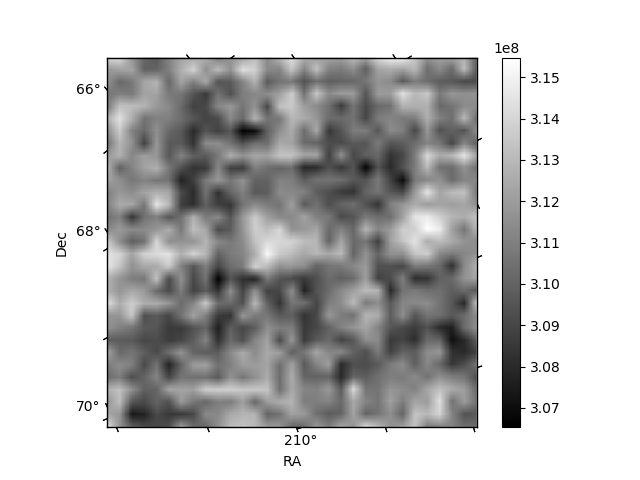
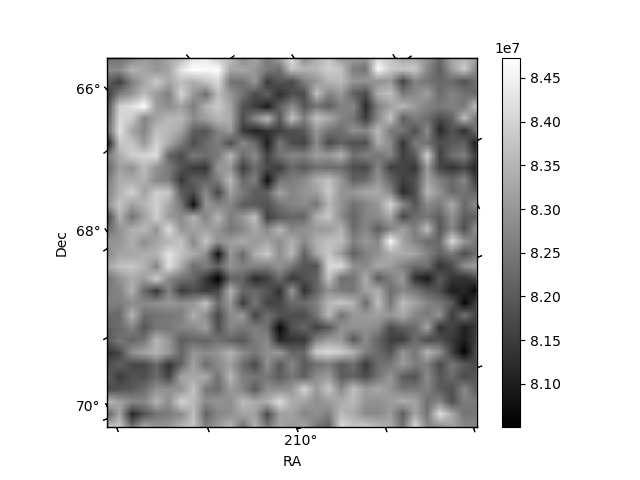
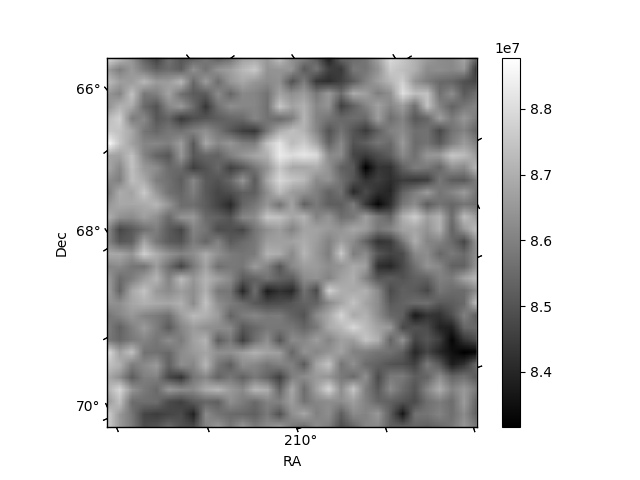
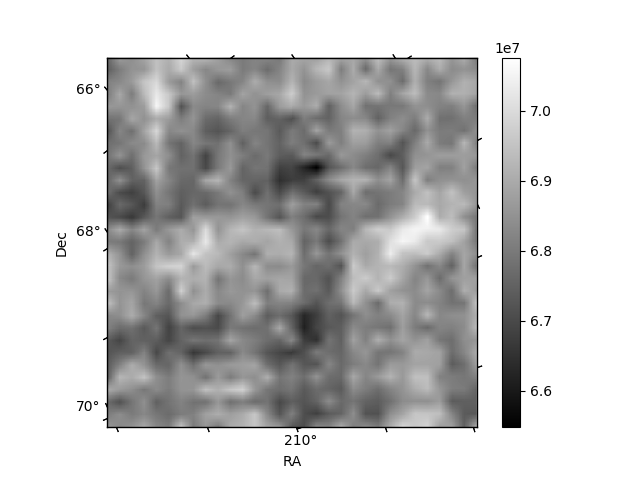
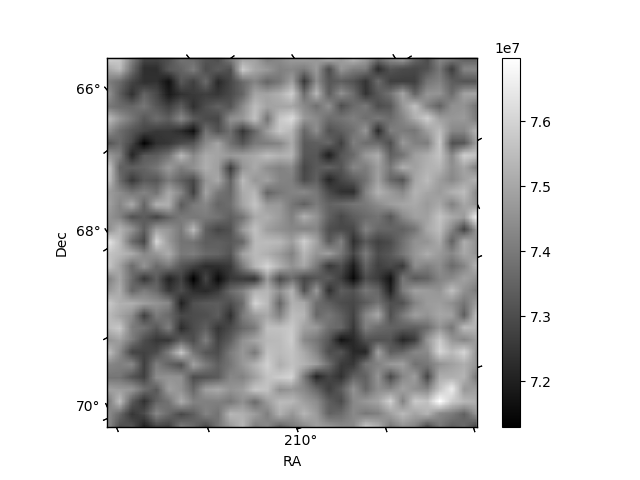
Histogram calculated using DETX and DETY for each event in the final _common_clean file
| Quadrant A |  |
 |
Quadrant B |
|---|---|---|---|
| Quadrant D |  |
 |
Quadrant C |
| Plot type | Count rate plots | Images |
|---|---|---|
| Comparison with Poisson distribution Blue bars denote a histogram of data divided into 1 sec bins. Red curve is a Poisson curve with rate = median count rate of data. |
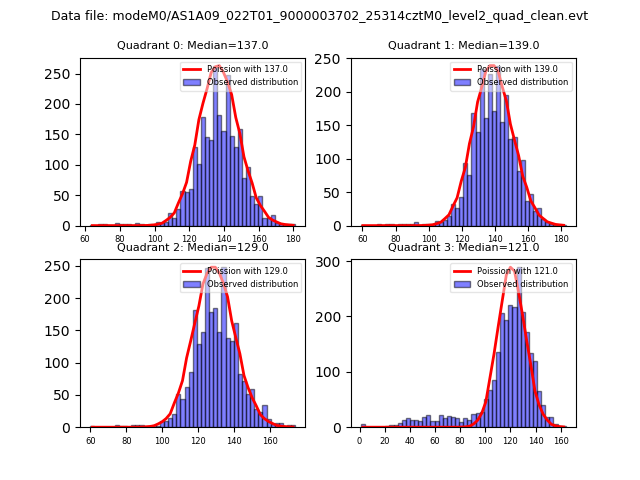 |
 |
| Quadrant-wise count rates Data is divided into 100 sec bins |
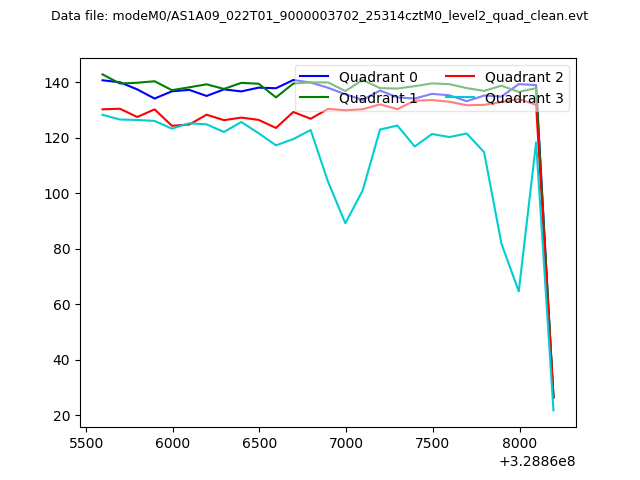 |
|
| Module-wise count rates for Quadrant A Data is divided into 100 sec bins |
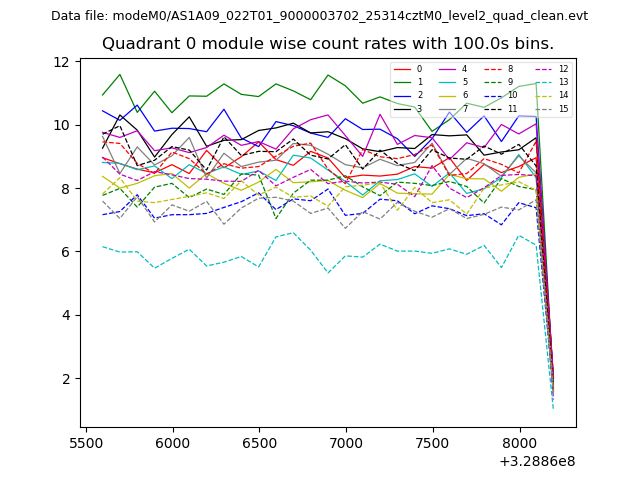 |
 |
| Module-wise count rates for Quadrant B Data is divided into 100 sec bins |
 |
 |
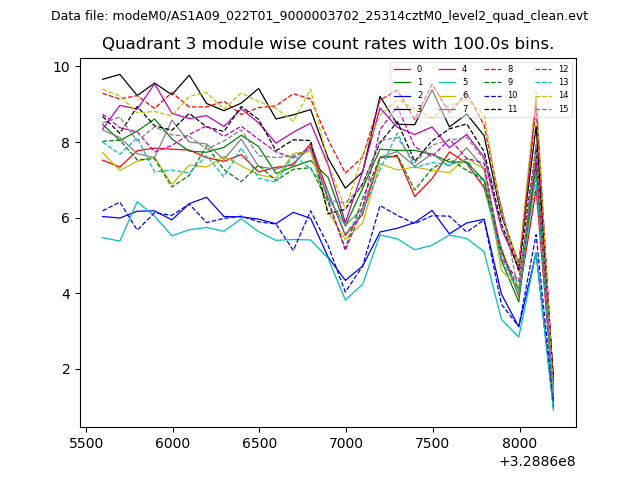
| Module-wise count rates for Quadrant C Data is divided into 100 sec bins |
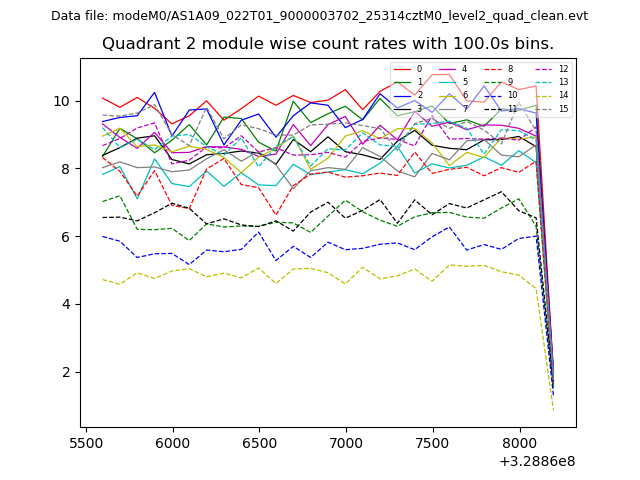 |
 |
| Module-wise count rates for Quadrant D Data is divided into 100 sec bins |
 |
 |
| Parameter | Plot |
|---|---|
| CZT HV Monitor |  |
| D_VDD | 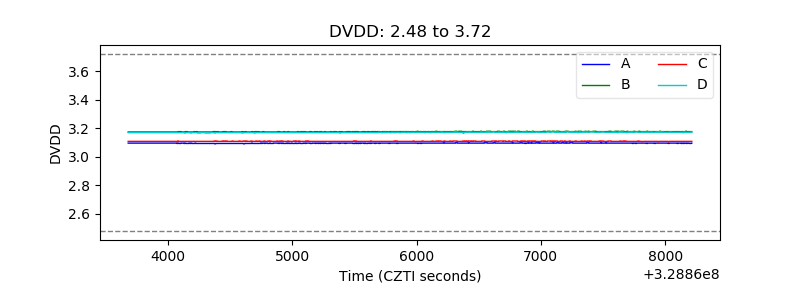 |
| Temperature 1 | 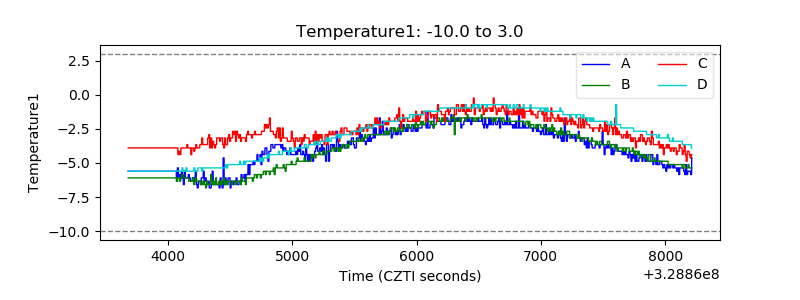 |
| Veto HV Monitor | 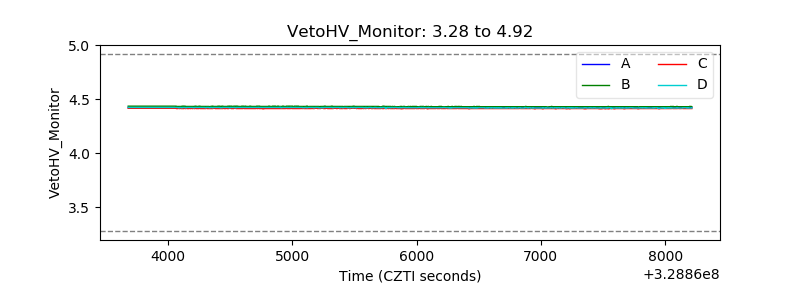 |
| Veto LLD | 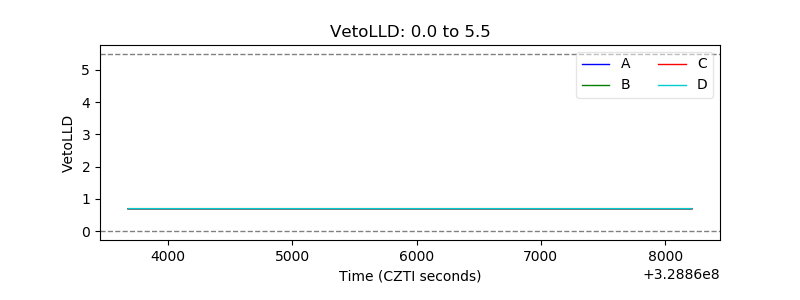 |
| Alpha Counter |  |
| _CPM_Rate | 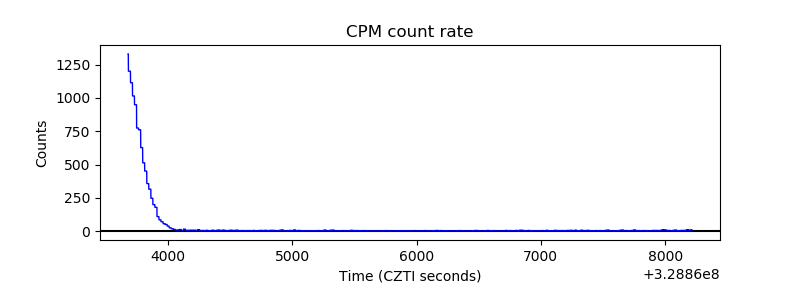 |
| CZT Counter | 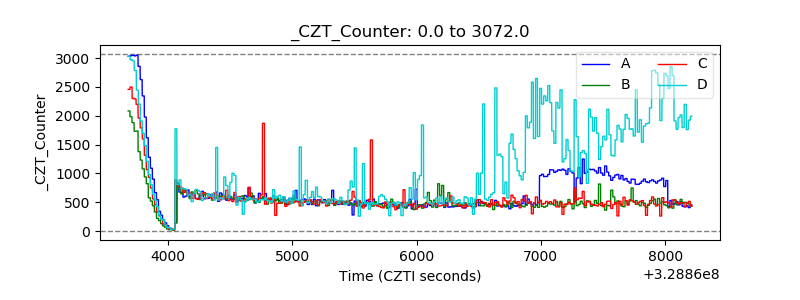 |
| +2.5 Volts monitor |  |
| +5 Volts monitor |  |
| _ROLL_ROT | 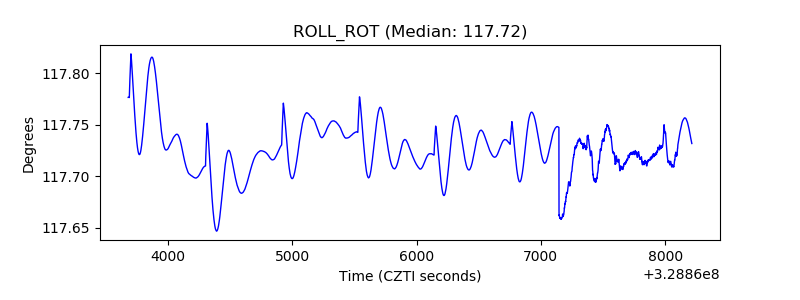 |
| _Roll_DEC | 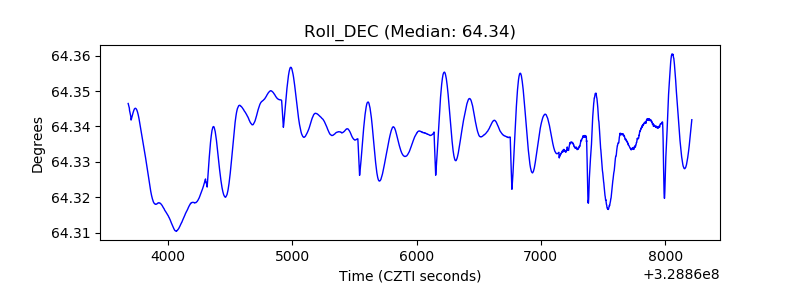 |
| _Roll_RA | 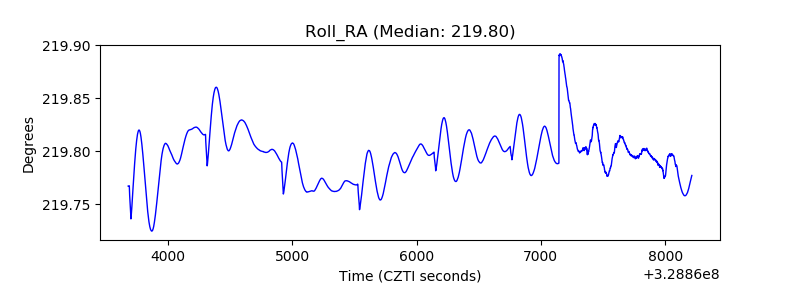 |
| Veto Counter | 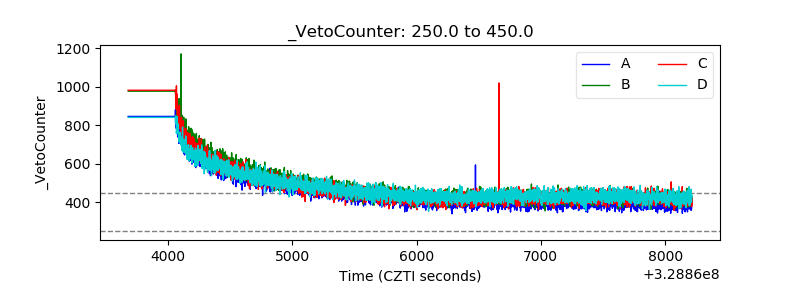 |