| Param | Original file | Final file |
|---|---|---|
| Filename | modeM0/AS1A07_059T07_9000003704cztM0_level2.fits | modeM0/AS1A07_059T07_9000003704cztM0_level2_quad_clean.evt |
| Size (bytes) | 203,175,360 | 52,358,400 |
| Size | 193.8 MB | 49.9 MB |
| Events in quadrant A | 1,336,674 | 109,587 |
| Events in quadrant B | 1,251,260 | 106,220 |
| Events in quadrant C | 1,272,716 | 101,483 |
| Events in quadrant D | 1,112,604 | 85,821 |
| Mode SS | |||
|---|---|---|---|
| Quadrant | BADHDUFLAG | Total packets | Discarded packets |
| A | 0 | 350 | 0 |
| B | 0 | 350 | 0 |
| C | 0 | 350 | 0 |
| D | 0 | 350 | 0 |
| Mode M9 | |||
|---|---|---|---|
| Quadrant | BADHDUFLAG | Total packets | Discarded packets |
| A | 0 | 52 | 0 |
| B | 0 | 52 | 0 |
| C | 0 | 52 | 0 |
| D | 0 | 52 | 0 |
| Mode M0 | |||
|---|---|---|---|
| Quadrant | BADHDUFLAG | Total packets | Discarded packets |
| A | 0 | 38701 | 0 |
| B | 0 | 43604 | 0 |
| C | 0 | 38822 | 0 |
| D | 0 | 59568 | 0 |
| Quadrant | Total seconds | Saturated seconds | Saturation percentage |
|---|---|---|---|
| A | 17113 | 310 | 1.811488% |
| B | 17113 | 489 | 2.857477% |
| C | 17113 | 383 | 2.238065% |
| D | 17113 | 1516 | 8.858762% |
Noise dominated data is calculated using 1-second bins in cleaned event files. If a bin has >2000 counts, and if more than 50% of those come from <1% of pixels, then it is considered to be noise-dominated and hence unusable.
| Quadrant | # 1 sec bins | Bins with >0 counts | Bins with >2000 counts | High rate bins dominated by noise | Noise dominated (total time) | Noise dominated (detector-on time) | Marked lightcurve |
|---|---|---|---|---|---|---|---|
| A | 22293 | 17110 | 0 | 0 | 0.00% | 0.00% |  |
| B | 22293 | 17108 | 0 | 0 | 0.00% | 0.00% | 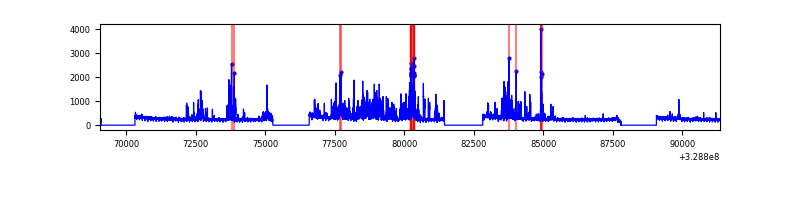 |
| C | 22293 | 17112 | 0 | 0 | 0.00% | 0.00% | 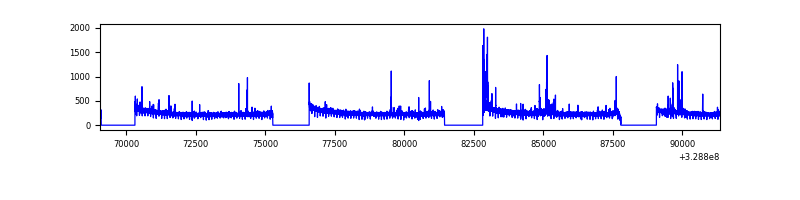 |
| D | 22293 | 17110 | 0 | 0 | 0.00% | 0.00% | 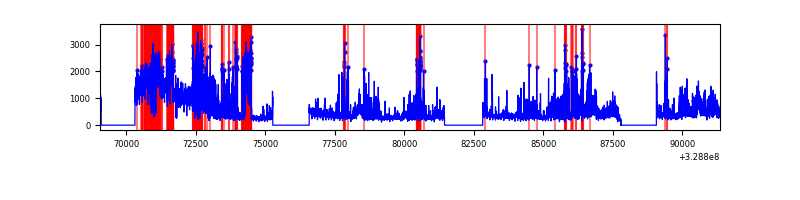 |
Top three noisy pixels from each quadrant. If the there are fewer than three noisy pixels in the level2.evt file, extra rows are filled as -1
| Pixel properties | Quadrant properties | ||||||
|---|---|---|---|---|---|---|---|
| Quadrant | DetID | PixID | Counts | Sigma | Mean | Median | Sigma |
| A | 0 | 29 | 1215 | 10.54 | 349 | 332 | 83.8 |
| A | 7 | 110 | 1024 | 8.26 | 349 | 332 | 83.8 |
| A | 9 | 19 | 985 | 7.8 | 349 | 332 | 83.8 |
| B | 2 | 9 | 945 | 9.47 | 330 | 319 | 66.1 |
| B | 5 | 128 | 846 | 7.97 | 330 | 319 | 66.1 |
| B | 2 | 8 | 797 | 7.23 | 330 | 319 | 66.1 |
| C | 1 | 81 | 966 | 7.54 | 336 | 318 | 86.0 |
| C | 1 | 80 | 939 | 7.22 | 336 | 318 | 86.0 |
| C | 9 | 209 | 871 | 6.43 | 336 | 318 | 86.0 |
| D | 10 | 189 | 817 | 6.34 | 317 | 293 | 82.7 |
| D | 6 | 67 | 766 | 5.72 | 317 | 293 | 82.7 |
| D | 6 | 38 | 765 | 5.71 | 317 | 293 | 82.7 |
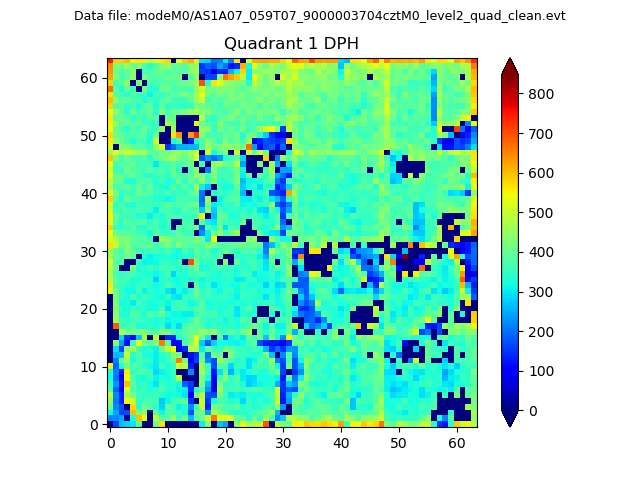
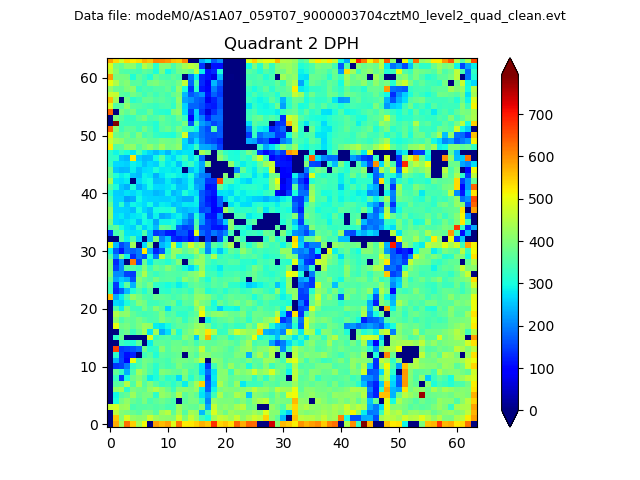
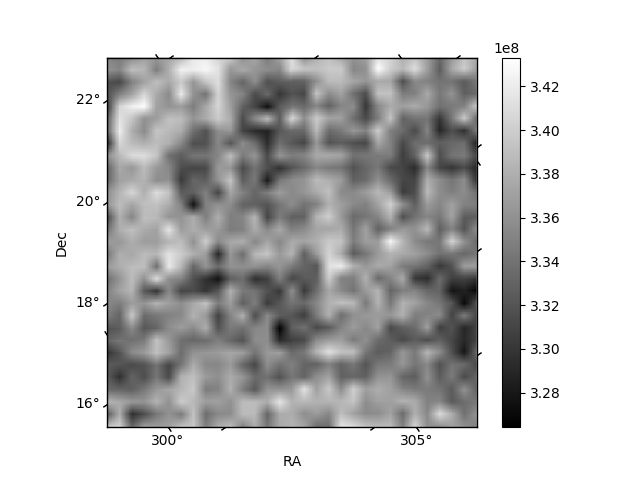
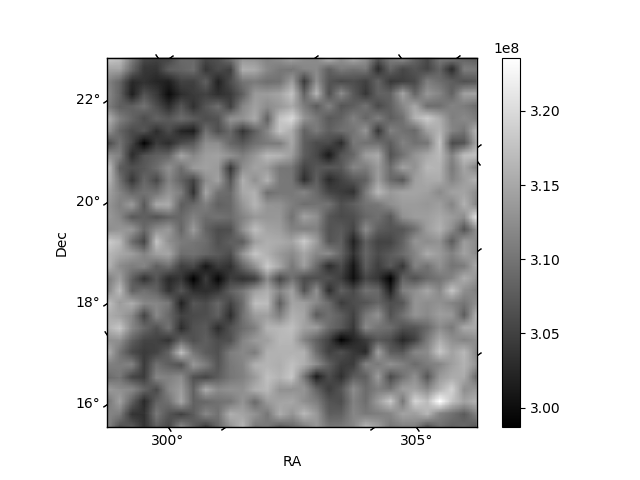
Histogram calculated using DETX and DETY for each event in the final _common_clean file
| Quadrant A | 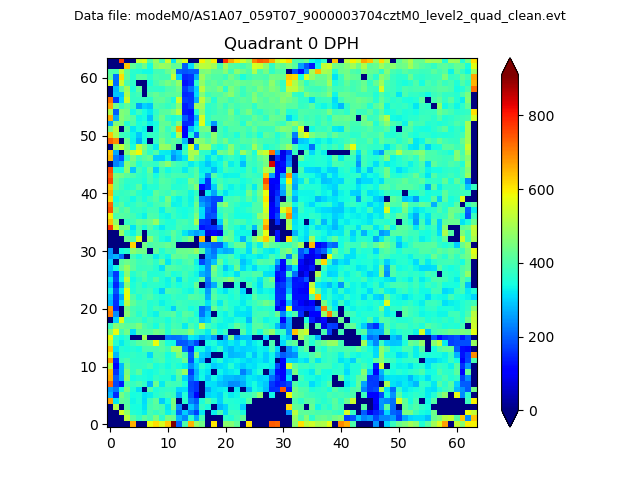 |
 |
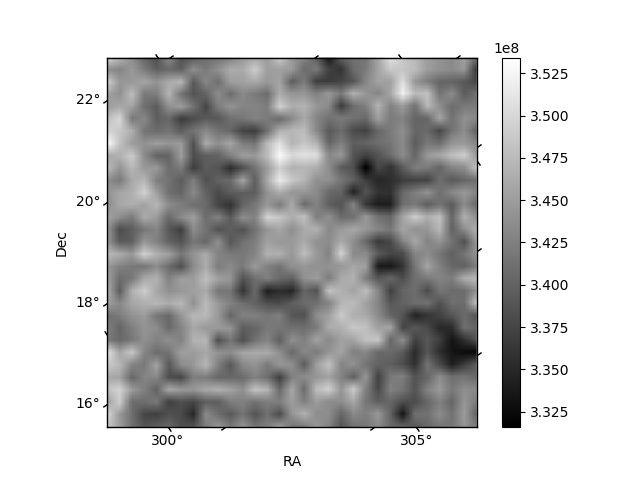
Quadrant B |
|---|---|---|---|
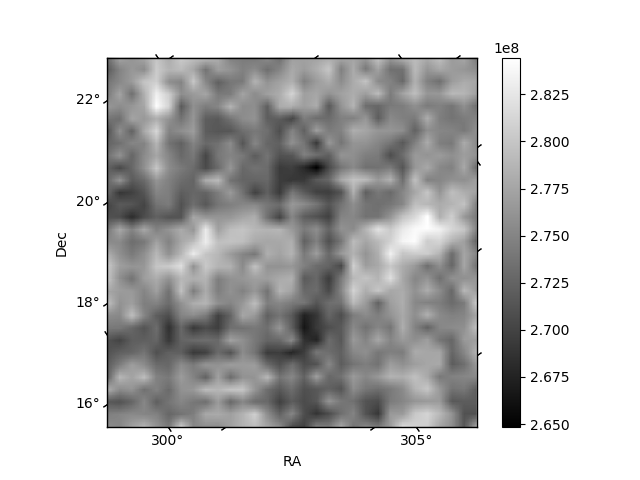
| Quadrant D | 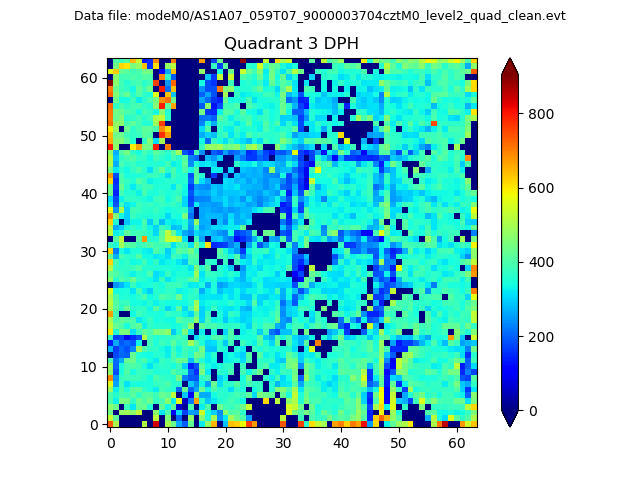 |
 |
Quadrant C |
| Plot type | Count rate plots | Images |
|---|---|---|
| Comparison with Poisson distribution Blue bars denote a histogram of data divided into 1 sec bins. Red curve is a Poisson curve with rate = median count rate of data. |
 |
 |
| Quadrant-wise count rates Data is divided into 100 sec bins |
 |
|
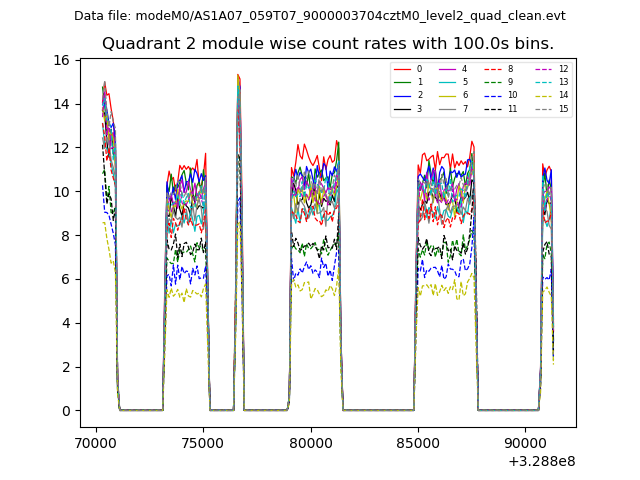
| Module-wise count rates for Quadrant A Data is divided into 100 sec bins |
 |
 |
| Module-wise count rates for Quadrant B Data is divided into 100 sec bins |
 |
 |
| Module-wise count rates for Quadrant C Data is divided into 100 sec bins |
 |
 |
| Module-wise count rates for Quadrant D Data is divided into 100 sec bins |
 |
 |
| Parameter | Plot |
|---|---|
| CZT HV Monitor | 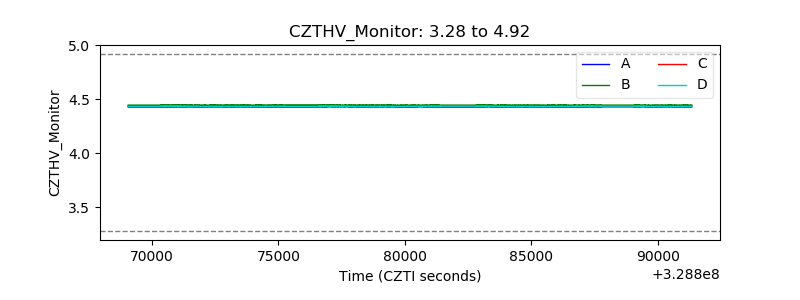 |
| D_VDD | 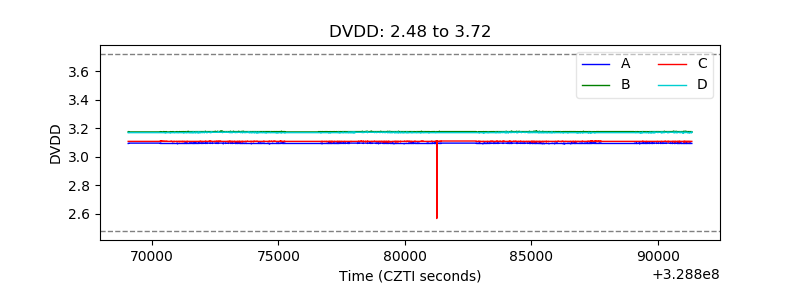 |
| Temperature 1 | 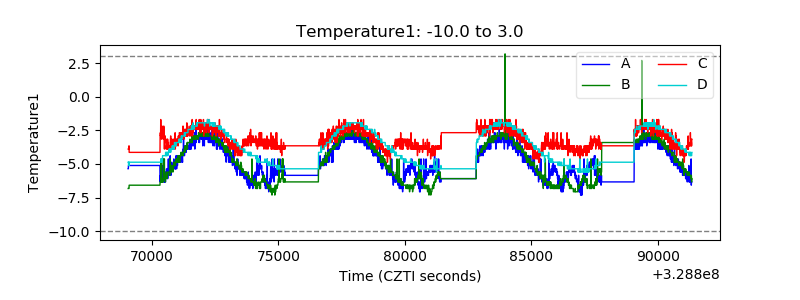 |
| Veto HV Monitor | 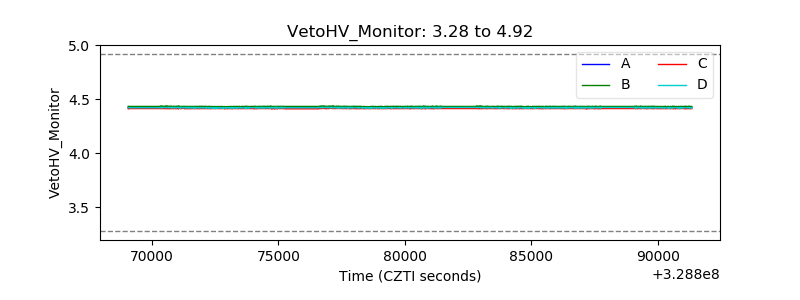 |
| Veto LLD | 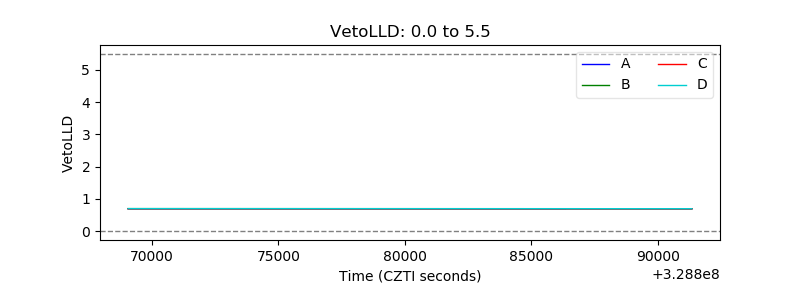 |
| Alpha Counter | 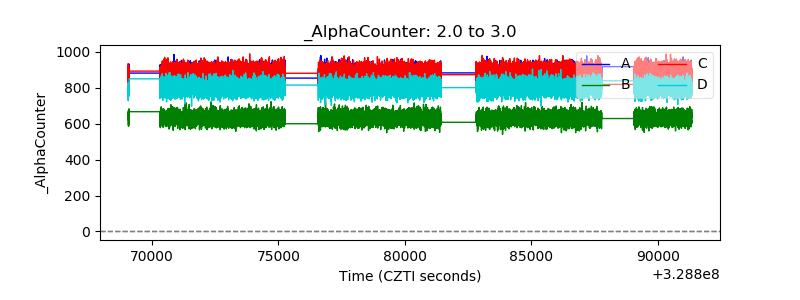 |
| _CPM_Rate | 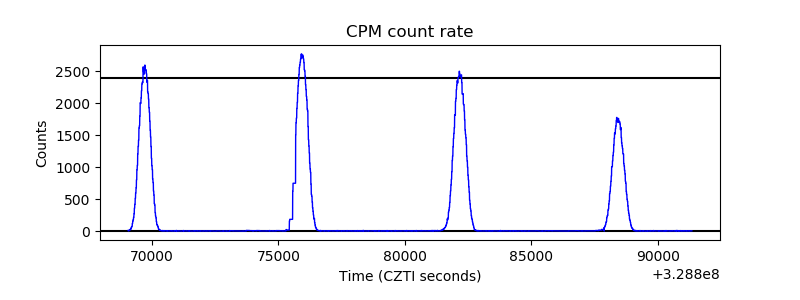 |
| CZT Counter | 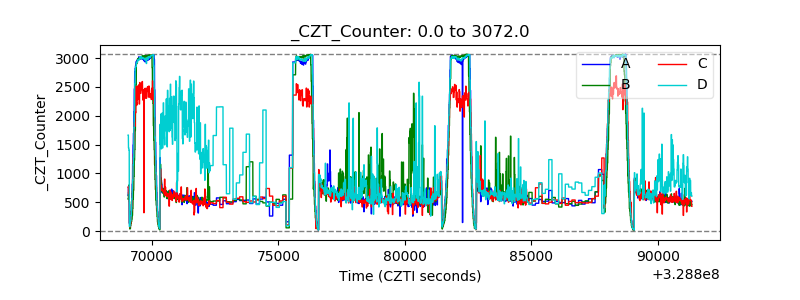 |
| +2.5 Volts monitor |  |
| +5 Volts monitor | 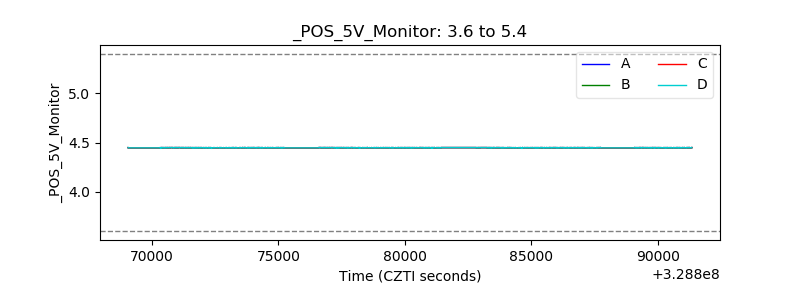 |
| _ROLL_ROT | 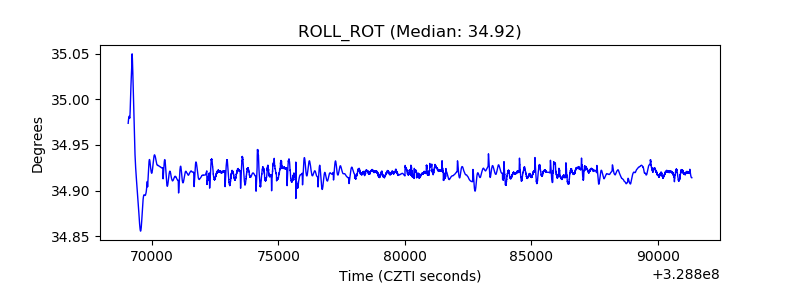 |
| _Roll_DEC | 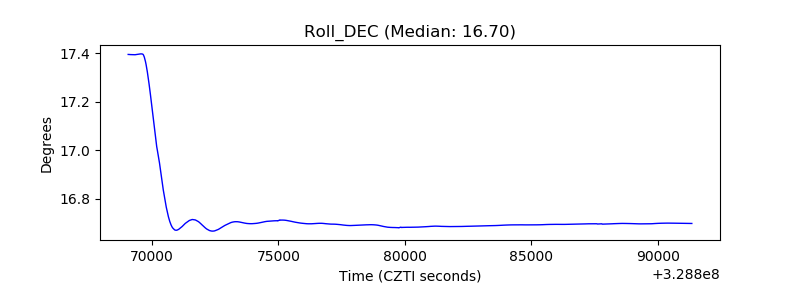 |
| _Roll_RA |  |
| Veto Counter |  |