| Param | Original file | Final file |
|---|---|---|
| Filename | modeM0/AS1A07_059T07_9000003704_25314cztM0_level2.evt | modeM0/AS1A07_059T07_9000003704_25314cztM0_level2_quad_clean.evt |
| Size (bytes) | 186,341,760 | 21,539,520 |
| Size | 177.7 MB | 20.5 MB |
| Events in quadrant A | 914,365 | 143,570 |
| Events in quadrant B | 898,972 | 145,332 |
| Events in quadrant C | 893,447 | 134,221 |
| Events in quadrant D | 2,834,139 | 118,790 |
| Mode M9 | |||
|---|---|---|---|
| Quadrant | BADHDUFLAG | Total packets | Discarded packets |
| A | 0 | 12 | 0 |
| B | 0 | 12 | 0 |
| C | 0 | 12 | 0 |
| D | 0 | 12 | 0 |
| Mode M0 | |||
|---|---|---|---|
| Quadrant | BADHDUFLAG | Total packets | Discarded packets |
| A | 0 | 3743 | 0 |
| B | 0 | 3654 | 0 |
| C | 0 | 3644 | 0 |
| D | 0 | 9411 | 0 |
| Quadrant | Total seconds | Saturated seconds | Saturation percentage |
|---|---|---|---|
| A | 1476 | 43 | 2.913279% |
| B | 1476 | 37 | 2.506775% |
| C | 1476 | 41 | 2.777778% |
| D | 1475 | 647 | 43.864407% |
Noise dominated data is calculated using 1-second bins in cleaned event files. If a bin has >2000 counts, and if more than 50% of those come from <1% of pixels, then it is considered to be noise-dominated and hence unusable.
| Quadrant | # 1 sec bins | Bins with >0 counts | Bins with >2000 counts | High rate bins dominated by noise | Noise dominated (total time) | Noise dominated (detector-on time) | Marked lightcurve |
|---|---|---|---|---|---|---|---|
| A | 2691 | 1477 | 0 | 0 | 0.00% | 0.00% | 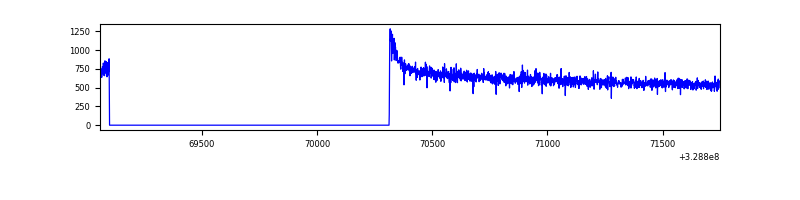 |
| B | 2691 | 1477 | 0 | 0 | 0.00% | 0.00% | 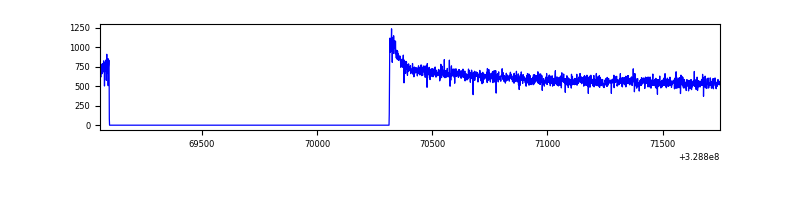 |
| C | 2691 | 1477 | 0 | 0 | 0.00% | 0.00% | 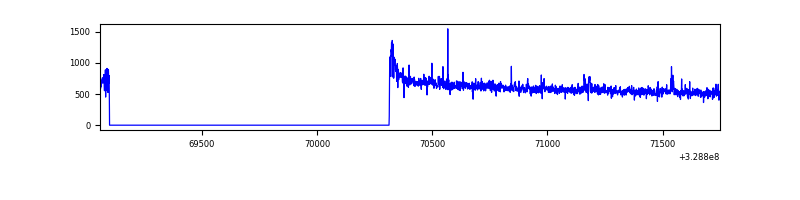 |
| D | 2690 | 1476 | 623 | 623 | 23.16% | 42.21% | 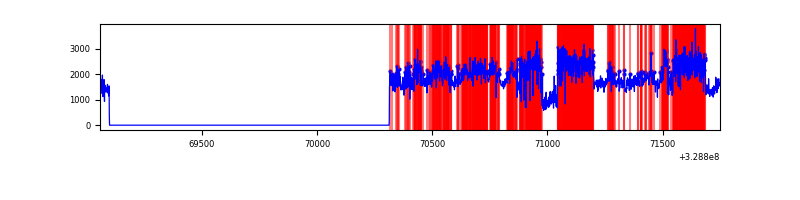 |
Top three noisy pixels from each quadrant. If the there are fewer than three noisy pixels in the level2.evt file, extra rows are filled as -1
| Pixel properties | Quadrant properties | ||||||
|---|---|---|---|---|---|---|---|
| Quadrant | DetID | PixID | Counts | Sigma | Mean | Median | Sigma |
| A | 13 | 254 | 2207 | 40.86 | 237 | 234 | 48.3 |
| A | 0 | 226 | 2127 | 39.21 | 237 | 234 | 48.3 |
| A | 3 | 137 | 1844 | 33.34 | 237 | 234 | 48.3 |
| B | 12 | 111 | 5095 | 109.42 | 229 | 225 | 44.5 |
| B | 11 | 111 | 4382 | 93.4 | 229 | 225 | 44.5 |
| B | 14 | 111 | 4271 | 90.91 | 229 | 225 | 44.5 |
| C | 14 | 238 | 37155 | 714.43 | 216 | 218 | 51.7 |
| C | 9 | 54 | 13027 | 247.75 | 216 | 218 | 51.7 |
| C | 3 | 233 | 2049 | 35.41 | 216 | 218 | 51.7 |
| D | 1 | 52 | 1898190 | 37637.77 | 205 | 199 | 50.4 |
| D | 7 | 238 | 122815 | 2431.51 | 205 | 199 | 50.4 |
| D | 8 | 195 | 31242 | 615.59 | 205 | 199 | 50.4 |
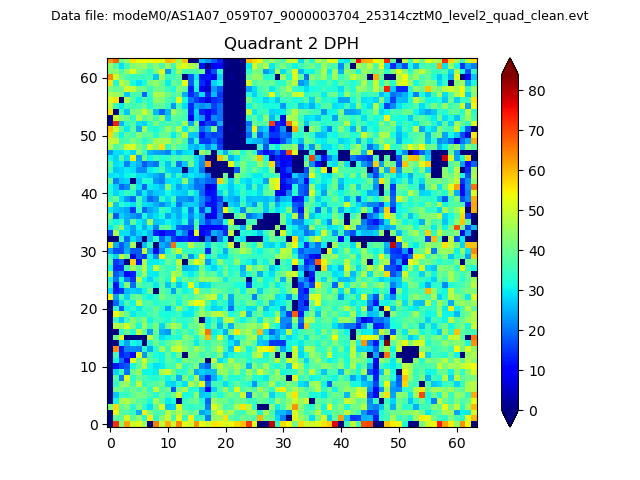
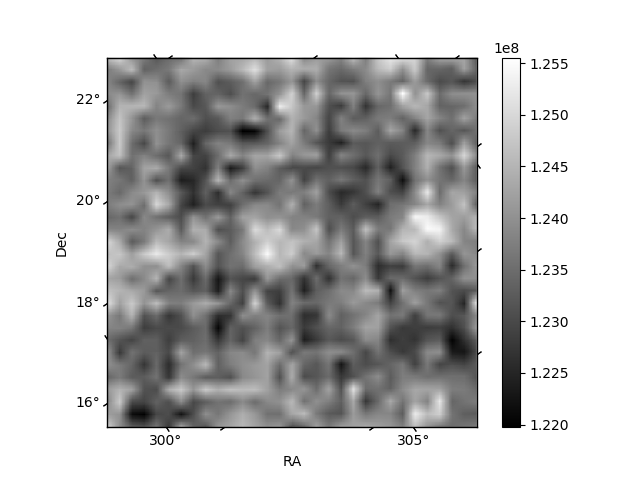
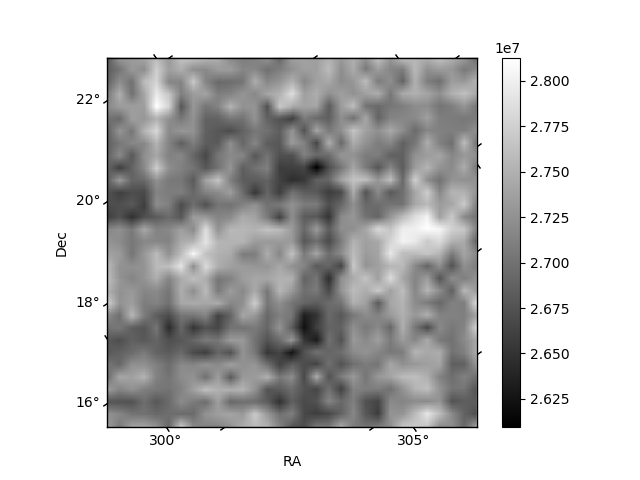
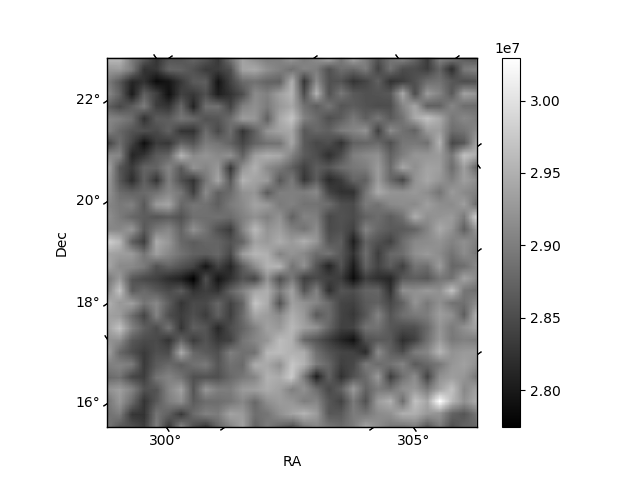
Histogram calculated using DETX and DETY for each event in the final _common_clean file
| Quadrant A | 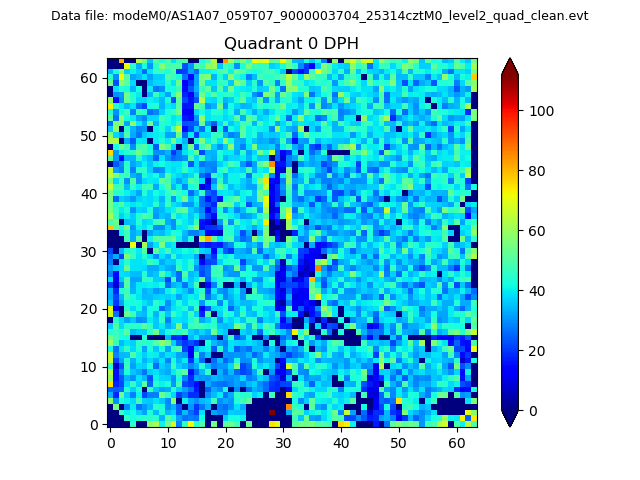 |
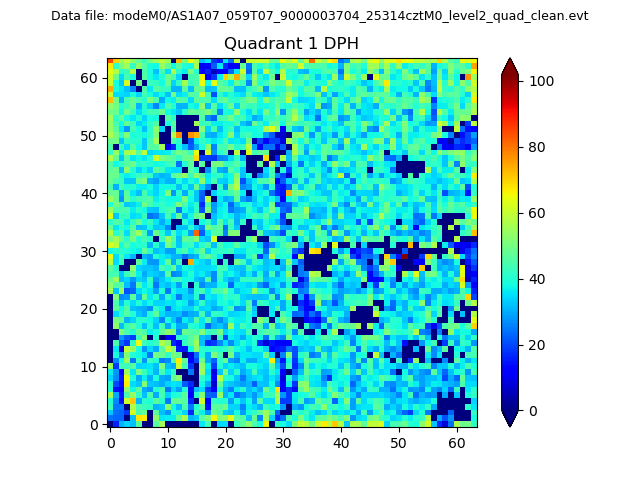 |
Quadrant B |
|---|---|---|---|
| Quadrant D | 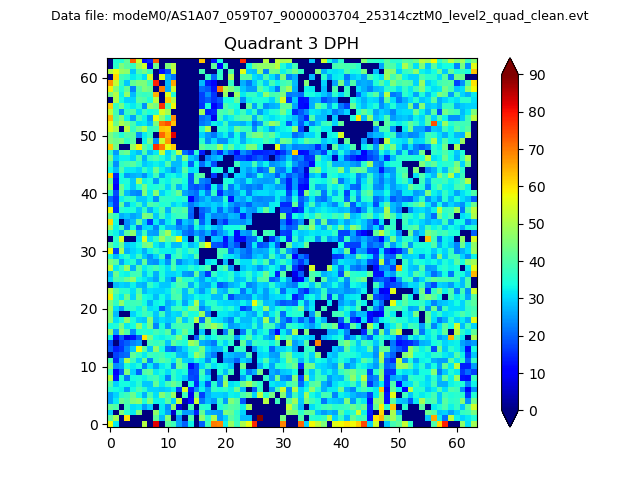 |
 |
Quadrant C |
| Plot type | Count rate plots | Images |
|---|---|---|
| Comparison with Poisson distribution Blue bars denote a histogram of data divided into 1 sec bins. Red curve is a Poisson curve with rate = median count rate of data. |
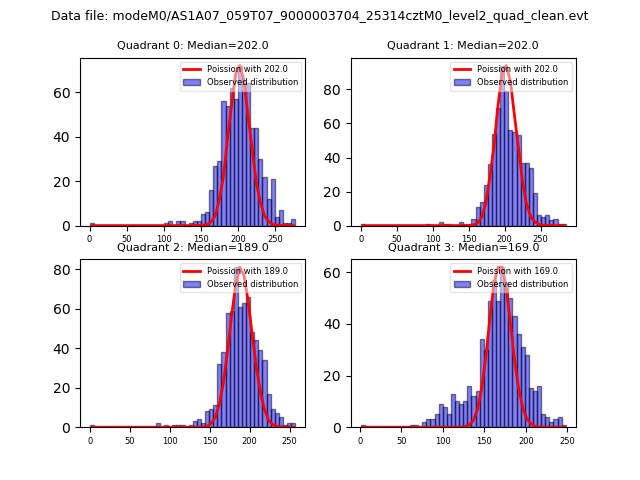 |
 |
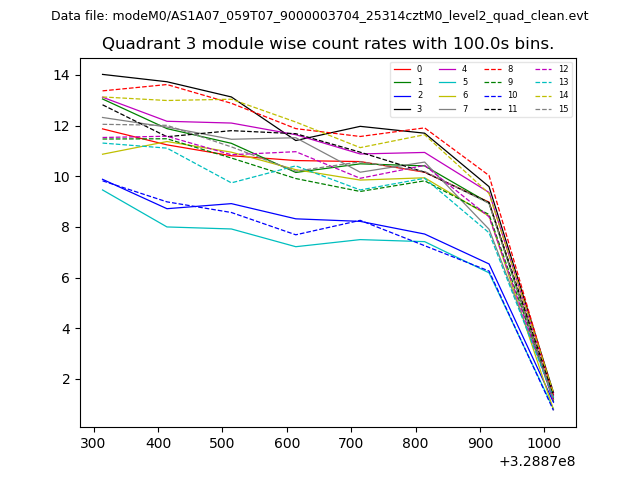
| Quadrant-wise count rates Data is divided into 100 sec bins |
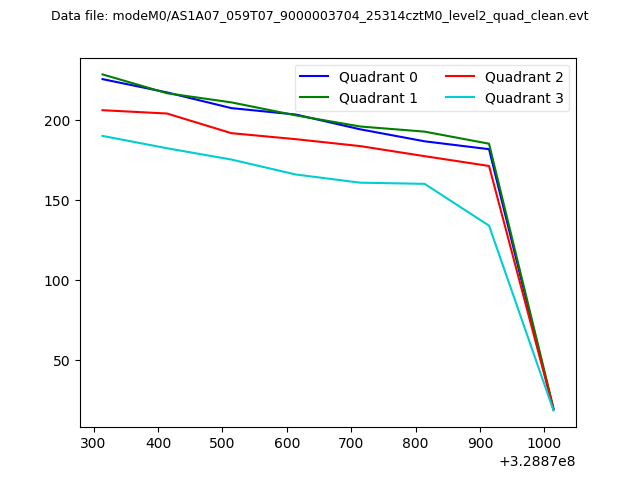 |
|
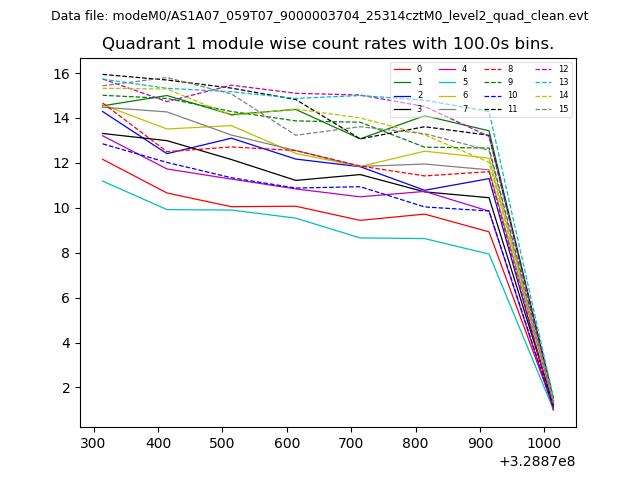
| Module-wise count rates for Quadrant A Data is divided into 100 sec bins |
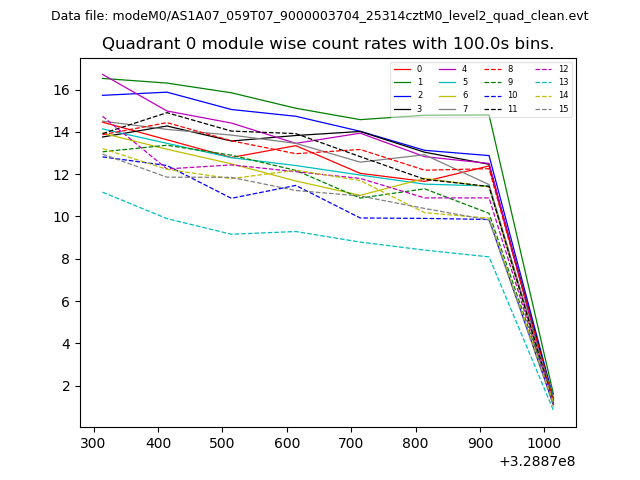 |
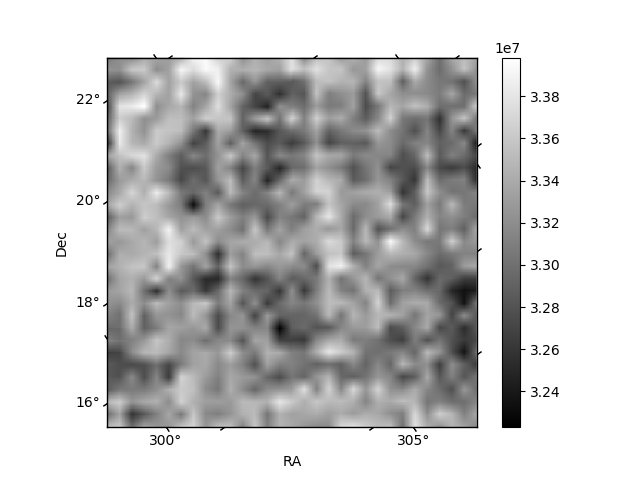 |
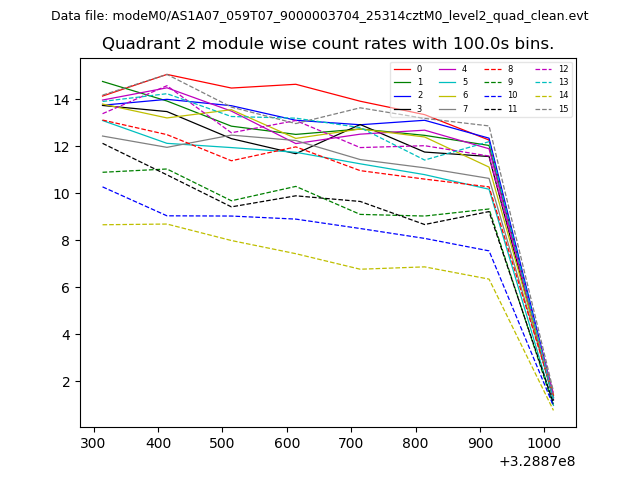
| Module-wise count rates for Quadrant B Data is divided into 100 sec bins |
 |
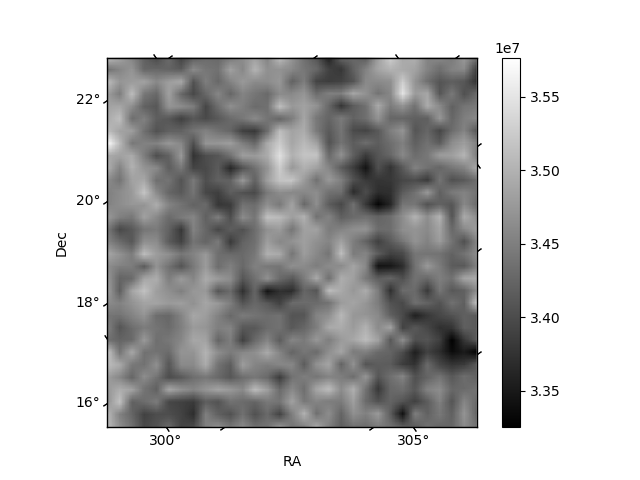 |
| Module-wise count rates for Quadrant C Data is divided into 100 sec bins |
 |
 |
| Module-wise count rates for Quadrant D Data is divided into 100 sec bins |
 |
 |
| Parameter | Plot |
|---|---|
| CZT HV Monitor | 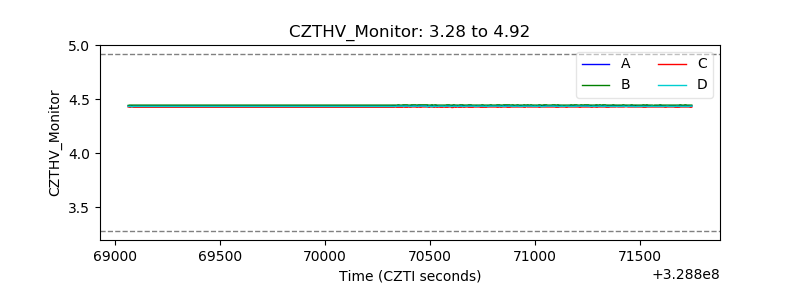 |
| D_VDD | 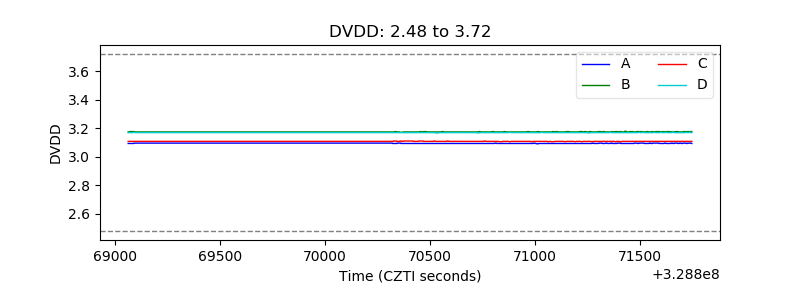 |
| Temperature 1 | 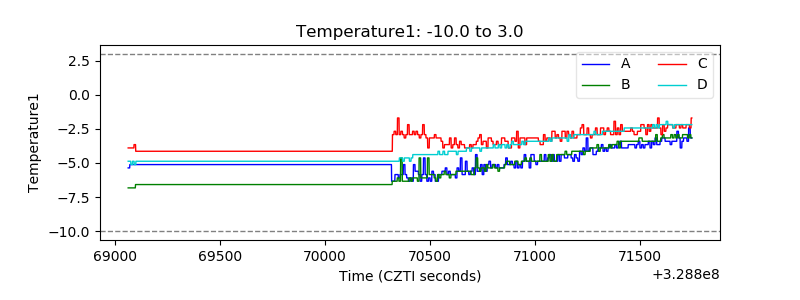 |
| Veto HV Monitor |  |
| Veto LLD | 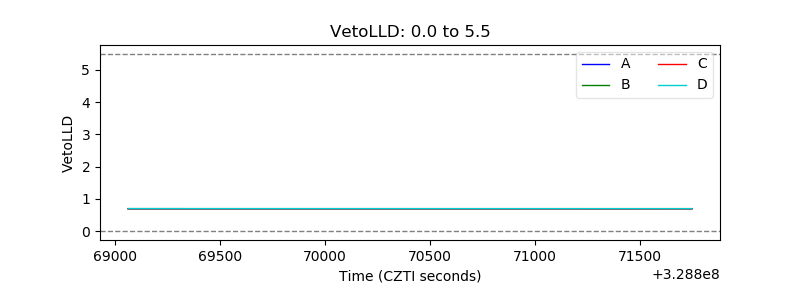 |
| Alpha Counter | 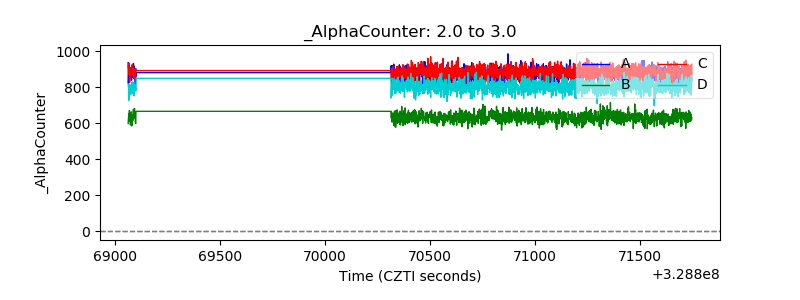 |
| _CPM_Rate | 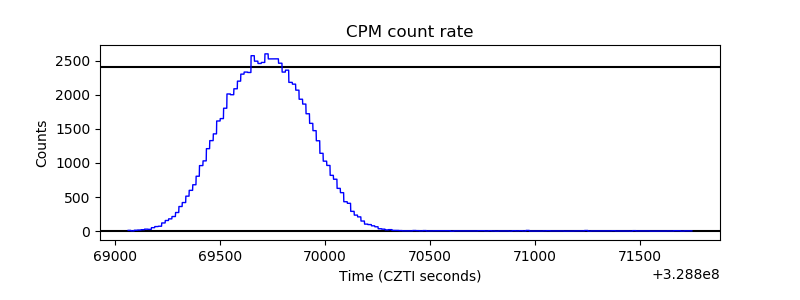 |
| CZT Counter | 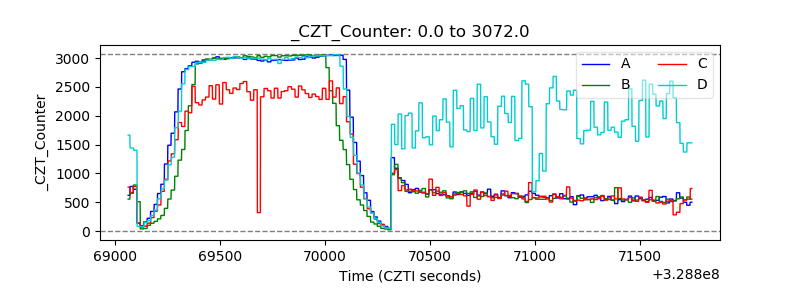 |
| +2.5 Volts monitor |  |
| +5 Volts monitor |  |
| _ROLL_ROT |  |
| _Roll_DEC | 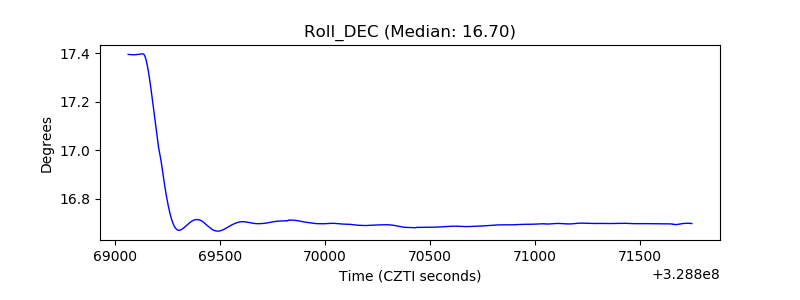 |
| _Roll_RA | 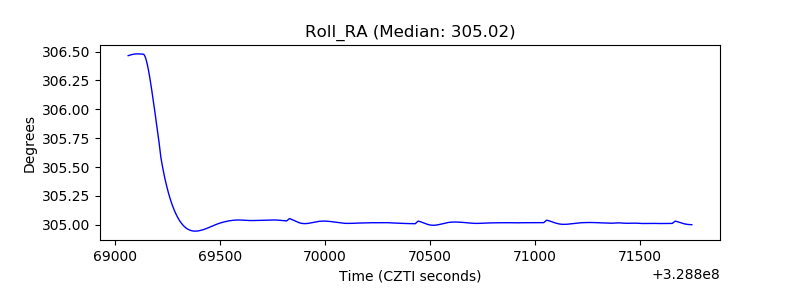 |
| Veto Counter | 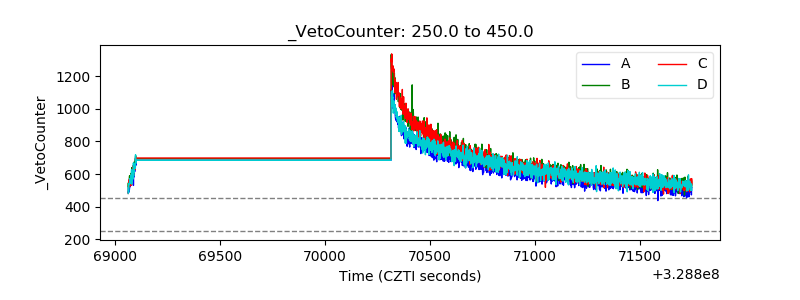 |