| Param | Original file | Final file |
|---|---|---|
| Filename | modeM0/AS1A07_059T07_9000003704_25315cztM0_level2.evt | modeM0/AS1A07_059T07_9000003704_25315cztM0_level2_quad_clean.evt |
| Size (bytes) | 598,668,480 | 69,229,440 |
| Size | 570.9 MB | 66.0 MB |
| Events in quadrant A | 3,407,165 | 438,989 |
| Events in quadrant B | 3,755,724 | 433,474 |
| Events in quadrant C | 3,318,168 | 413,235 |
| Events in quadrant D | 7,243,662 | 390,831 |
| Mode M9 | |||
|---|---|---|---|
| Quadrant | BADHDUFLAG | Total packets | Discarded packets |
| A | 0 | 14 | 0 |
| B | 0 | 14 | 0 |
| C | 0 | 14 | 0 |
| D | 0 | 14 | 0 |
| Mode M0 | |||
|---|---|---|---|
| Quadrant | BADHDUFLAG | Total packets | Discarded packets |
| A | 0 | 13667 | 0 |
| B | 0 | 14930 | 0 |
| C | 0 | 13413 | 0 |
| D | 0 | 25710 | 0 |
| Quadrant | Total seconds | Saturated seconds | Saturation percentage |
|---|---|---|---|
| A | 6013 | 61 | 1.014469% |
| B | 6013 | 109 | 1.812739% |
| C | 6013 | 80 | 1.330451% |
| D | 6013 | 1020 | 16.963246% |
Noise dominated data is calculated using 1-second bins in cleaned event files. If a bin has >2000 counts, and if more than 50% of those come from <1% of pixels, then it is considered to be noise-dominated and hence unusable.
| Quadrant | # 1 sec bins | Bins with >0 counts | Bins with >2000 counts | High rate bins dominated by noise | Noise dominated (total time) | Noise dominated (detector-on time) | Marked lightcurve |
|---|---|---|---|---|---|---|---|
| A | 7323 | 6014 | 0 | 0 | 0.00% | 0.00% | 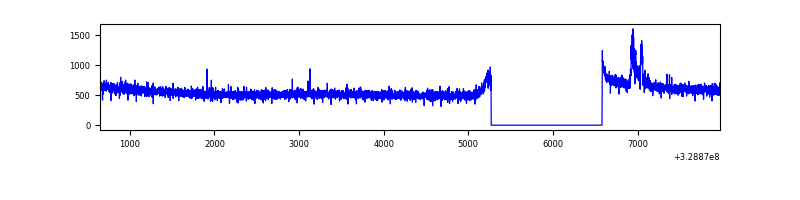 |
| B | 7323 | 6014 | 30 | 30 | 0.41% | 0.50% | 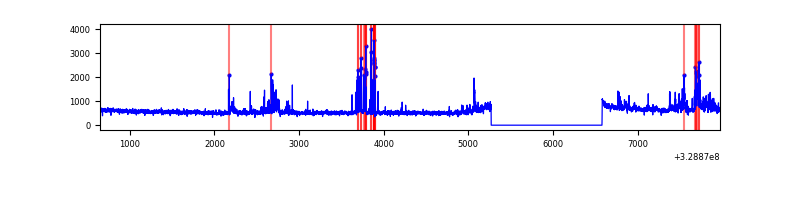 |
| C | 7323 | 6014 | 0 | 0 | 0.00% | 0.00% | 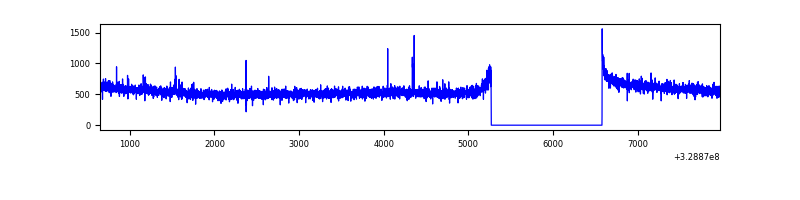 |
| D | 7323 | 6013 | 970 | 970 | 13.25% | 16.13% | 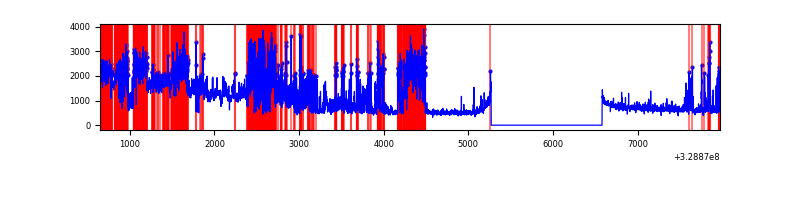 |
Top three noisy pixels from each quadrant. If the there are fewer than three noisy pixels in the level2.evt file, extra rows are filled as -1
| Pixel properties | Quadrant properties | ||||||
|---|---|---|---|---|---|---|---|
| Quadrant | DetID | PixID | Counts | Sigma | Mean | Median | Sigma |
| A | 6 | 16 | 61015 | 354.6 | 868 | 854 | 169.7 |
| A | 13 | 254 | 9401 | 50.38 | 868 | 854 | 169.7 |
| A | 0 | 226 | 7488 | 39.1 | 868 | 854 | 169.7 |
| B | 3 | 112 | 237252 | 1507.92 | 845 | 829 | 156.8 |
| B | 3 | 64 | 213186 | 1354.43 | 845 | 829 | 156.8 |
| B | 12 | 111 | 18780 | 114.49 | 845 | 829 | 156.8 |
| C | 14 | 238 | 133655 | 710.46 | 810 | 818 | 187.0 |
| C | 9 | 54 | 14618 | 73.81 | 810 | 818 | 187.0 |
| C | 7 | 247 | 6304 | 29.34 | 810 | 818 | 187.0 |
| D | 1 | 52 | 3753322 | 19349.41 | 805 | 784 | 193.9 |
| D | 7 | 238 | 191134 | 981.51 | 805 | 784 | 193.9 |
| D | 8 | 195 | 173898 | 892.64 | 805 | 784 | 193.9 |
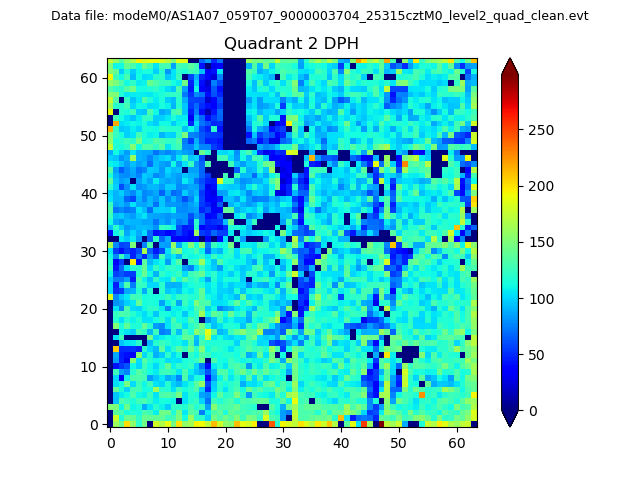
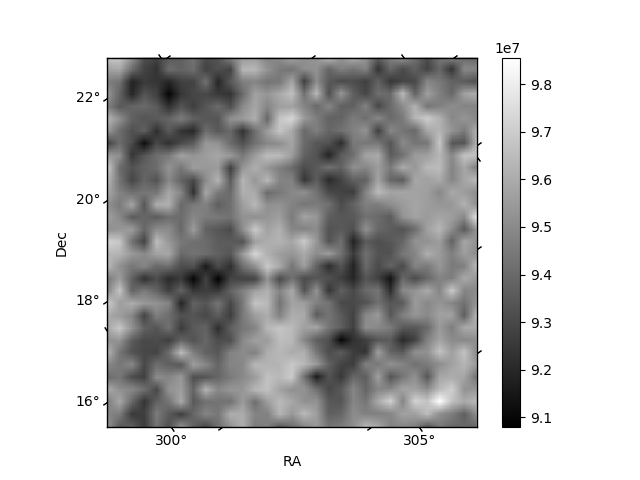
Histogram calculated using DETX and DETY for each event in the final _common_clean file
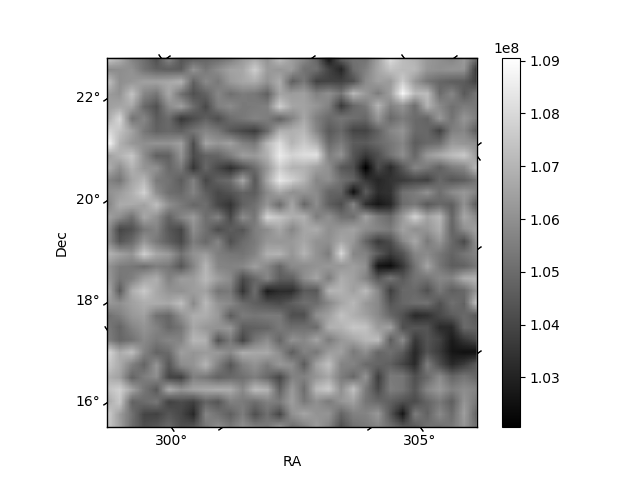
| Quadrant A | 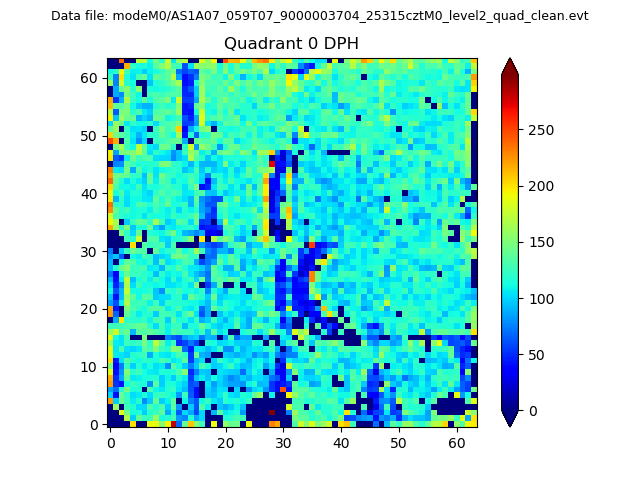 |
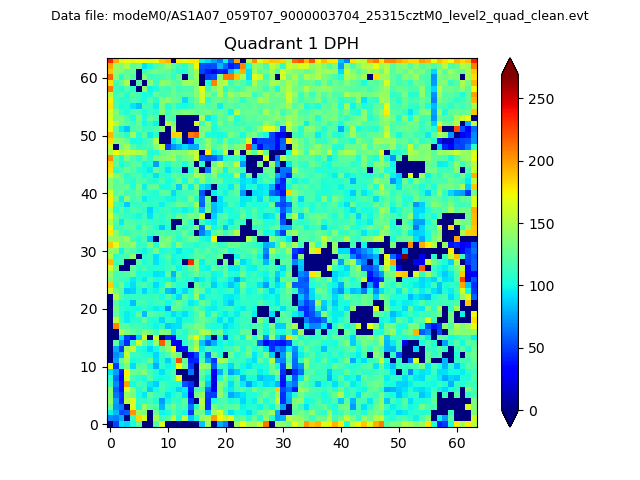 |
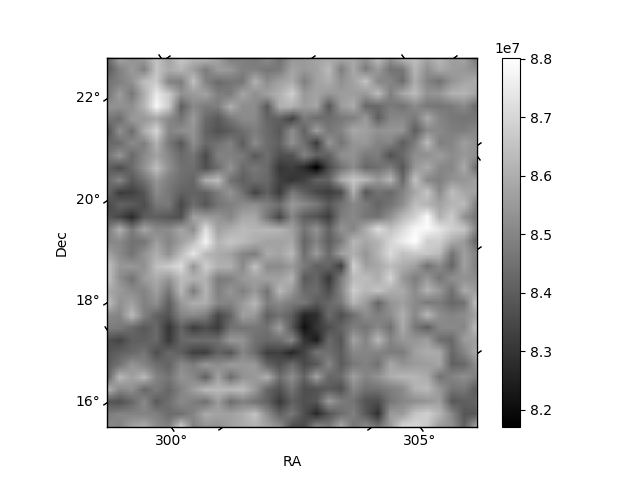
Quadrant B |
|---|---|---|---|
| Quadrant D | 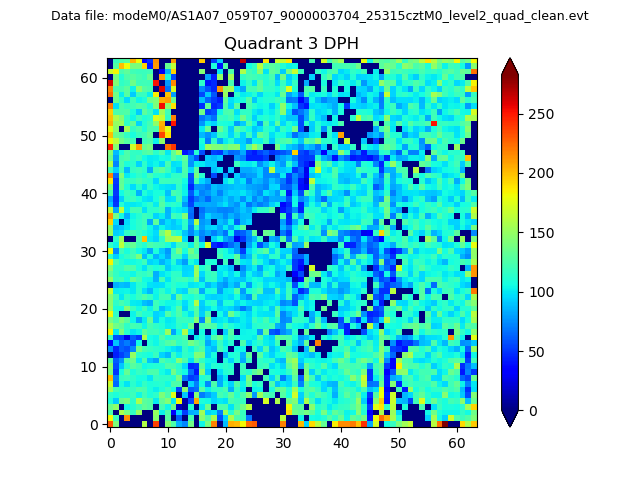 |
 |
Quadrant C |
| Plot type | Count rate plots | Images |
|---|---|---|
| Comparison with Poisson distribution Blue bars denote a histogram of data divided into 1 sec bins. Red curve is a Poisson curve with rate = median count rate of data. |
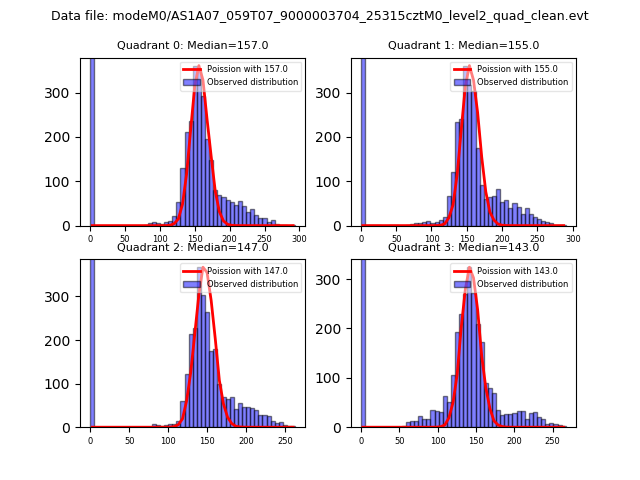 |
 |
| Quadrant-wise count rates Data is divided into 100 sec bins |
 |
|
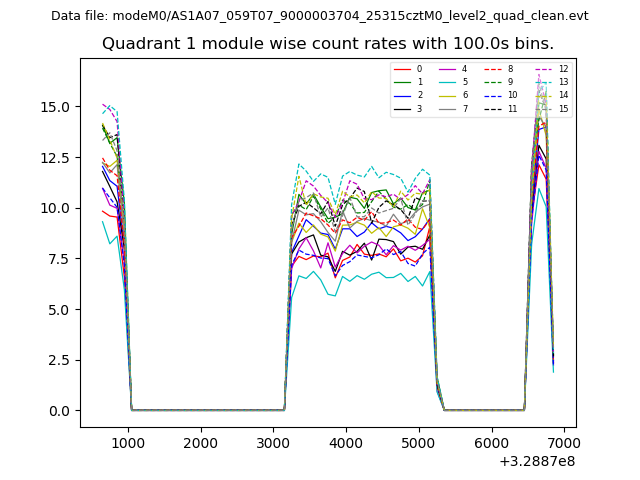
| Module-wise count rates for Quadrant A Data is divided into 100 sec bins |
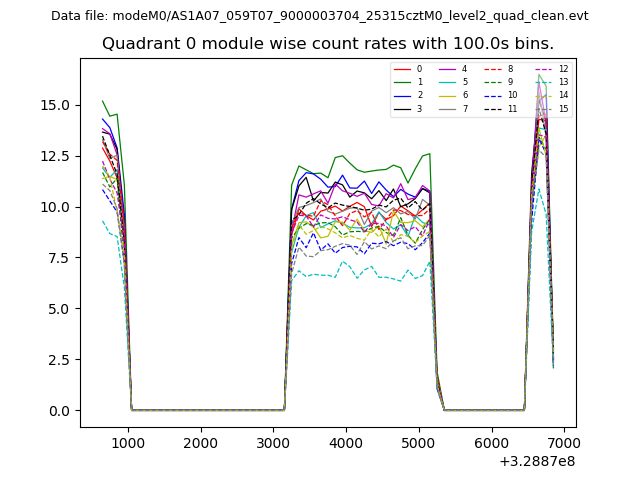 |
 |
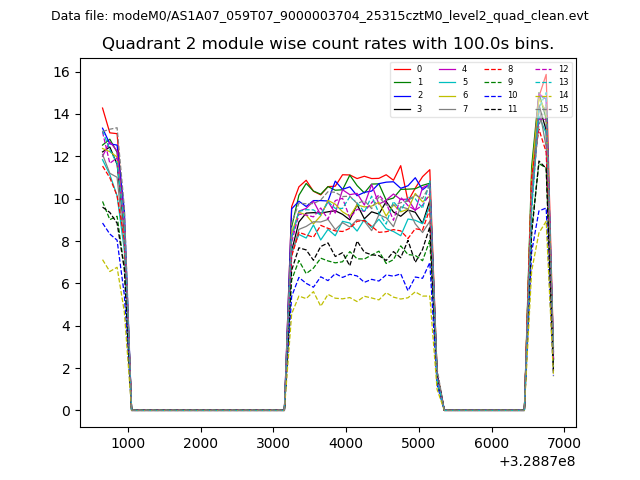
| Module-wise count rates for Quadrant B Data is divided into 100 sec bins |
 |
 |
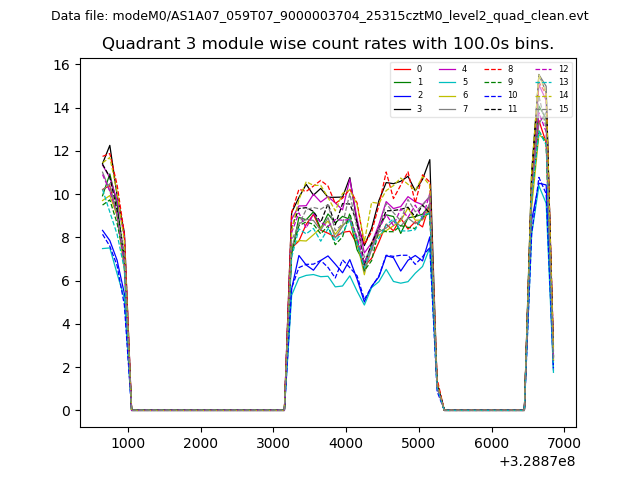
| Module-wise count rates for Quadrant C Data is divided into 100 sec bins |
 |
 |
| Module-wise count rates for Quadrant D Data is divided into 100 sec bins |
 |
 |
| Parameter | Plot |
|---|---|
| CZT HV Monitor | 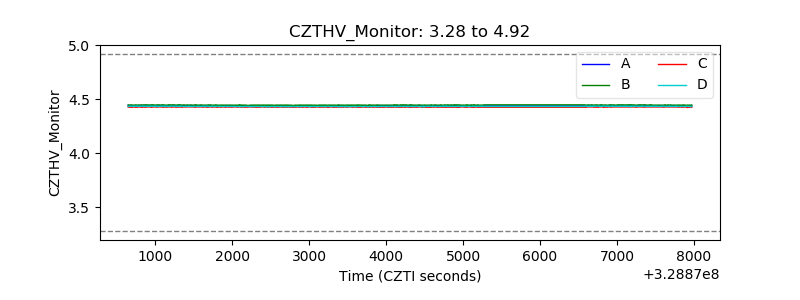 |
| D_VDD | 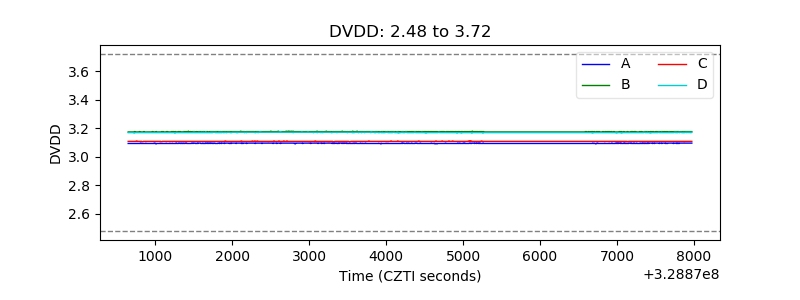 |
| Temperature 1 | 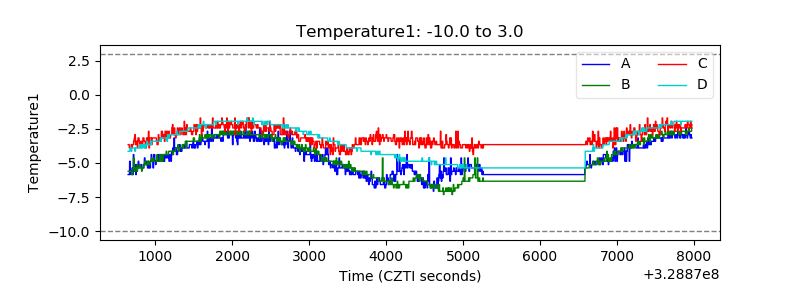 |
| Veto HV Monitor | 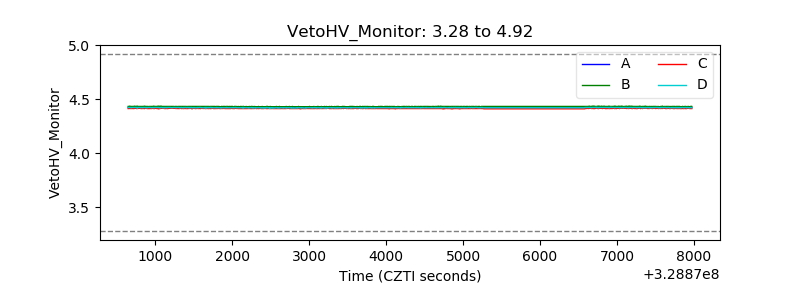 |
| Veto LLD | 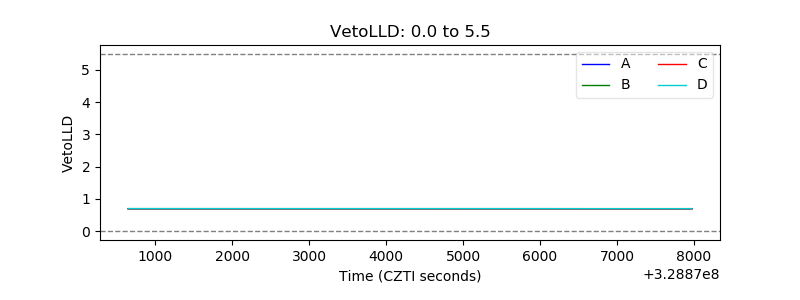 |
| Alpha Counter |  |
| _CPM_Rate | 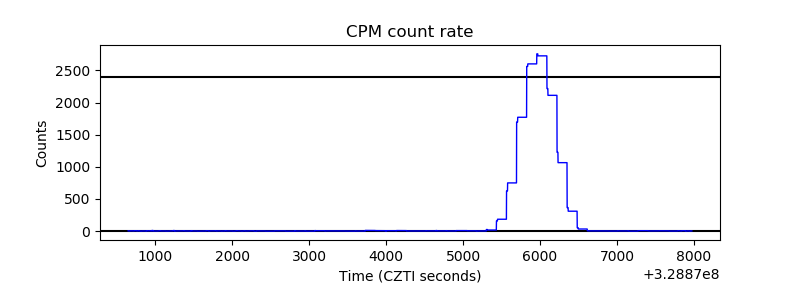 |
| CZT Counter | 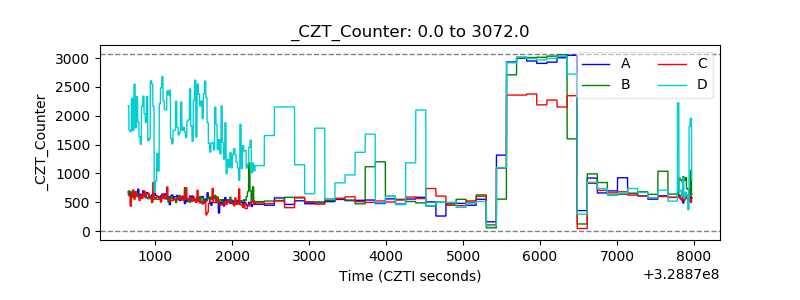 |
| +2.5 Volts monitor |  |
| +5 Volts monitor |  |
| _ROLL_ROT | 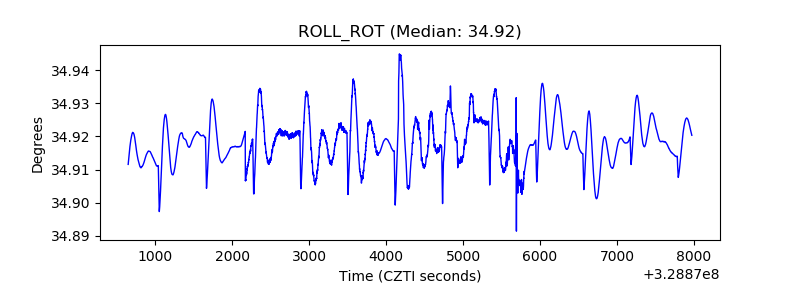 |
| _Roll_DEC | 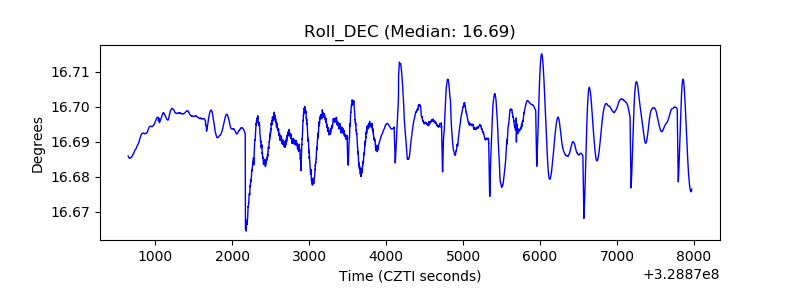 |
| _Roll_RA | 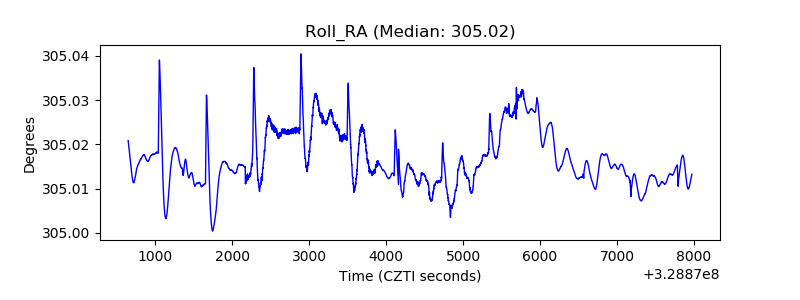 |
| Veto Counter | 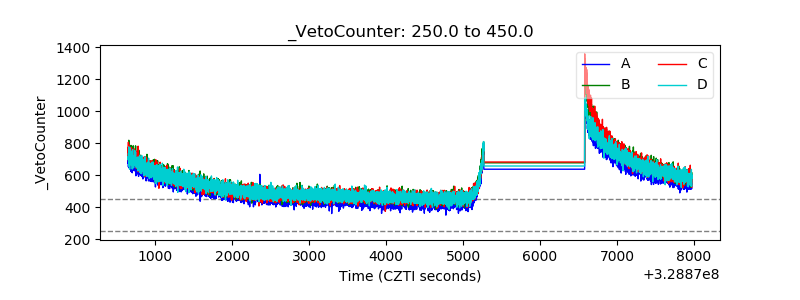 |