| Param | Original file | Final file |
|---|---|---|
| Filename | modeM0/AS1A07_059T07_9000003704_25316cztM0_level2.evt | modeM0/AS1A07_059T07_9000003704_25316cztM0_level2_quad_clean.evt |
| Size (bytes) | 554,590,080 | 69,359,040 |
| Size | 528.9 MB | 66.1 MB |
| Events in quadrant A | 3,663,881 | 431,719 |
| Events in quadrant B | 4,753,471 | 424,150 |
| Events in quadrant C | 3,628,443 | 406,897 |
| Events in quadrant D | 4,329,777 | 403,721 |
| Mode M9 | |||
|---|---|---|---|
| Quadrant | BADHDUFLAG | Total packets | Discarded packets |
| A | 0 | 17 | 0 |
| B | 0 | 18 | 0 |
| C | 0 | 18 | 0 |
| D | 0 | 18 | 0 |
| Mode M0 | |||
|---|---|---|---|
| Quadrant | BADHDUFLAG | Total packets | Discarded packets |
| A | 0 | 14796 | 0 |
| B | 0 | 18642 | 0 |
| C | 0 | 14597 | 0 |
| D | 0 | 17248 | 0 |
| Quadrant | Total seconds | Saturated seconds | Saturation percentage |
|---|---|---|---|
| A | 6219 | 66 | 1.061264% |
| B | 6219 | 186 | 2.990835% |
| C | 6219 | 92 | 1.479338% |
| D | 6219 | 129 | 2.074288% |
Noise dominated data is calculated using 1-second bins in cleaned event files. If a bin has >2000 counts, and if more than 50% of those come from <1% of pixels, then it is considered to be noise-dominated and hence unusable.
| Quadrant | # 1 sec bins | Bins with >0 counts | Bins with >2000 counts | High rate bins dominated by noise | Noise dominated (total time) | Noise dominated (detector-on time) | Marked lightcurve |
|---|---|---|---|---|---|---|---|
| A | 7594 | 6220 | 0 | 0 | 0.00% | 0.00% | 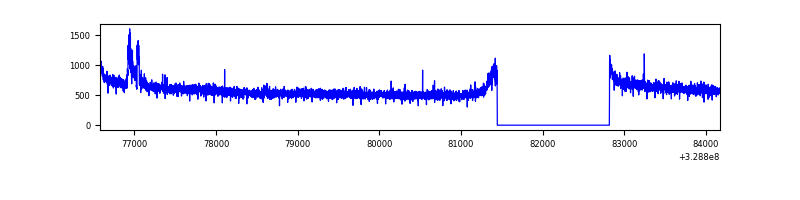 |
| B | 7594 | 6220 | 57 | 57 | 0.75% | 0.92% | 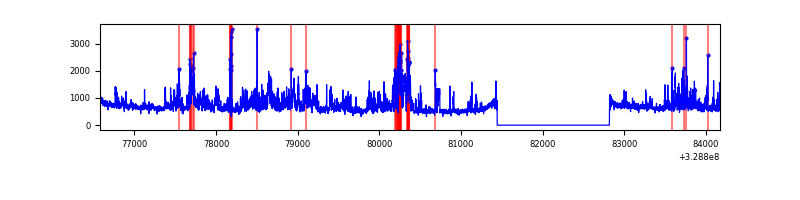 |
| C | 7594 | 6220 | 7 | 7 | 0.09% | 0.11% | 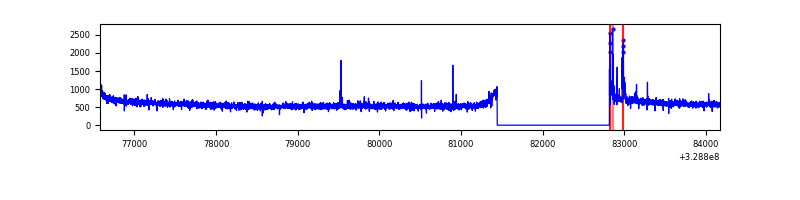 |
| D | 7594 | 6220 | 70 | 70 | 0.92% | 1.13% | 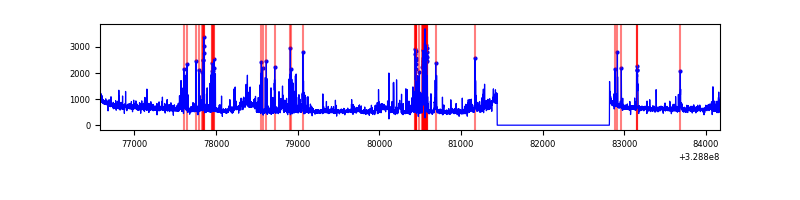 |
Top three noisy pixels from each quadrant. If the there are fewer than three noisy pixels in the level2.evt file, extra rows are filled as -1
| Pixel properties | Quadrant properties | ||||||
|---|---|---|---|---|---|---|---|
| Quadrant | DetID | PixID | Counts | Sigma | Mean | Median | Sigma |
| A | 6 | 16 | 60161 | 324.59 | 934 | 922 | 182.5 |
| A | 13 | 254 | 9327 | 46.05 | 934 | 922 | 182.5 |
| A | 0 | 226 | 7976 | 38.65 | 934 | 922 | 182.5 |
| B | 3 | 112 | 1061555 | 6342.22 | 910 | 892 | 167.2 |
| B | 3 | 64 | 106065 | 628.88 | 910 | 892 | 167.2 |
| B | 15 | 32 | 20340 | 116.29 | 910 | 892 | 167.2 |
| C | 14 | 238 | 143469 | 713.4 | 875 | 885 | 199.9 |
| C | 9 | 54 | 62095 | 306.26 | 875 | 885 | 199.9 |
| C | 3 | 233 | 10544 | 48.33 | 875 | 885 | 199.9 |
| D | 1 | 52 | 592052 | 2745.28 | 902 | 882 | 215.3 |
| D | 8 | 195 | 131219 | 605.26 | 902 | 882 | 215.3 |
| D | 12 | 233 | 106728 | 491.53 | 902 | 882 | 215.3 |
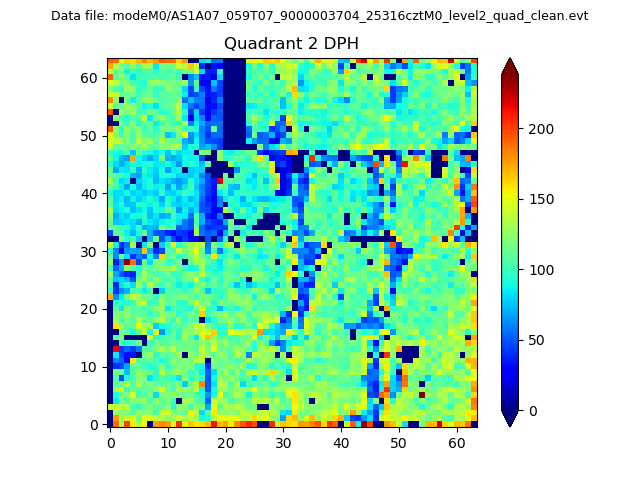
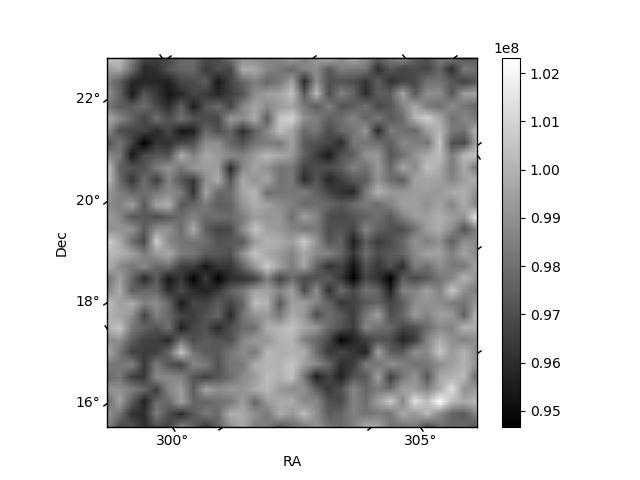
Histogram calculated using DETX and DETY for each event in the final _common_clean file
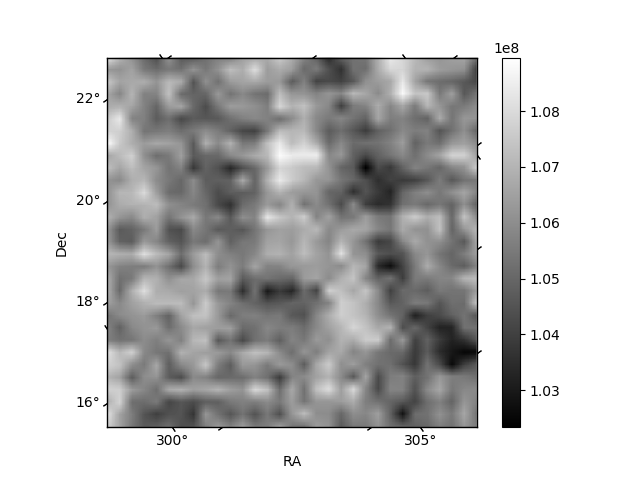
| Quadrant A | 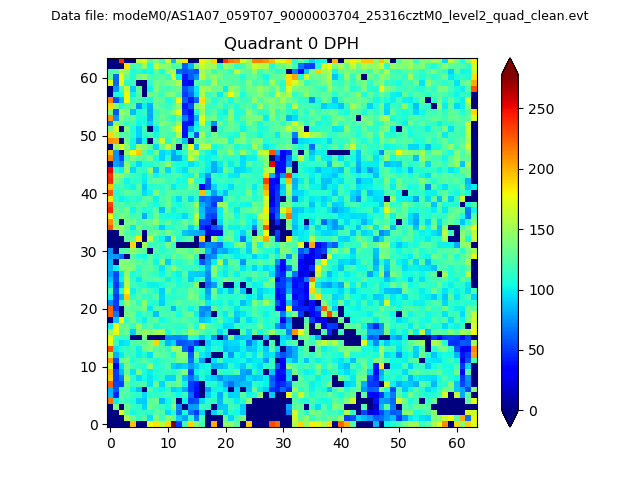 |
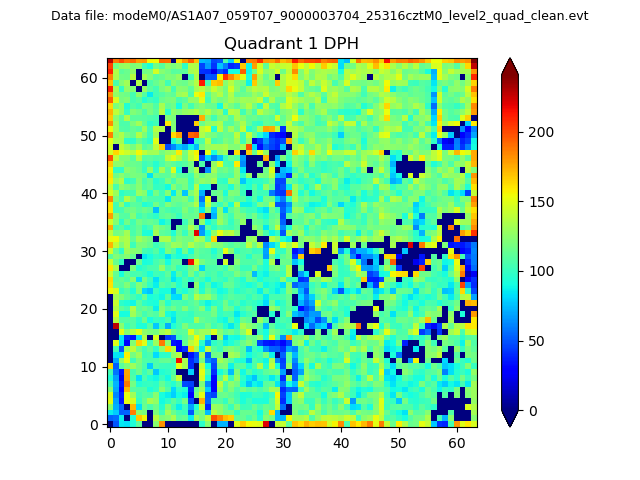 |
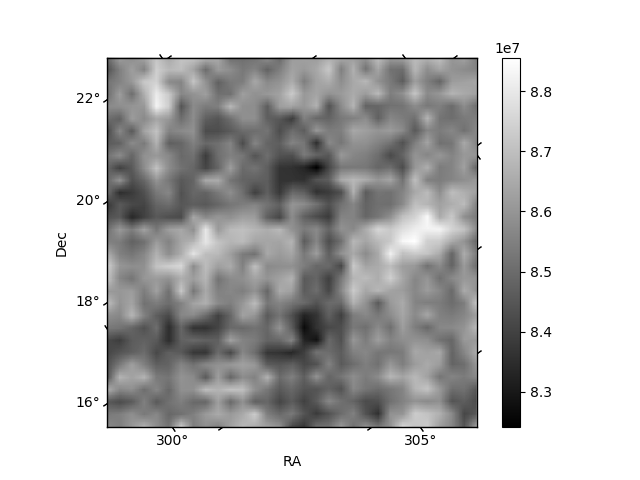
Quadrant B |
|---|---|---|---|
| Quadrant D | 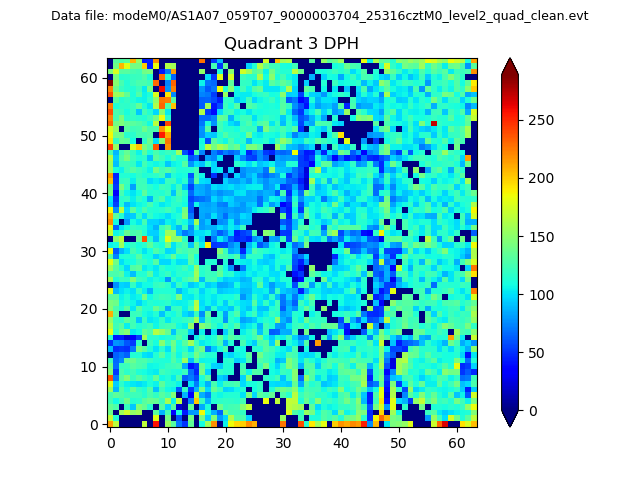 |
 |
Quadrant C |
| Plot type | Count rate plots | Images |
|---|---|---|
| Comparison with Poisson distribution Blue bars denote a histogram of data divided into 1 sec bins. Red curve is a Poisson curve with rate = median count rate of data. |
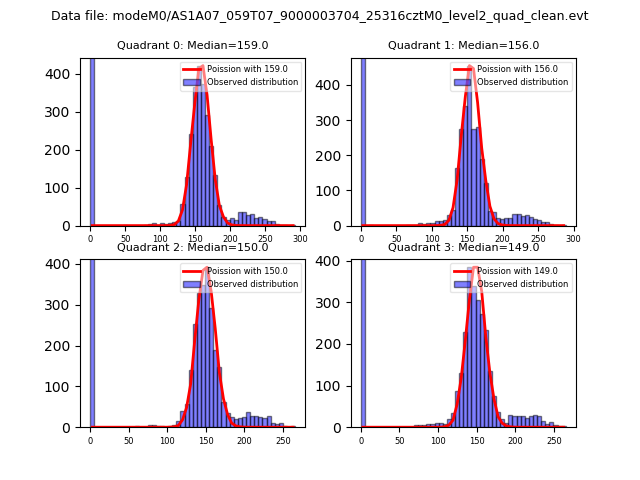 |
 |
| Quadrant-wise count rates Data is divided into 100 sec bins |
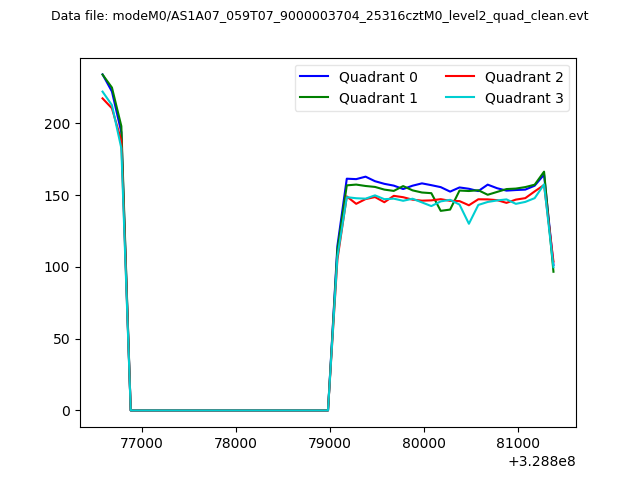 |
|
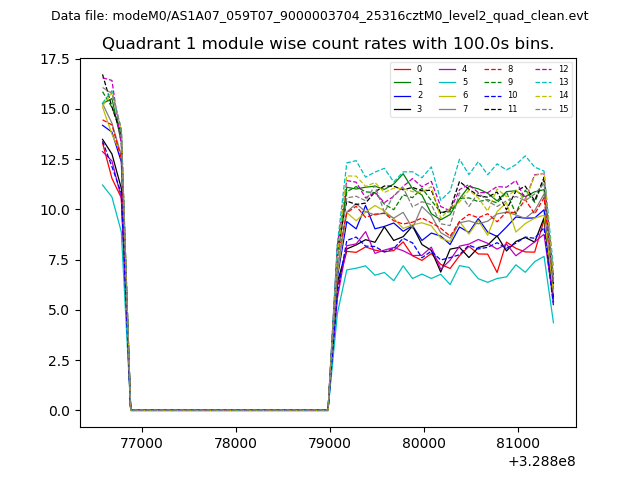
| Module-wise count rates for Quadrant A Data is divided into 100 sec bins |
 |
 |
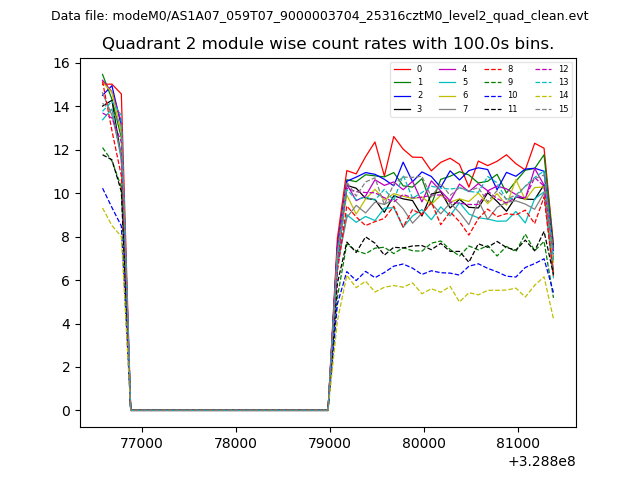
| Module-wise count rates for Quadrant B Data is divided into 100 sec bins |
 |
 |
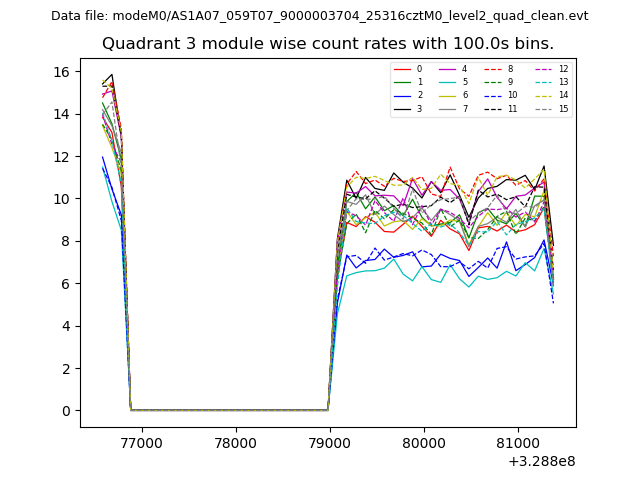
| Module-wise count rates for Quadrant C Data is divided into 100 sec bins |
 |
 |
| Module-wise count rates for Quadrant D Data is divided into 100 sec bins |
 |
 |
| Parameter | Plot |
|---|---|
| CZT HV Monitor | 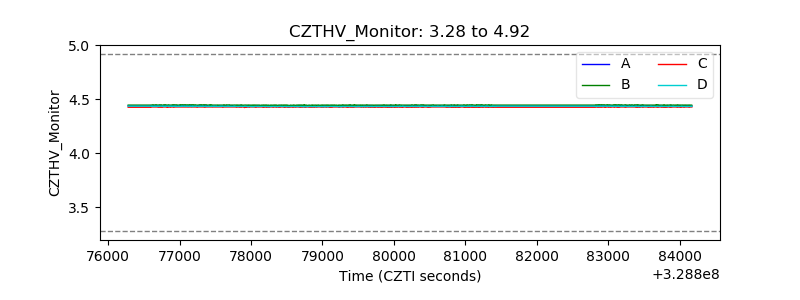 |
| D_VDD | 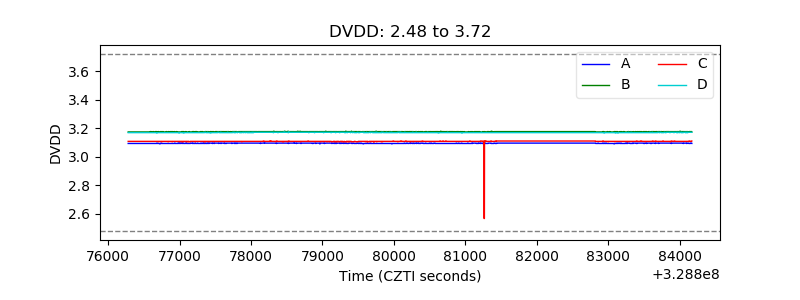 |
| Temperature 1 | 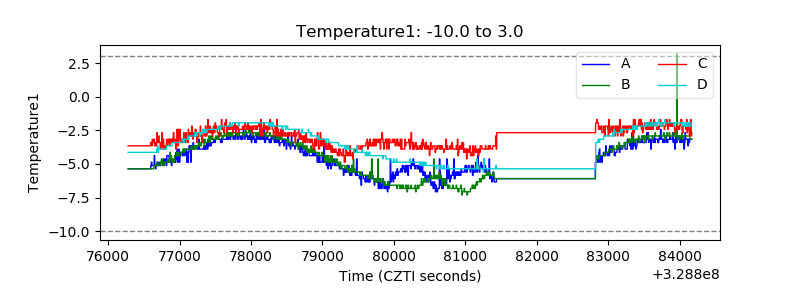 |
| Veto HV Monitor | 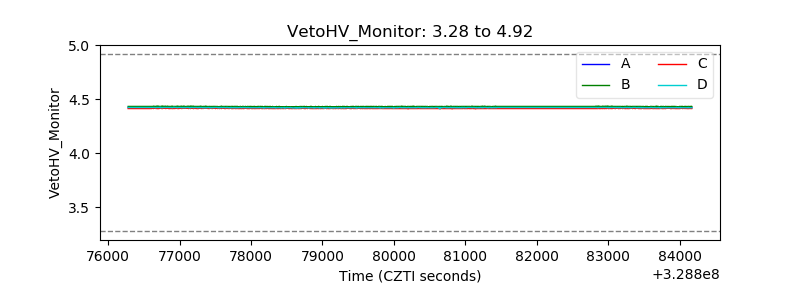 |
| Veto LLD |  |
| Alpha Counter | 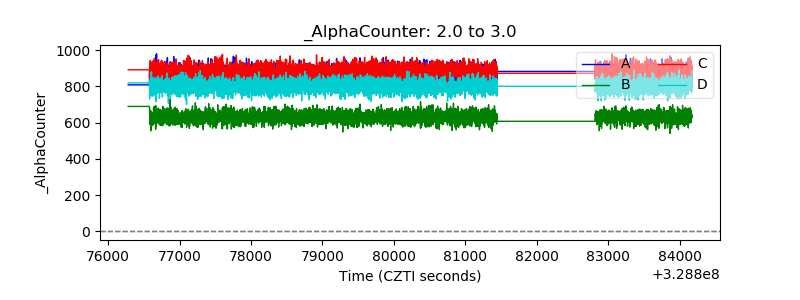 |
| _CPM_Rate | 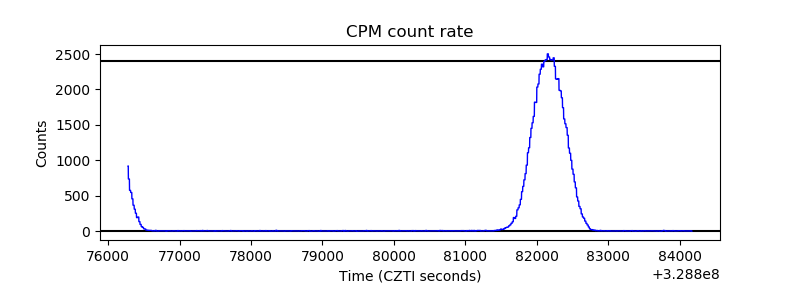 |
| CZT Counter | 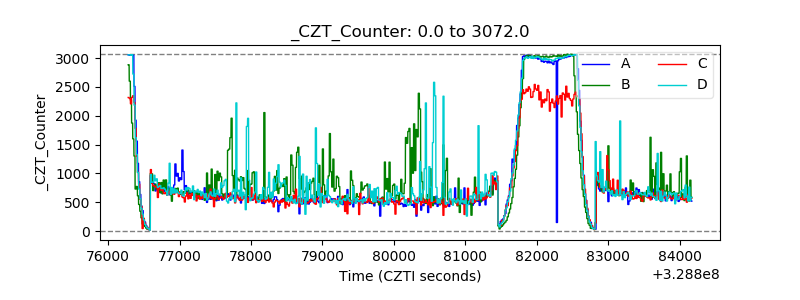 |
| +2.5 Volts monitor |  |
| +5 Volts monitor |  |
| _ROLL_ROT |  |
| _Roll_DEC | 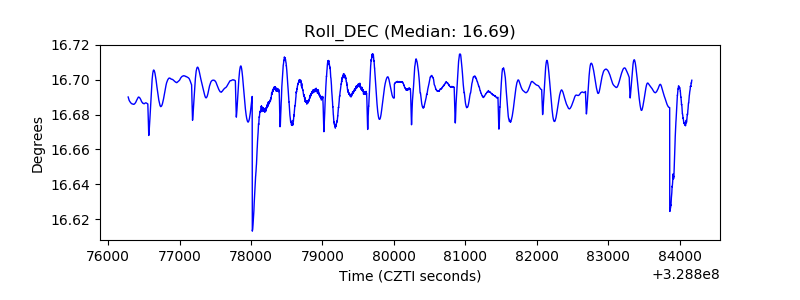 |
| _Roll_RA | 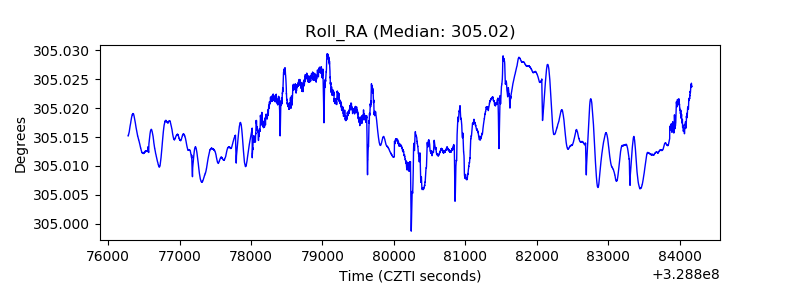 |
| Veto Counter |  |