| Param | Original file | Final file |
|---|---|---|
| Filename | modeM0/AS1A07_059T07_9000003704_25318cztM0_level2.evt | modeM0/AS1A07_059T07_9000003704_25318cztM0_level2_quad_clean.evt |
| Size (bytes) | 197,930,880 | 16,332,480 |
| Size | 188.8 MB | 15.6 MB |
| Events in quadrant A | 1,289,703 | 85,230 |
| Events in quadrant B | 1,295,834 | 85,158 |
| Events in quadrant C | 1,315,682 | 79,287 |
| Events in quadrant D | 1,935,841 | 79,031 |
| Mode M9 | |||
|---|---|---|---|
| Quadrant | BADHDUFLAG | Total packets | Discarded packets |
| A | 0 | 5 | 0 |
| B | 0 | 6 | 0 |
| C | 0 | 6 | 0 |
| D | 0 | 6 | 0 |
| Mode M0 | |||
|---|---|---|---|
| Quadrant | BADHDUFLAG | Total packets | Discarded packets |
| A | 0 | 5210 | 0 |
| B | 0 | 5255 | 0 |
| C | 0 | 5316 | 0 |
| D | 0 | 7482 | 0 |
| Quadrant | Total seconds | Saturated seconds | Saturation percentage |
|---|---|---|---|
| A | 2287 | 5 | 0.218627% |
| B | 2287 | 10 | 0.437254% |
| C | 2287 | 29 | 1.268037% |
| D | 2287 | 33 | 1.442938% |
Noise dominated data is calculated using 1-second bins in cleaned event files. If a bin has >2000 counts, and if more than 50% of those come from <1% of pixels, then it is considered to be noise-dominated and hence unusable.
| Quadrant | # 1 sec bins | Bins with >0 counts | Bins with >2000 counts | High rate bins dominated by noise | Noise dominated (total time) | Noise dominated (detector-on time) | Marked lightcurve |
|---|---|---|---|---|---|---|---|
| A | 2287 | 2287 | 0 | 0 | 0.00% | 0.00% | 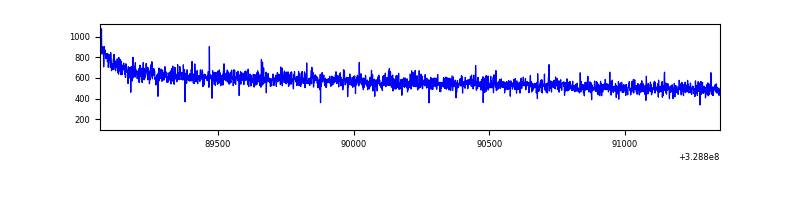 |
| B | 2287 | 2287 | 0 | 0 | 0.00% | 0.00% | 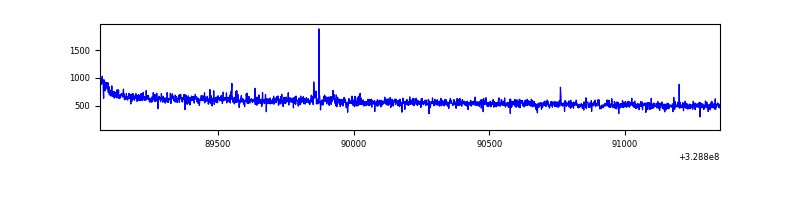 |
| C | 2287 | 2287 | 0 | 0 | 0.00% | 0.00% | 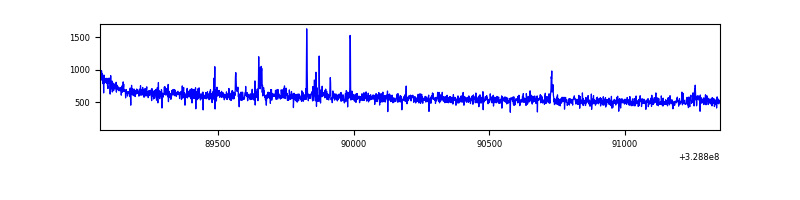 |
| D | 2287 | 2287 | 21 | 21 | 0.92% | 0.92% | 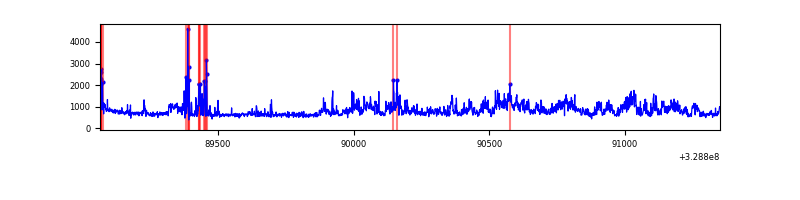 |
Top three noisy pixels from each quadrant. If the there are fewer than three noisy pixels in the level2.evt file, extra rows are filled as -1
| Pixel properties | Quadrant properties | ||||||
|---|---|---|---|---|---|---|---|
| Quadrant | DetID | PixID | Counts | Sigma | Mean | Median | Sigma |
| A | 13 | 254 | 3666 | 50.38 | 334 | 329 | 66.2 |
| A | 3 | 137 | 2908 | 38.93 | 334 | 329 | 66.2 |
| A | 0 | 226 | 2836 | 37.85 | 334 | 329 | 66.2 |
| B | 3 | 112 | 8643 | 133.1 | 329 | 324 | 62.5 |
| B | 12 | 111 | 7121 | 108.75 | 329 | 324 | 62.5 |
| B | 11 | 111 | 6535 | 99.37 | 329 | 324 | 62.5 |
| C | 14 | 238 | 52339 | 703.63 | 316 | 321 | 73.9 |
| C | 9 | 54 | 24610 | 328.55 | 316 | 321 | 73.9 |
| C | 3 | 233 | 4401 | 55.19 | 316 | 321 | 73.9 |
| D | 8 | 195 | 571506 | 7203.42 | 324 | 315 | 79.3 |
| D | 1 | 52 | 95004 | 1194.15 | 324 | 315 | 79.3 |
| D | 7 | 238 | 23604 | 293.7 | 324 | 315 | 79.3 |
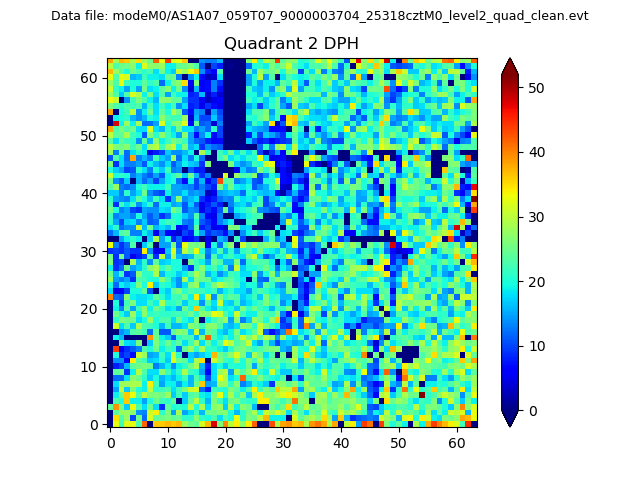
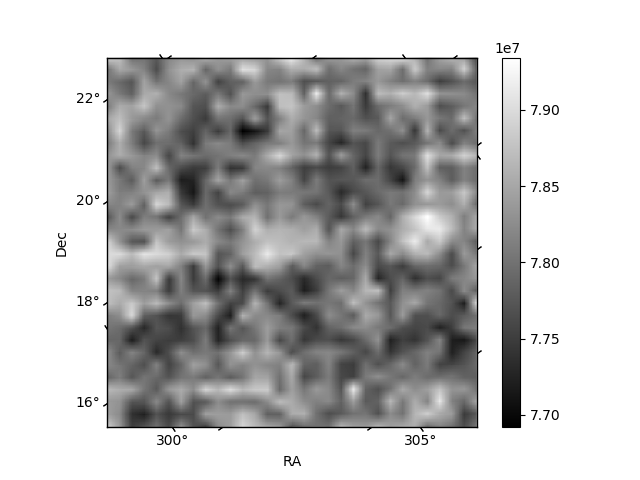
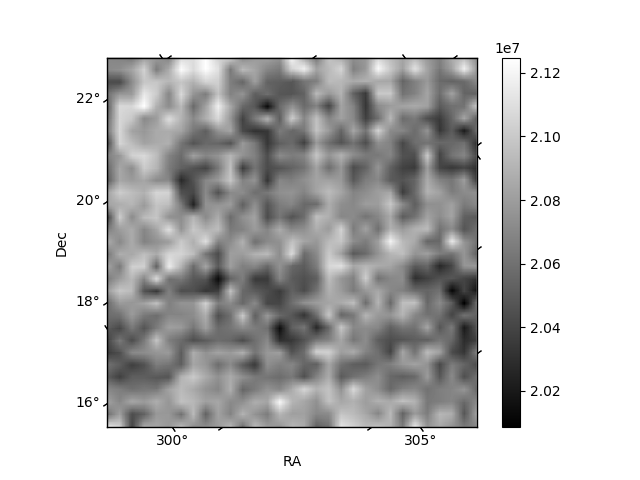
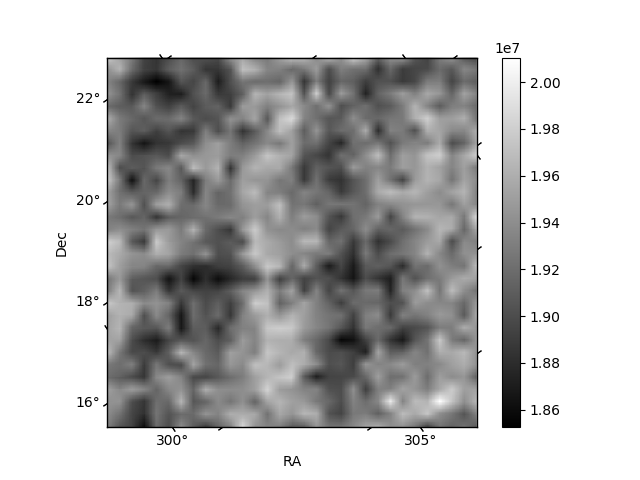
Histogram calculated using DETX and DETY for each event in the final _common_clean file
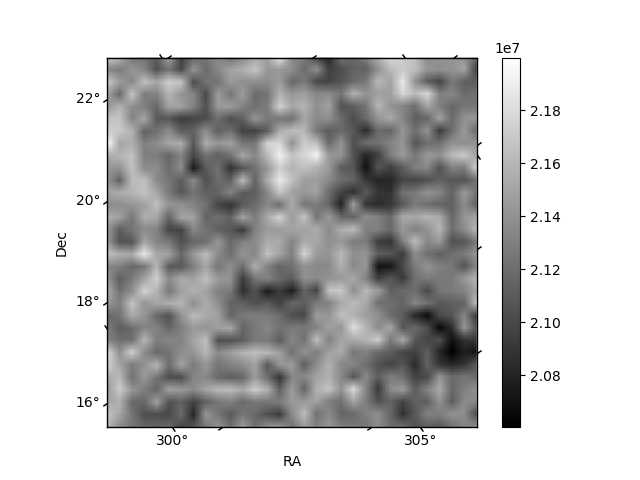
| Quadrant A | 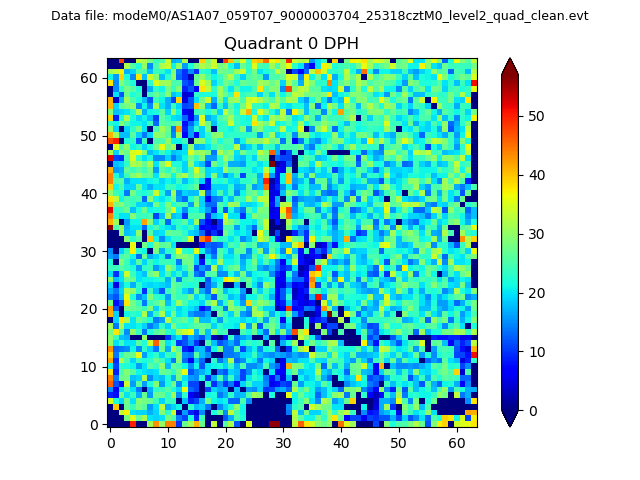 |
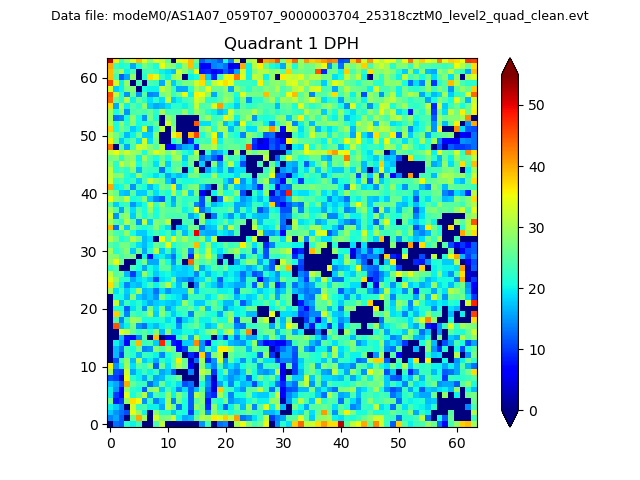 |
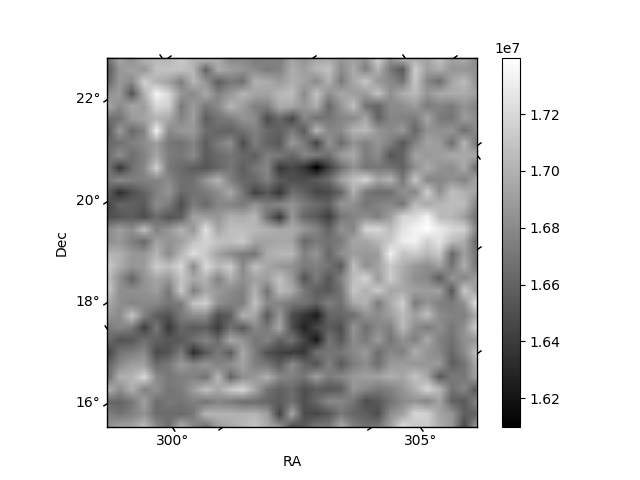
Quadrant B |
|---|---|---|---|
| Quadrant D | 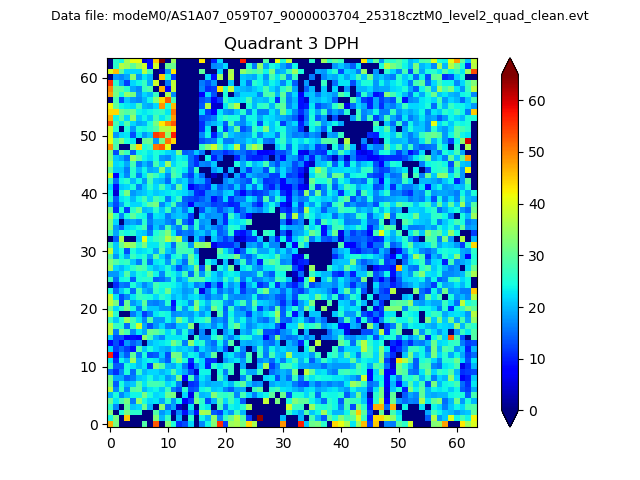 |
 |
Quadrant C |
| Plot type | Count rate plots | Images |
|---|---|---|
| Comparison with Poisson distribution Blue bars denote a histogram of data divided into 1 sec bins. Red curve is a Poisson curve with rate = median count rate of data. |
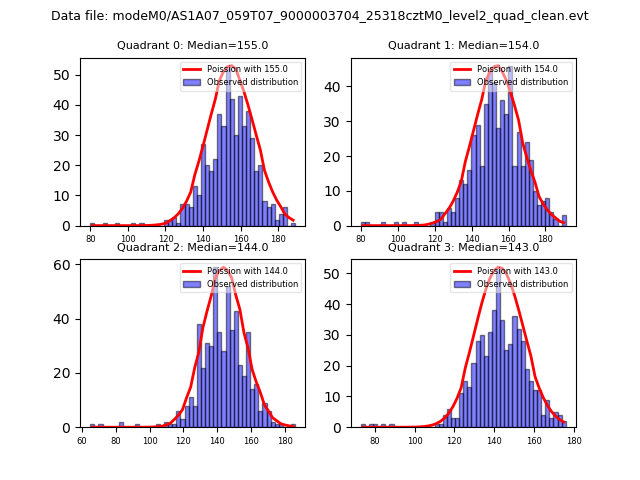 |
 |
| Quadrant-wise count rates Data is divided into 100 sec bins |
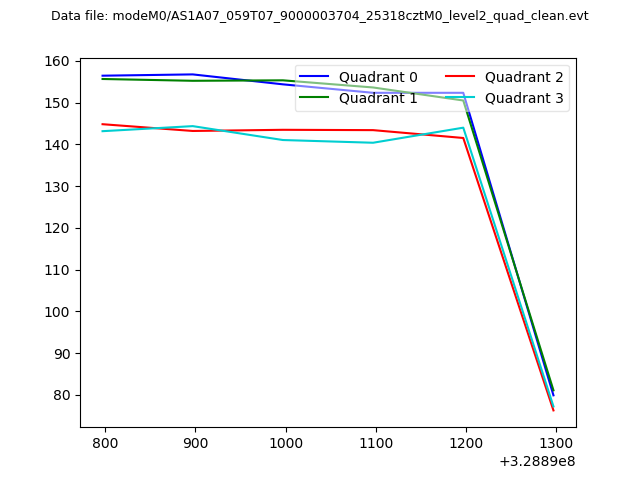 |
|
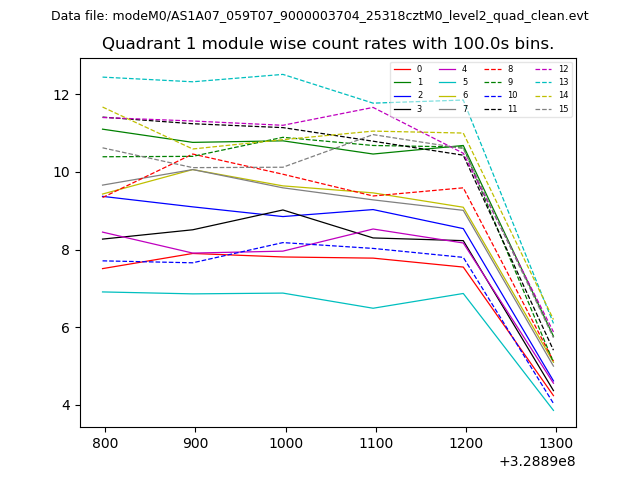
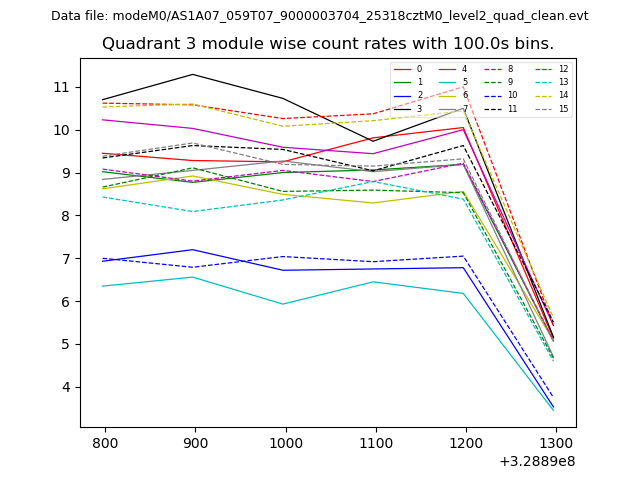
| Module-wise count rates for Quadrant A Data is divided into 100 sec bins |
 |
 |
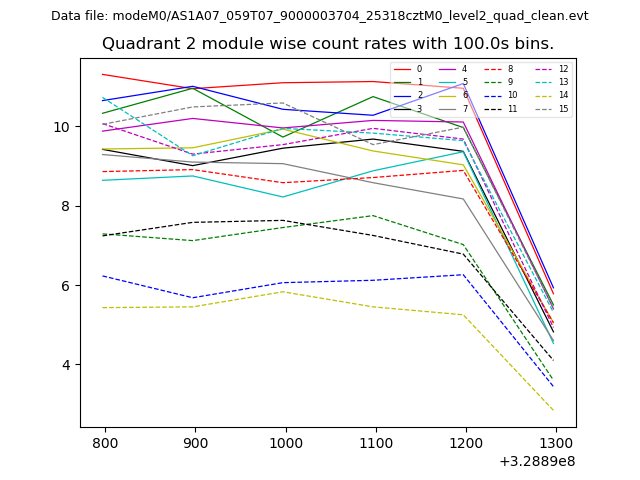
| Module-wise count rates for Quadrant B Data is divided into 100 sec bins |
 |
 |
| Module-wise count rates for Quadrant C Data is divided into 100 sec bins |
 |
 |
| Module-wise count rates for Quadrant D Data is divided into 100 sec bins |
 |
 |
| Parameter | Plot |
|---|---|
| CZT HV Monitor |  |
| D_VDD |  |
| Temperature 1 | 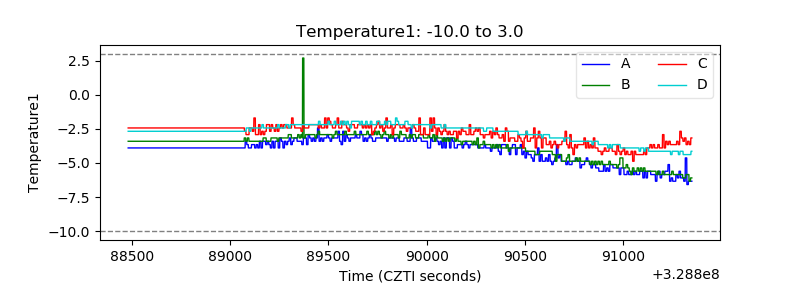 |
| Veto HV Monitor | 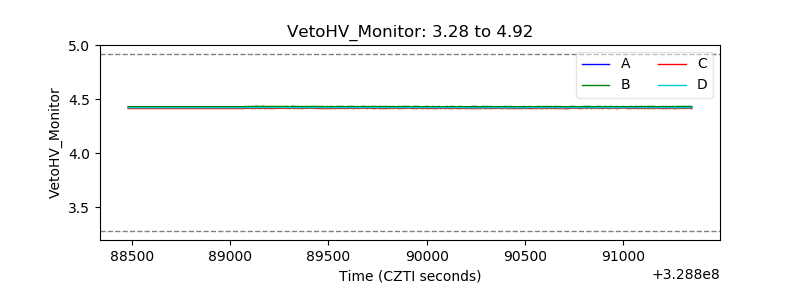 |
| Veto LLD |  |
| Alpha Counter | 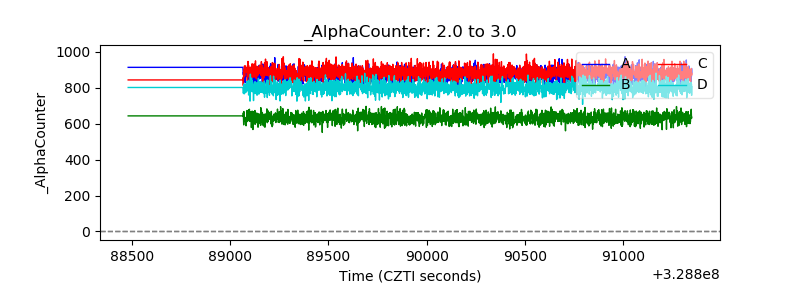 |
| _CPM_Rate | 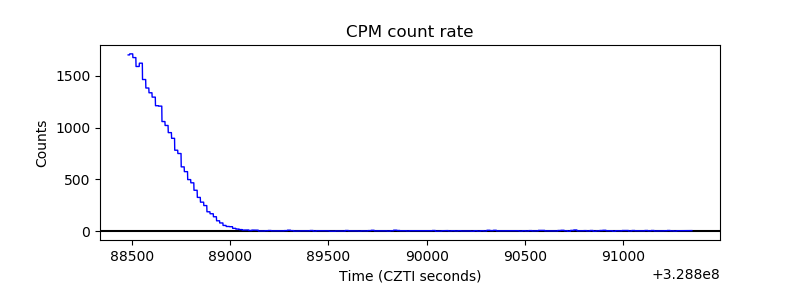 |
| CZT Counter | 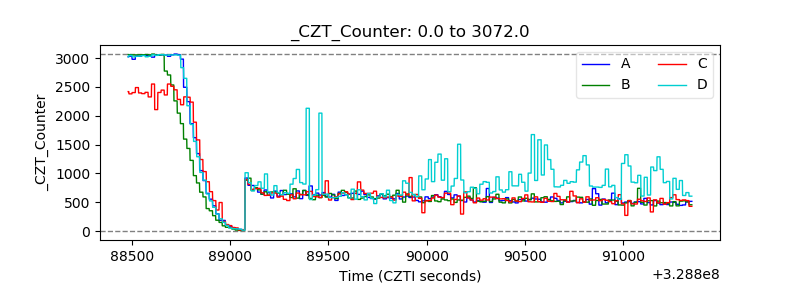 |
| +2.5 Volts monitor |  |
| +5 Volts monitor | 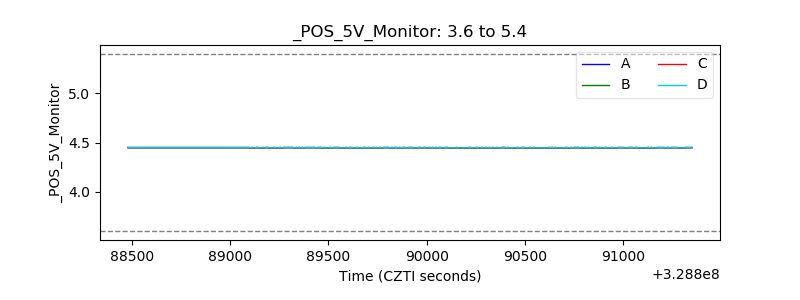 |
| _ROLL_ROT |  |
| _Roll_DEC | 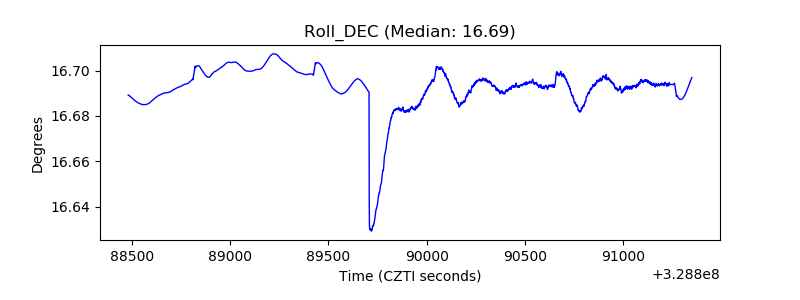 |
| _Roll_RA | 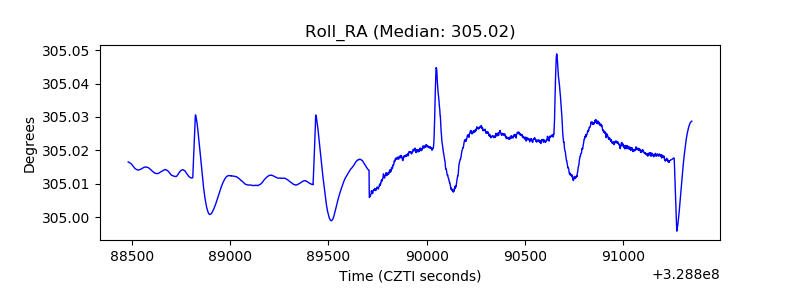 |
| Veto Counter |  |