| Param | Original file | Final file |
|---|---|---|
| Filename | modeM0/AS1A09_059T01_9000003706cztM0_level2.fits | modeM0/AS1A09_059T01_9000003706cztM0_level2_quad_clean.evt |
| Size (bytes) | 2,039,644,800 | 1,761,137,280 |
| Size | 1.9 GB | 1.6 GB |
| Events in quadrant A | 12,853,352 | 10,508,372 |
| Events in quadrant B | 12,174,010 | 10,424,353 |
| Events in quadrant C | 12,217,700 | 9,748,785 |
| Events in quadrant D | 10,641,112 | 8,770,185 |
| Mode SS | |||
|---|---|---|---|
| Quadrant | BADHDUFLAG | Total packets | Discarded packets |
| A | 0 | 4132 | 0 |
| B | 0 | 4132 | 0 |
| C | 0 | 4132 | 0 |
| D | 0 | 4132 | 0 |
| Mode M0 | |||
|---|---|---|---|
| Quadrant | BADHDUFLAG | Total packets | Discarded packets |
| A | 0 | 445341 | 0 |
| B | 0 | 430487 | 0 |
| C | 0 | 465047 | 0 |
| D | 0 | 605898 | 0 |
| Mode M9 | |||
|---|---|---|---|
| Quadrant | BADHDUFLAG | Total packets | Discarded packets |
| A | 0 | 306 | 0 |
| B | 0 | 306 | 0 |
| C | 0 | 306 | 0 |
| D | 0 | 306 | 0 |
| Quadrant | Total seconds | Saturated seconds | Saturation percentage |
|---|---|---|---|
| A | 202635 | 2109 | 1.040788% |
| B | 202634 | 2592 | 1.279154% |
| C | 202633 | 6608 | 3.261068% |
| D | 202632 | 10849 | 5.354041% |
Noise dominated data is calculated using 1-second bins in cleaned event files. If a bin has >2000 counts, and if more than 50% of those come from <1% of pixels, then it is considered to be noise-dominated and hence unusable.
| Quadrant | # 1 sec bins | Bins with >0 counts | Bins with >2000 counts | High rate bins dominated by noise | Noise dominated (total time) | Noise dominated (detector-on time) | Marked lightcurve |
|---|---|---|---|---|---|---|---|
| A | 233455 | 202621 | 0 | 0 | 0.00% | 0.00% | 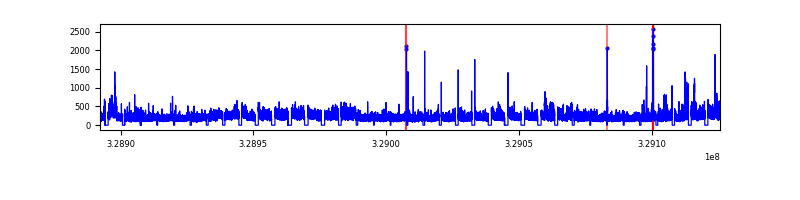 |
| B | 233455 | 202624 | 0 | 0 | 0.00% | 0.00% |  |
| C | 233455 | 202613 | 0 | 0 | 0.00% | 0.00% |  |
| D | 233455 | 202549 | 0 | 0 | 0.00% | 0.00% | 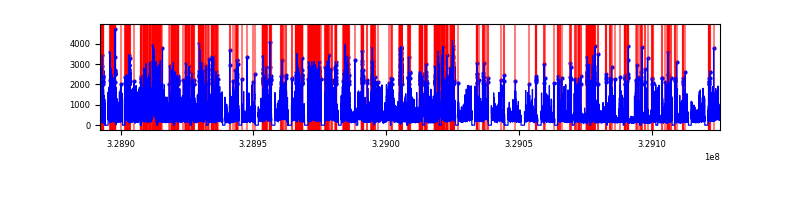 |
Top three noisy pixels from each quadrant. If the there are fewer than three noisy pixels in the level2.evt file, extra rows are filled as -1
| Pixel properties | Quadrant properties | ||||||
|---|---|---|---|---|---|---|---|
| Quadrant | DetID | PixID | Counts | Sigma | Mean | Median | Sigma |
| A | 0 | 29 | 12314 | 11.28 | 3349 | 3153 | 811.8 |
| A | 7 | 110 | 10226 | 8.71 | 3349 | 3153 | 811.8 |
| A | 0 | 30 | 9711 | 8.08 | 3349 | 3153 | 811.8 |
| B | 2 | 9 | 9559 | 10.47 | 3223 | 3087 | 618.1 |
| B | 2 | 8 | 8109 | 8.12 | 3223 | 3087 | 618.1 |
| B | 3 | 17 | 7950 | 7.87 | 3223 | 3087 | 618.1 |
| C | 1 | 80 | 9369 | 7.83 | 3228 | 3034 | 809.5 |
| C | 1 | 81 | 9282 | 7.72 | 3228 | 3034 | 809.5 |
| C | 12 | 241 | 8482 | 6.73 | 3228 | 3034 | 809.5 |
| D | 6 | 231 | 7505 | 5.93 | 3041 | 2781 | 797.1 |
| D | 7 | 3 | 7457 | 5.87 | 3041 | 2781 | 797.1 |
| D | 3 | 14 | 7388 | 5.78 | 3041 | 2781 | 797.1 |
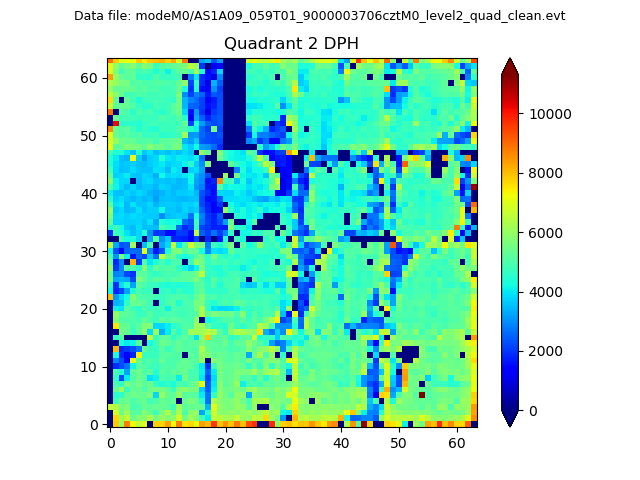
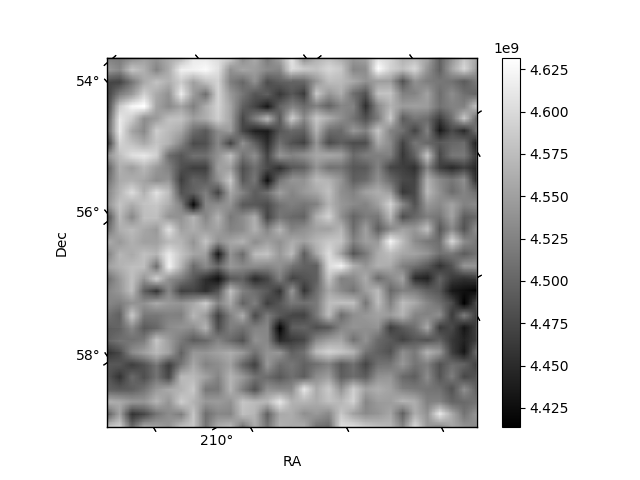
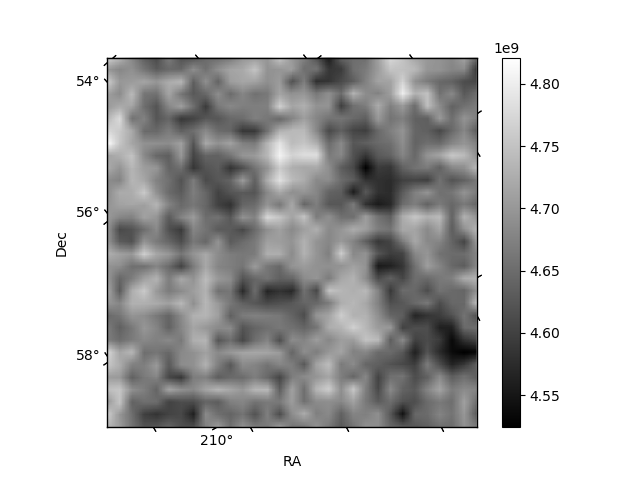
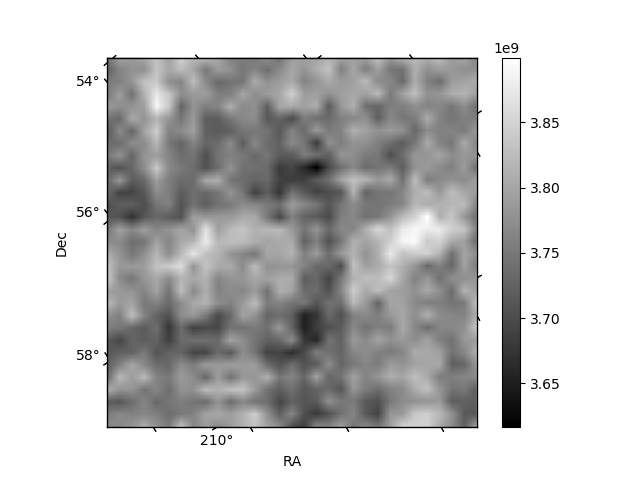
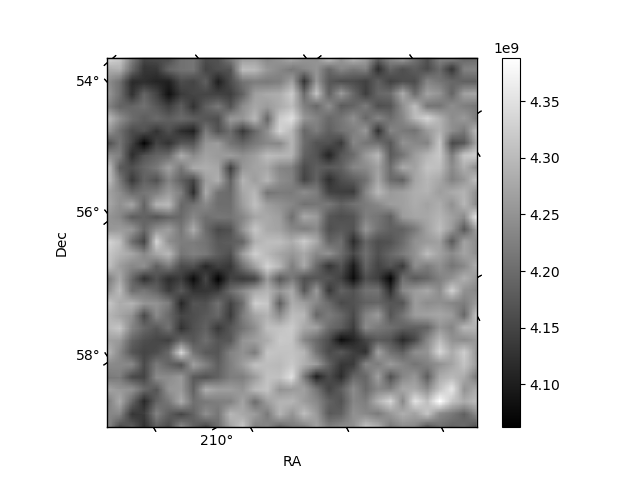
Histogram calculated using DETX and DETY for each event in the final _common_clean file
| Quadrant A | 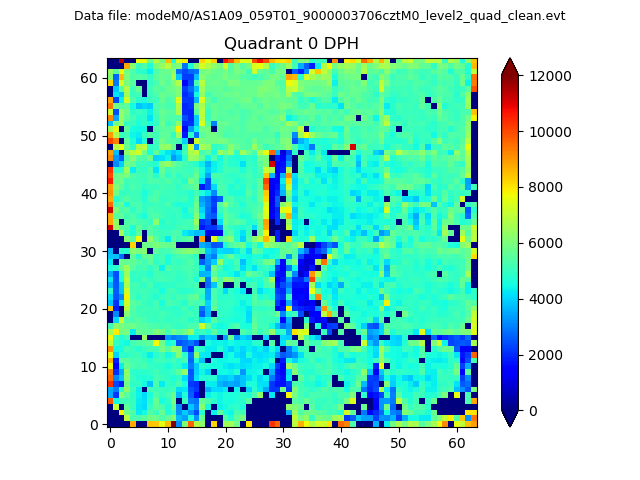 |
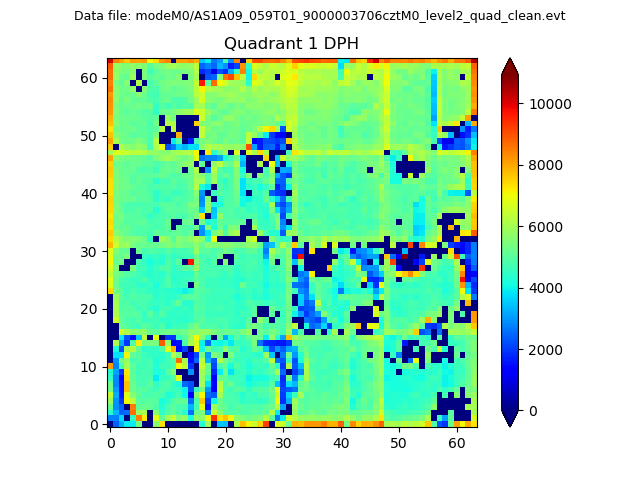 |
Quadrant B |
|---|---|---|---|
| Quadrant D | 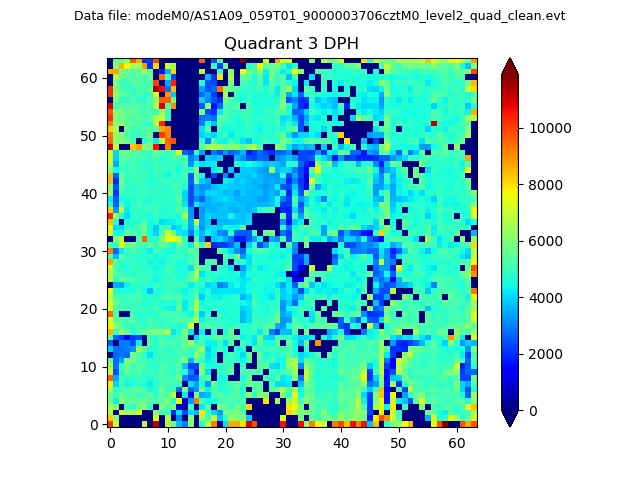 |
 |
Quadrant C |
| Plot type | Count rate plots | Images |
|---|---|---|
| Comparison with Poisson distribution Blue bars denote a histogram of data divided into 1 sec bins. Red curve is a Poisson curve with rate = median count rate of data. |
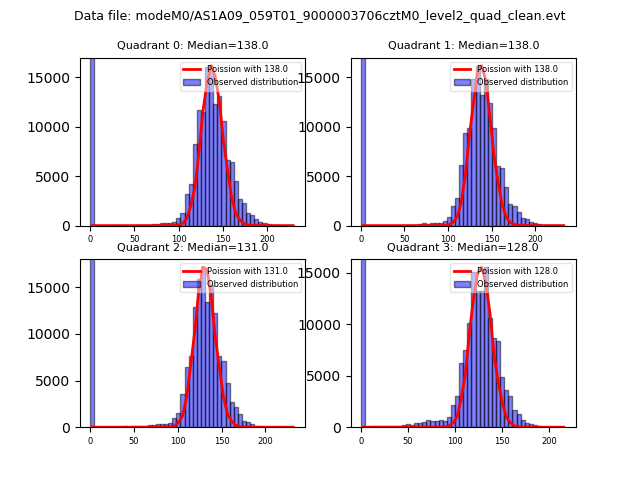 |
 |
| Quadrant-wise count rates Data is divided into 100 sec bins |
 |
|
| Module-wise count rates for Quadrant A Data is divided into 100 sec bins |
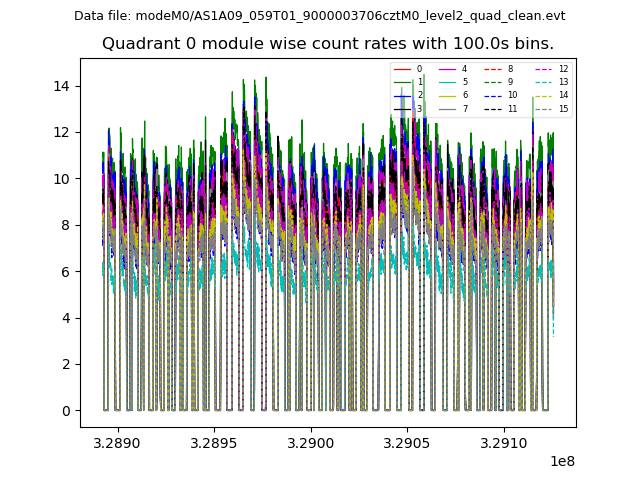 |
 |
| Module-wise count rates for Quadrant B Data is divided into 100 sec bins |
 |
 |
| Module-wise count rates for Quadrant C Data is divided into 100 sec bins |
 |
 |
| Module-wise count rates for Quadrant D Data is divided into 100 sec bins |
 |
 |
| Parameter | Plot |
|---|---|
| CZT HV Monitor | 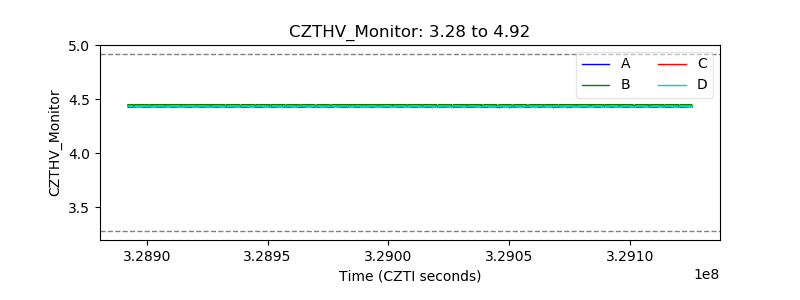 |
| D_VDD | 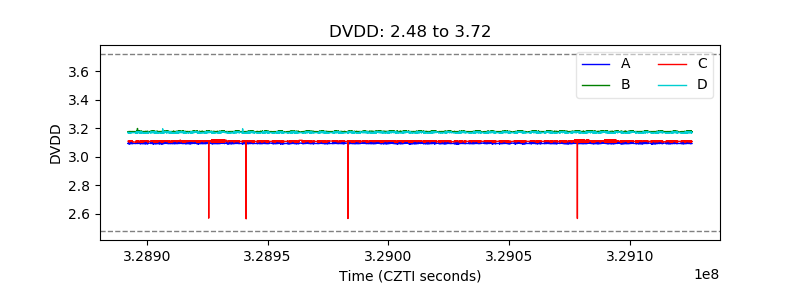 |
| Temperature 1 | 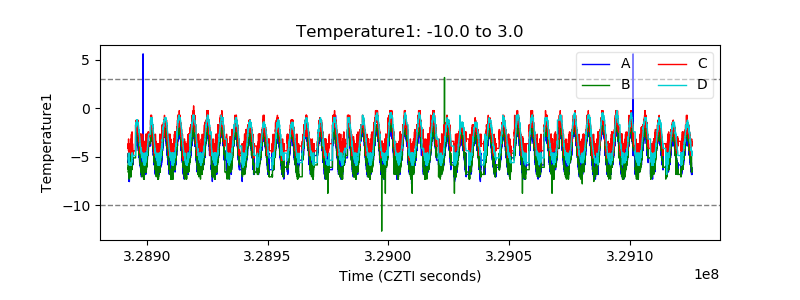 |
| Veto HV Monitor |  |
| Veto LLD | 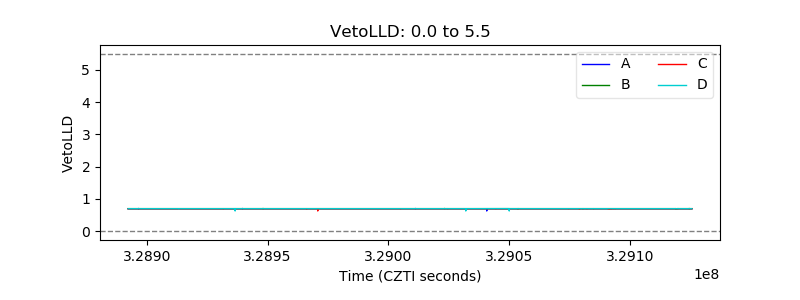 |
| Alpha Counter | 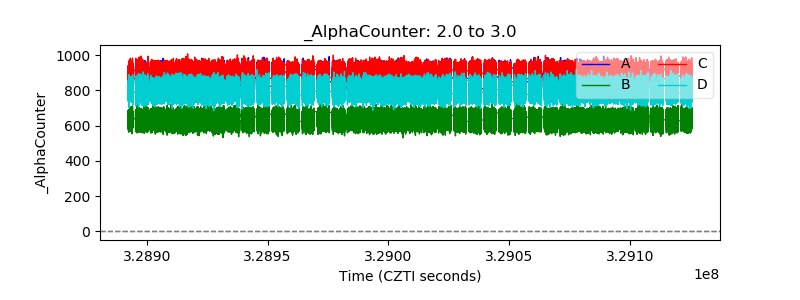 |
| _CPM_Rate |  |
| CZT Counter | 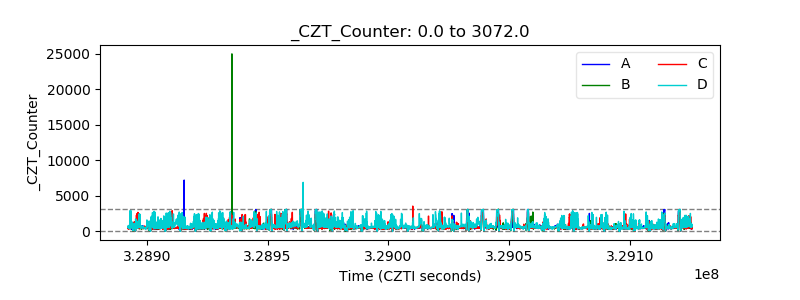 |
| +2.5 Volts monitor |  |
| +5 Volts monitor |  |
| _ROLL_ROT | 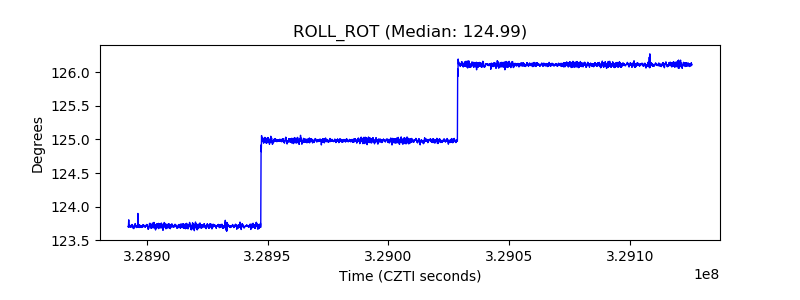 |
| _Roll_DEC | 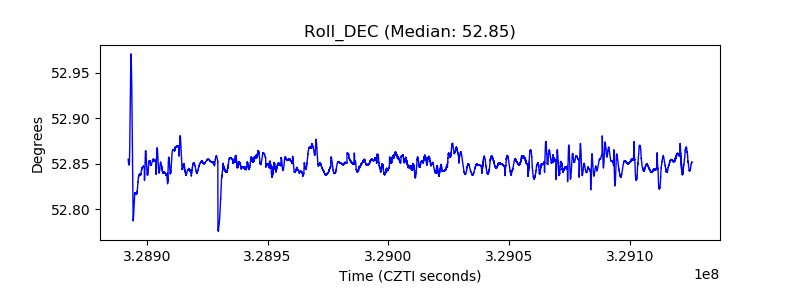 |
| _Roll_RA | 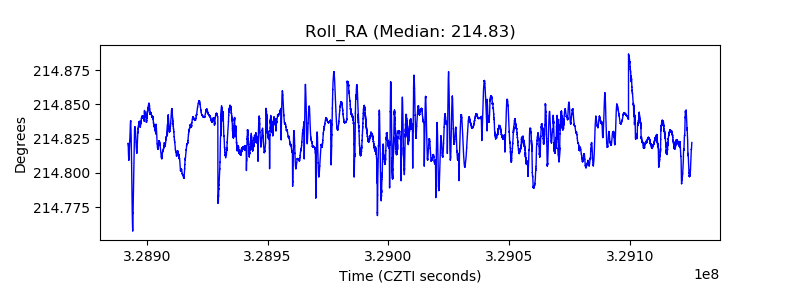 |
| Veto Counter | 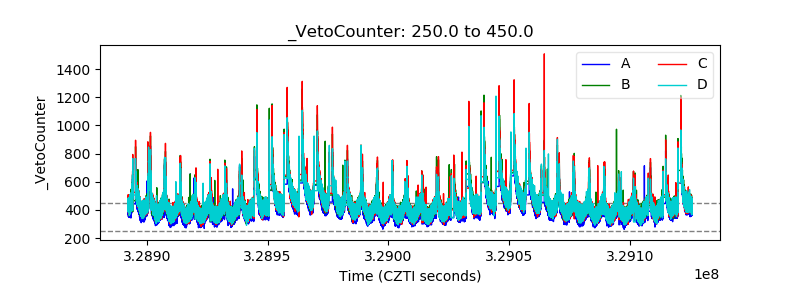 |