| Param | Original file | Final file |
|---|---|---|
| Filename | modeM0/AS1A09_059T01_9000003706_25318cztM0_level2.evt | modeM0/AS1A09_059T01_9000003706_25318cztM0_level2_quad_clean.evt |
| Size (bytes) | 289,618,560 | 47,787,840 |
| Size | 276.2 MB | 45.6 MB |
| Events in quadrant A | 1,982,496 | 312,519 |
| Events in quadrant B | 1,758,984 | 317,422 |
| Events in quadrant C | 2,252,550 | 290,641 |
| Events in quadrant D | 2,556,750 | 297,059 |
| Mode M0 | |||
|---|---|---|---|
| Quadrant | BADHDUFLAG | Total packets | Discarded packets |
| A | 0 | 7941 | 0 |
| B | 0 | 7229 | 0 |
| C | 0 | 8746 | 0 |
| D | 0 | 9810 | 0 |
| Mode M9 | |||
|---|---|---|---|
| Quadrant | BADHDUFLAG | Total packets | Discarded packets |
| A | 0 | 12 | 0 |
| B | 0 | 12 | 0 |
| C | 0 | 12 | 0 |
| D | 0 | 12 | 0 |
| Quadrant | Total seconds | Saturated seconds | Saturation percentage |
|---|---|---|---|
| A | 3225 | 90 | 2.790698% |
| B | 3225 | 87 | 2.697674% |
| C | 3224 | 322 | 9.987593% |
| D | 3224 | 217 | 6.730769% |
Noise dominated data is calculated using 1-second bins in cleaned event files. If a bin has >2000 counts, and if more than 50% of those come from <1% of pixels, then it is considered to be noise-dominated and hence unusable.
| Quadrant | # 1 sec bins | Bins with >0 counts | Bins with >2000 counts | High rate bins dominated by noise | Noise dominated (total time) | Noise dominated (detector-on time) | Marked lightcurve |
|---|---|---|---|---|---|---|---|
| A | 4400 | 3227 | 0 | 0 | 0.00% | 0.00% | 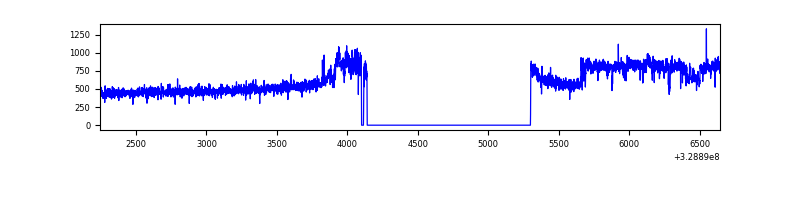 |
| B | 4400 | 3227 | 2 | 2 | 0.05% | 0.06% | 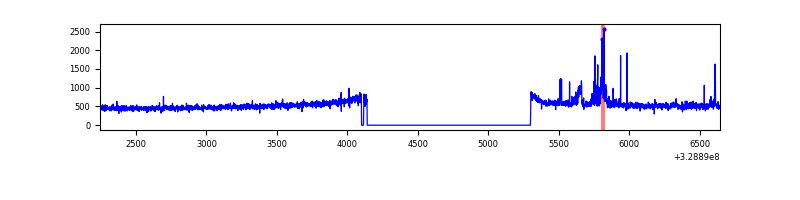 |
| C | 4399 | 3226 | 126 | 126 | 2.86% | 3.91% | 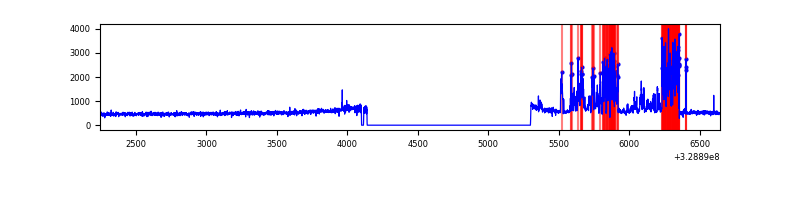 |
| D | 4399 | 3226 | 130 | 130 | 2.96% | 4.03% |  |
Top three noisy pixels from each quadrant. If the there are fewer than three noisy pixels in the level2.evt file, extra rows are filled as -1
| Pixel properties | Quadrant properties | ||||||
|---|---|---|---|---|---|---|---|
| Quadrant | DetID | PixID | Counts | Sigma | Mean | Median | Sigma |
| A | 15 | 173 | 257264 | 2949.01 | 432 | 424 | 87.1 |
| A | 6 | 16 | 57571 | 656.16 | 432 | 424 | 87.1 |
| A | 13 | 254 | 5407 | 57.21 | 432 | 424 | 87.1 |
| B | 0 | 190 | 41118 | 498.75 | 427 | 416 | 81.6 |
| B | 15 | 32 | 35064 | 424.57 | 427 | 416 | 81.6 |
| B | 12 | 111 | 9788 | 114.84 | 427 | 416 | 81.6 |
| C | 9 | 54 | 604948 | 6376.26 | 404 | 407 | 94.8 |
| C | 14 | 238 | 64775 | 678.91 | 404 | 407 | 94.8 |
| C | 2 | 16 | 6354 | 62.72 | 404 | 407 | 94.8 |
| D | 8 | 195 | 380407 | 3791.77 | 412 | 401 | 100.2 |
| D | 1 | 52 | 215601 | 2147.31 | 412 | 401 | 100.2 |
| D | 7 | 238 | 210274 | 2094.15 | 412 | 401 | 100.2 |
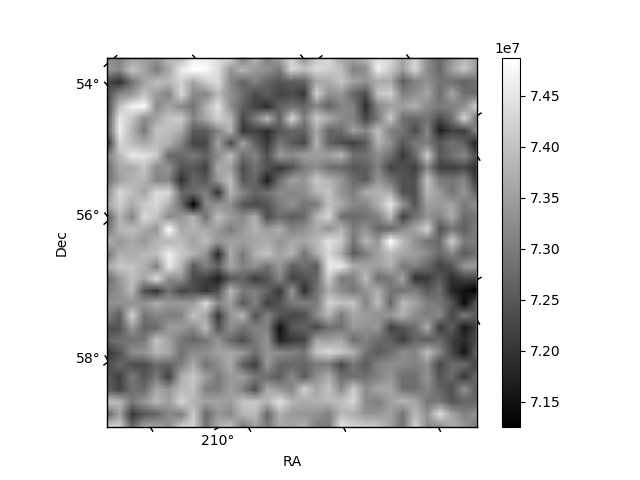
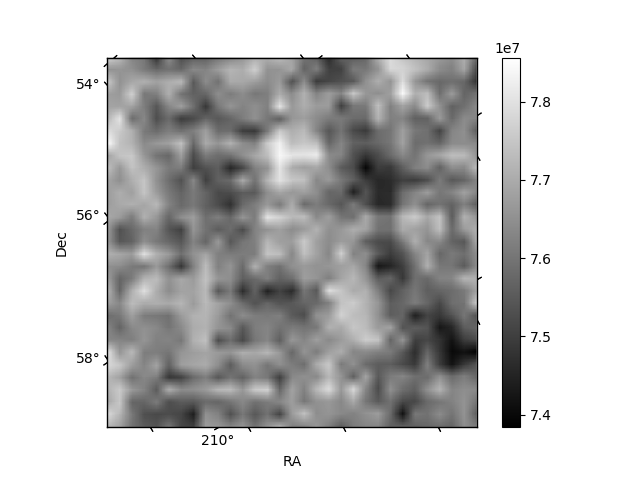
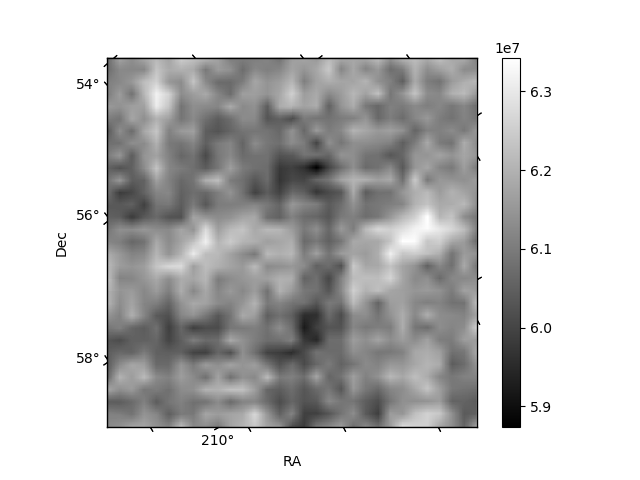
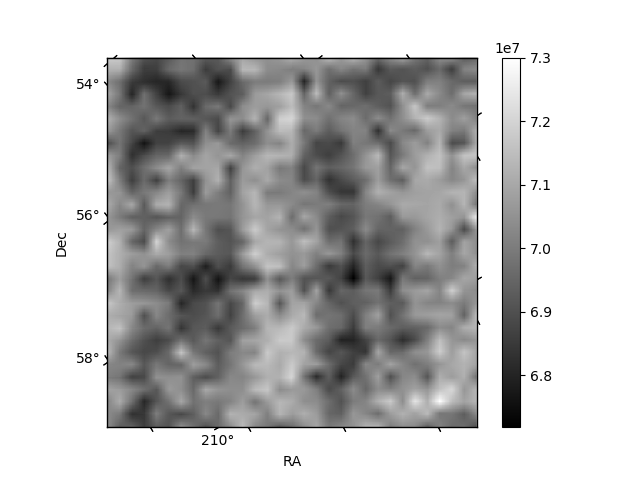
Histogram calculated using DETX and DETY for each event in the final _common_clean file
| Quadrant A | 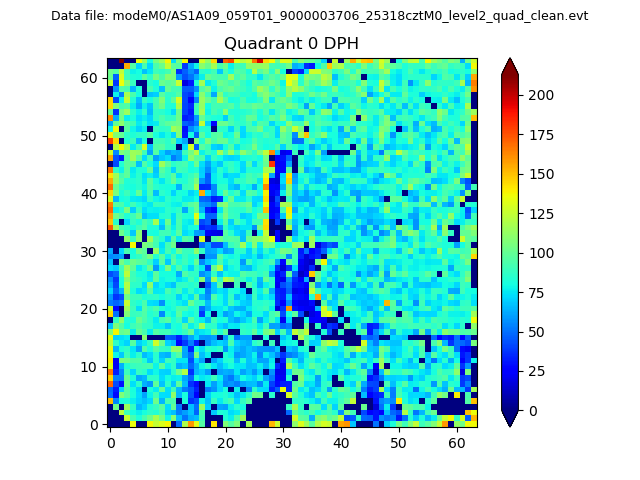 |
 |
Quadrant B |
|---|---|---|---|
| Quadrant D | 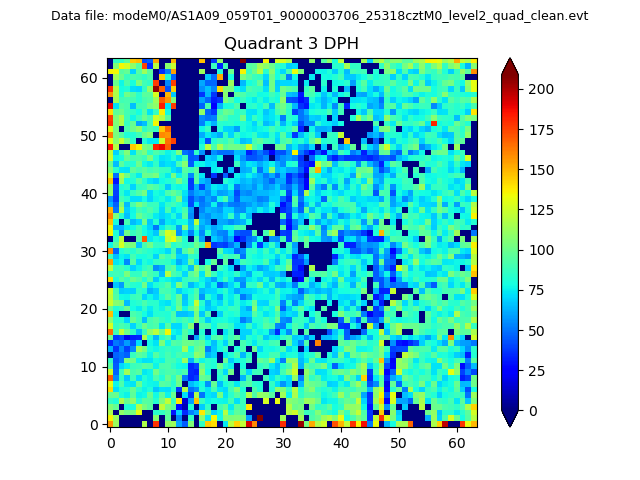 |
 |
Quadrant C |
| Plot type | Count rate plots | Images |
|---|---|---|
| Comparison with Poisson distribution Blue bars denote a histogram of data divided into 1 sec bins. Red curve is a Poisson curve with rate = median count rate of data. |
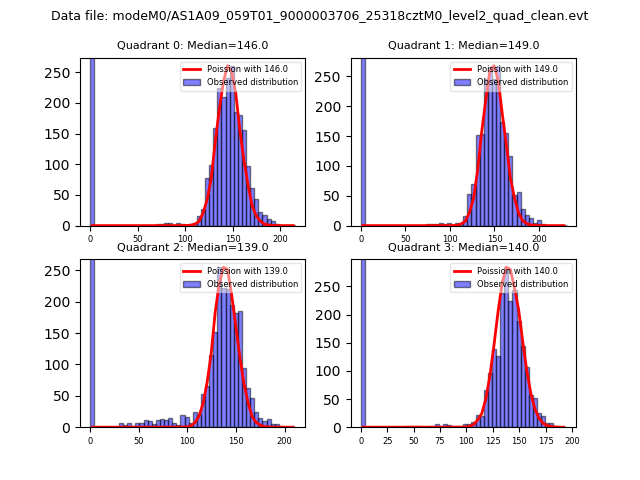 |
 |
| Quadrant-wise count rates Data is divided into 100 sec bins |
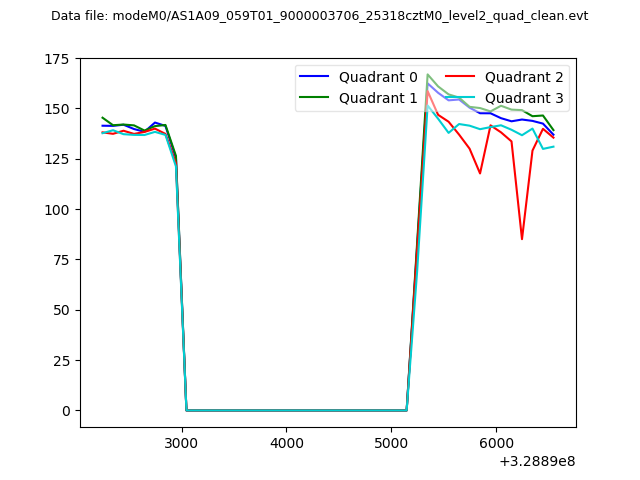 |
|
| Module-wise count rates for Quadrant A Data is divided into 100 sec bins |
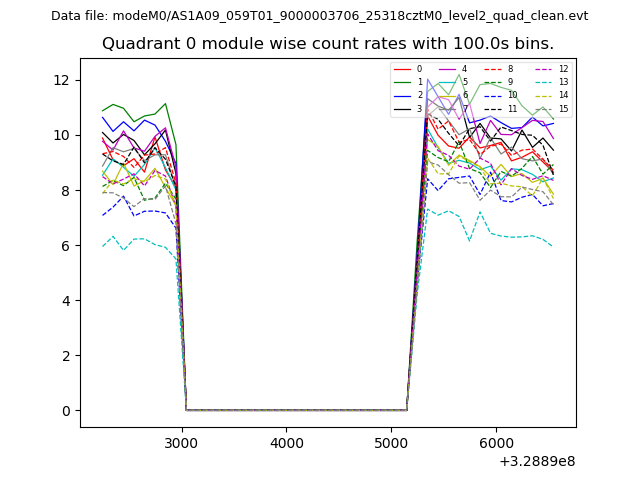 |
 |
| Module-wise count rates for Quadrant B Data is divided into 100 sec bins |
 |
 |
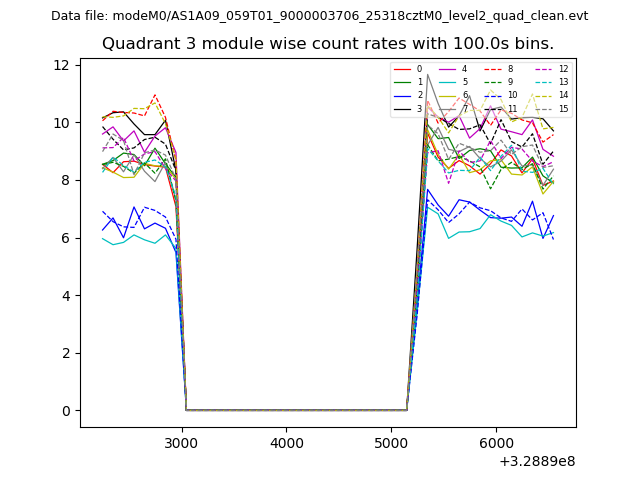
| Module-wise count rates for Quadrant C Data is divided into 100 sec bins |
 |
 |
| Module-wise count rates for Quadrant D Data is divided into 100 sec bins |
 |
 |
| Parameter | Plot |
|---|---|
| CZT HV Monitor |  |
| D_VDD | 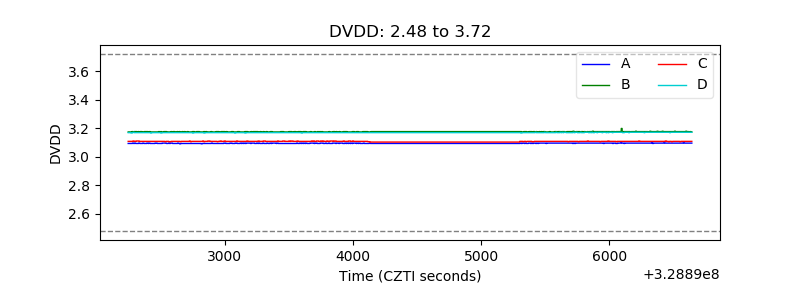 |
| Temperature 1 | 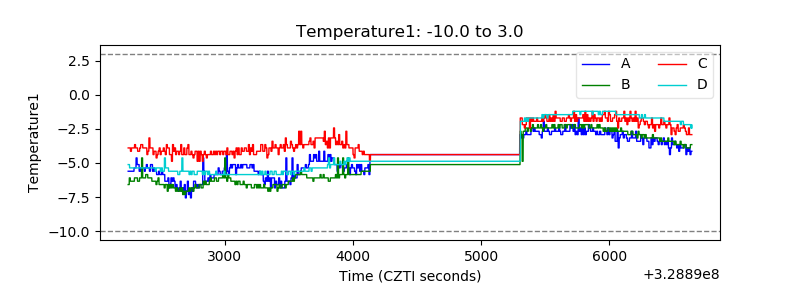 |
| Veto HV Monitor | 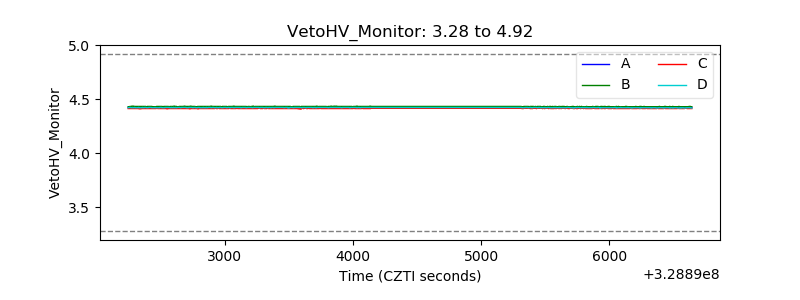 |
| Veto LLD | 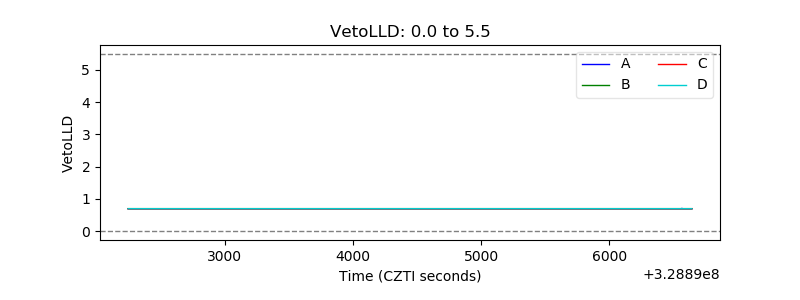 |
| Alpha Counter |  |
| _CPM_Rate | 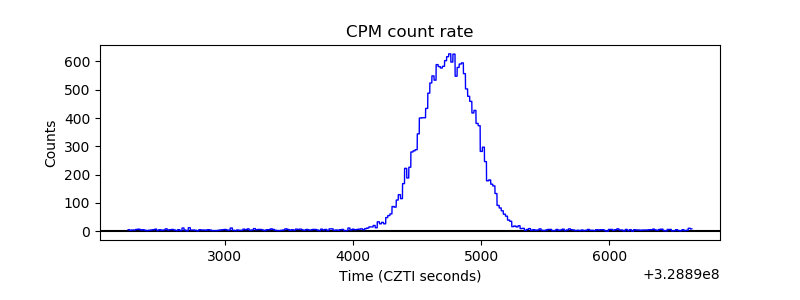 |
| CZT Counter |  |
| +2.5 Volts monitor |  |
| +5 Volts monitor |  |
| _ROLL_ROT | 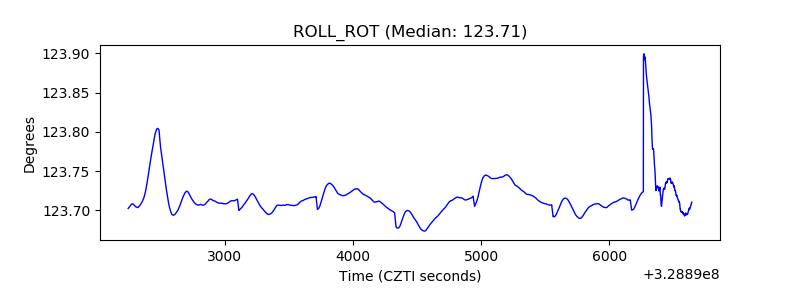 |
| _Roll_DEC | 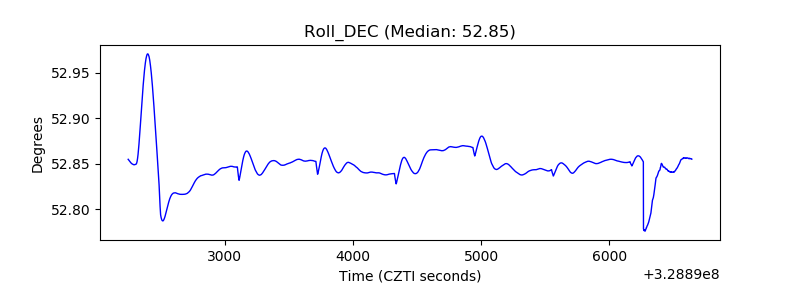 |
| _Roll_RA | 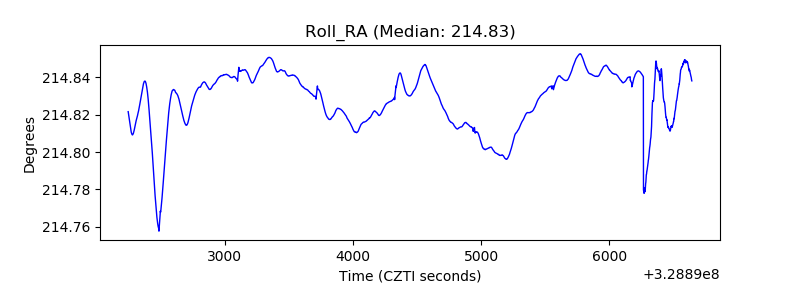 |
| Veto Counter | 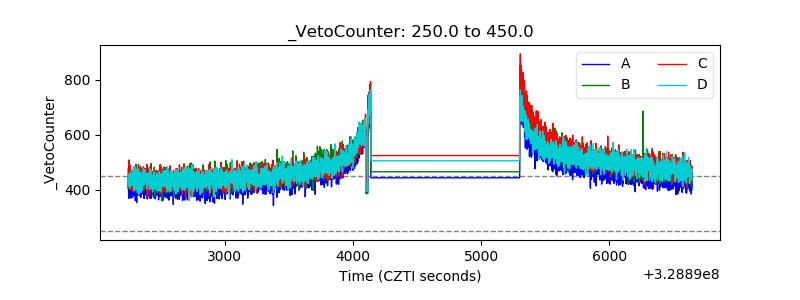 |