| Param | Original file | Final file |
|---|---|---|
| Filename | modeM0/AS1A09_059T01_9000003706_25319cztM0_level2.evt | modeM0/AS1A09_059T01_9000003706_25319cztM0_level2_quad_clean.evt |
| Size (bytes) | 582,192,000 | 100,226,880 |
| Size | 555.2 MB | 95.6 MB |
| Events in quadrant A | 3,961,531 | 665,086 |
| Events in quadrant B | 3,318,631 | 671,776 |
| Events in quadrant C | 3,873,145 | 631,386 |
| Events in quadrant D | 6,029,756 | 604,835 |
| Mode M0 | |||
|---|---|---|---|
| Quadrant | BADHDUFLAG | Total packets | Discarded packets |
| A | 0 | 16279 | 0 |
| B | 0 | 14028 | 0 |
| C | 0 | 15641 | 0 |
| D | 0 | 22379 | 0 |
| Mode M9 | |||
|---|---|---|---|
| Quadrant | BADHDUFLAG | Total packets | Discarded packets |
| A | 0 | 7 | 0 |
| B | 0 | 7 | 0 |
| C | 0 | 7 | 0 |
| D | 0 | 7 | 0 |
| Quadrant | Total seconds | Saturated seconds | Saturation percentage |
|---|---|---|---|
| A | 6620 | 69 | 1.042296% |
| B | 6620 | 99 | 1.495468% |
| C | 6621 | 343 | 5.180486% |
| D | 6620 | 616 | 9.305136% |
Noise dominated data is calculated using 1-second bins in cleaned event files. If a bin has >2000 counts, and if more than 50% of those come from <1% of pixels, then it is considered to be noise-dominated and hence unusable.
| Quadrant | # 1 sec bins | Bins with >0 counts | Bins with >2000 counts | High rate bins dominated by noise | Noise dominated (total time) | Noise dominated (detector-on time) | Marked lightcurve |
|---|---|---|---|---|---|---|---|
| A | 7420 | 6622 | 0 | 0 | 0.00% | 0.00% | 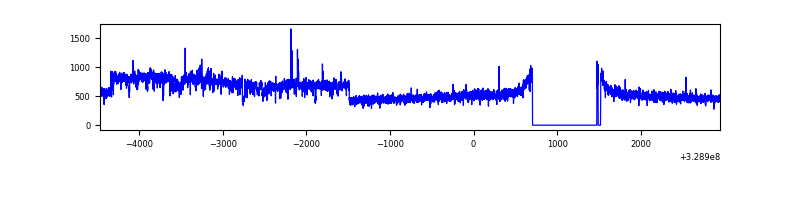 |
| B | 7420 | 6622 | 3 | 3 | 0.04% | 0.05% | 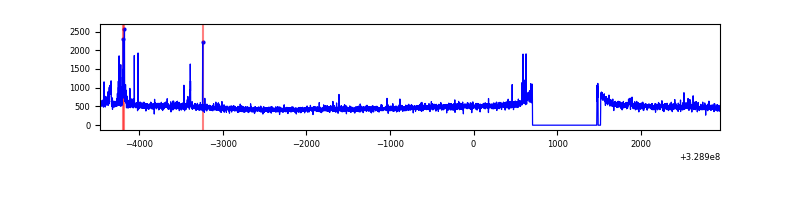 |
| C | 7421 | 6623 | 125 | 125 | 1.68% | 1.89% | 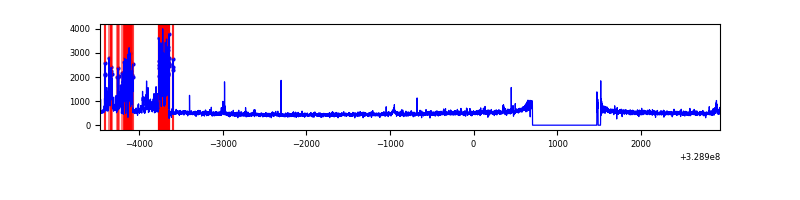 |
| D | 7420 | 6622 | 413 | 413 | 5.57% | 6.24% | 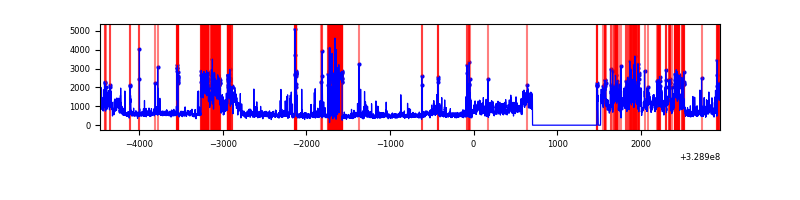 |
Top three noisy pixels from each quadrant. If the there are fewer than three noisy pixels in the level2.evt file, extra rows are filled as -1
| Pixel properties | Quadrant properties | ||||||
|---|---|---|---|---|---|---|---|
| Quadrant | DetID | PixID | Counts | Sigma | Mean | Median | Sigma |
| A | 15 | 173 | 734727 | 4453.23 | 828 | 813 | 164.8 |
| A | 6 | 16 | 19073 | 110.8 | 828 | 813 | 164.8 |
| A | 4 | 2 | 11505 | 64.88 | 828 | 813 | 164.8 |
| B | 15 | 32 | 44293 | 280.15 | 820 | 801 | 155.2 |
| B | 0 | 190 | 40868 | 258.09 | 820 | 801 | 155.2 |
| B | 12 | 111 | 18703 | 115.31 | 820 | 801 | 155.2 |
| C | 9 | 54 | 639199 | 3468.11 | 792 | 796 | 184.1 |
| C | 14 | 238 | 127029 | 685.76 | 792 | 796 | 184.1 |
| C | 3 | 233 | 11589 | 58.63 | 792 | 796 | 184.1 |
| D | 8 | 195 | 1867273 | 9796.4 | 791 | 770 | 190.5 |
| D | 1 | 52 | 535270 | 2805.34 | 791 | 770 | 190.5 |
| D | 7 | 238 | 421996 | 2210.82 | 791 | 770 | 190.5 |
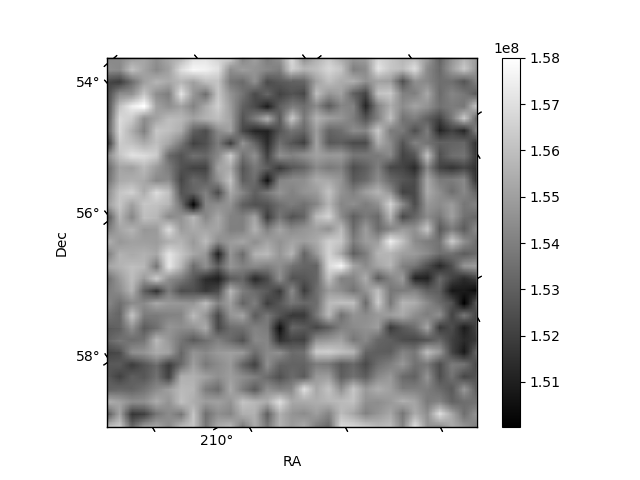
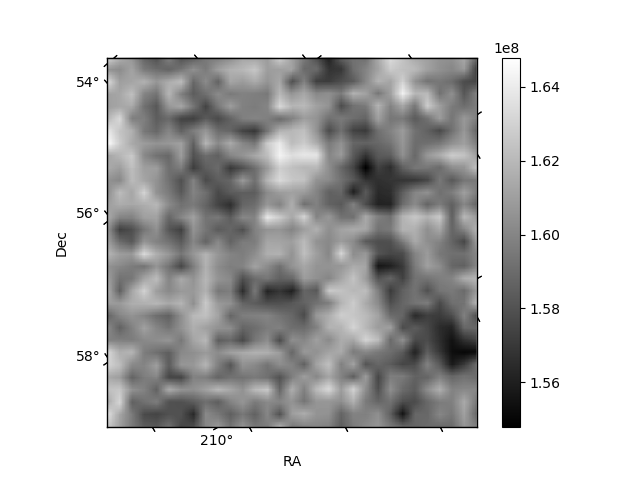
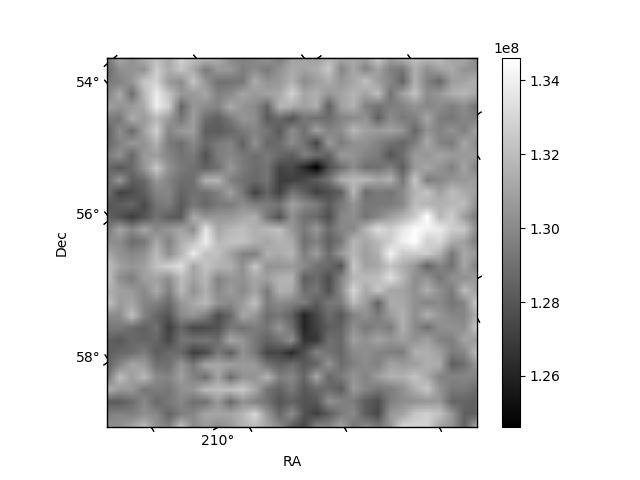
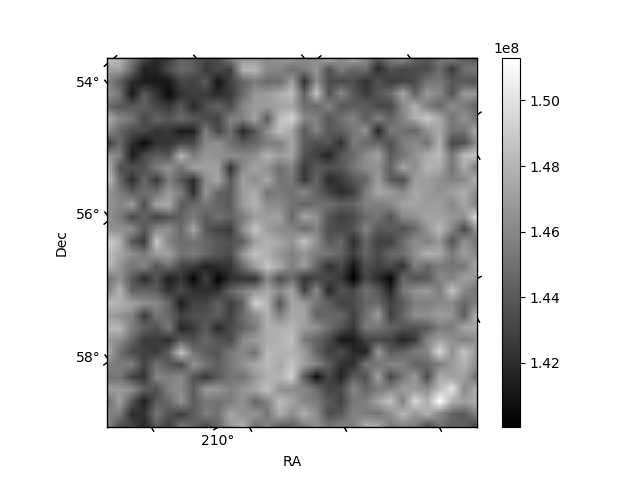
Histogram calculated using DETX and DETY for each event in the final _common_clean file
| Quadrant A | 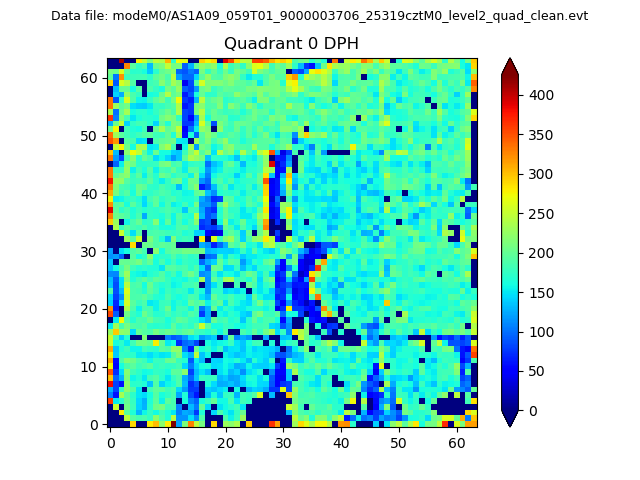 |
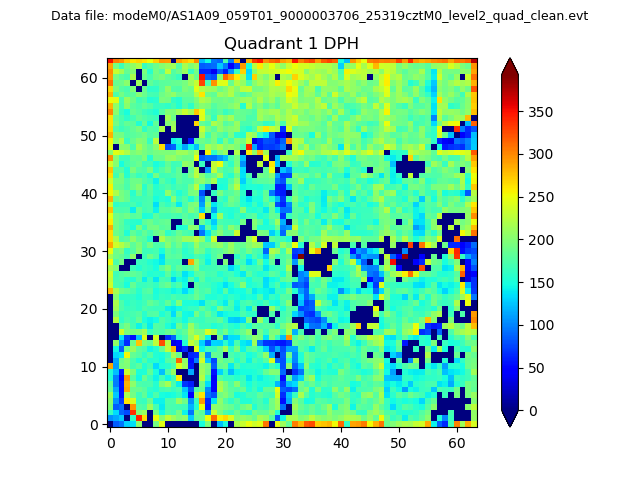 |
Quadrant B |
|---|---|---|---|
| Quadrant D | 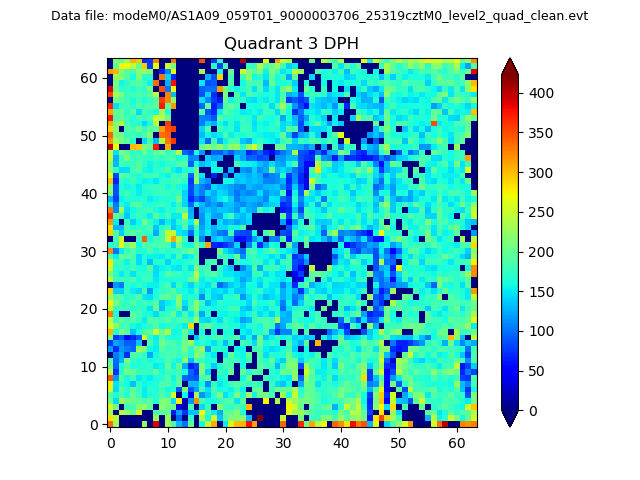 |
 |
Quadrant C |
| Plot type | Count rate plots | Images |
|---|---|---|
| Comparison with Poisson distribution Blue bars denote a histogram of data divided into 1 sec bins. Red curve is a Poisson curve with rate = median count rate of data. |
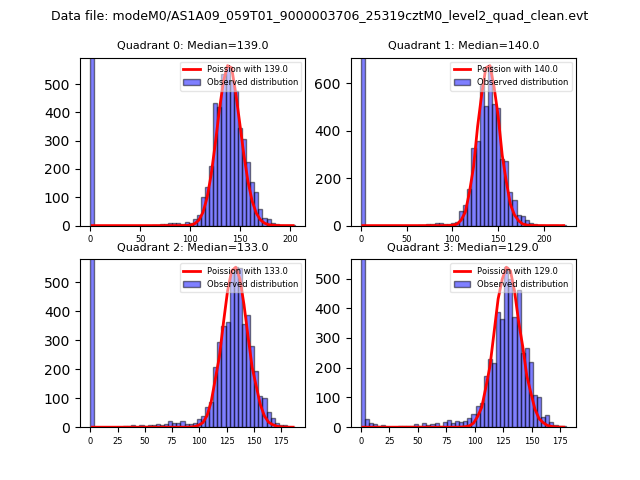 |
 |
| Quadrant-wise count rates Data is divided into 100 sec bins |
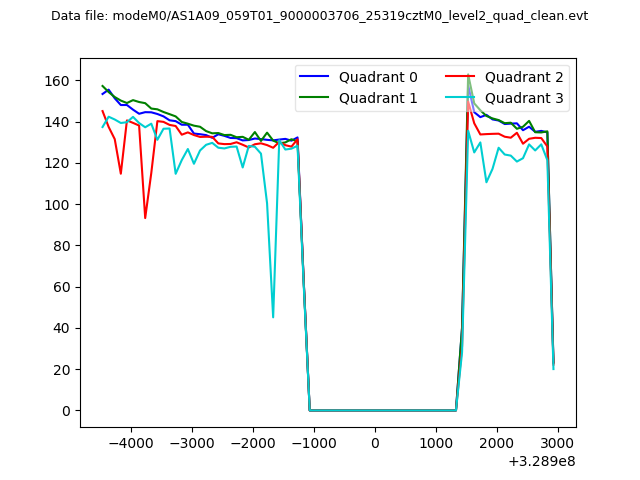 |
|
| Module-wise count rates for Quadrant A Data is divided into 100 sec bins |
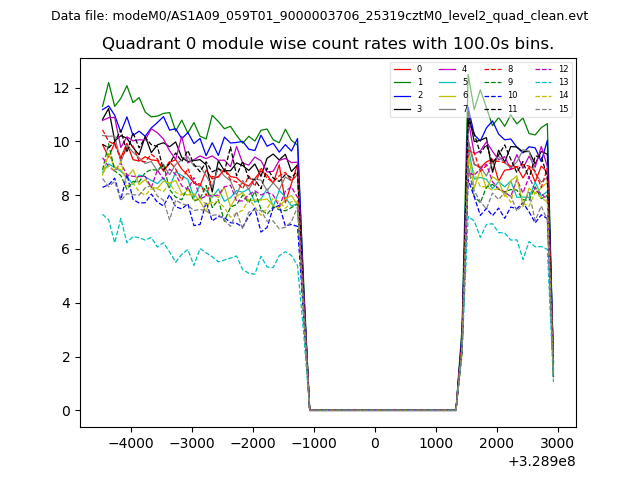 |
 |
| Module-wise count rates for Quadrant B Data is divided into 100 sec bins |
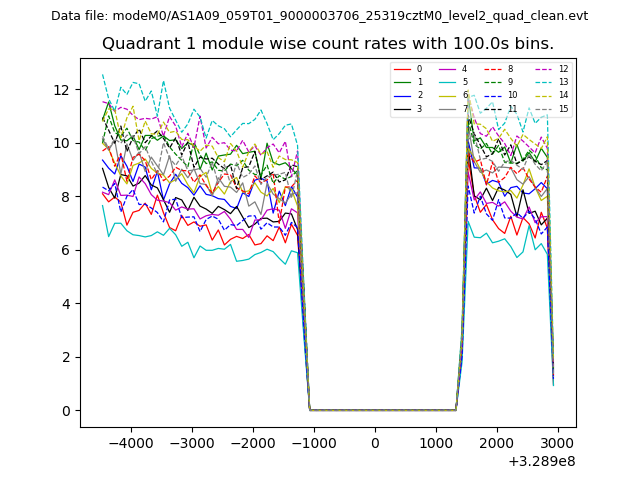 |
 |
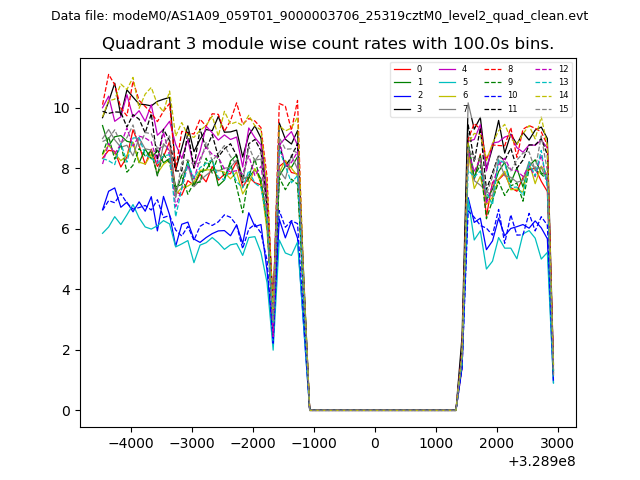
| Module-wise count rates for Quadrant C Data is divided into 100 sec bins |
 |
 |
| Module-wise count rates for Quadrant D Data is divided into 100 sec bins |
 |
 |
| Parameter | Plot |
|---|---|
| CZT HV Monitor | 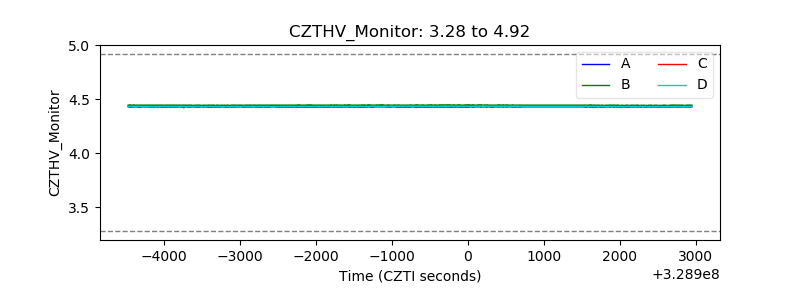 |
| D_VDD | 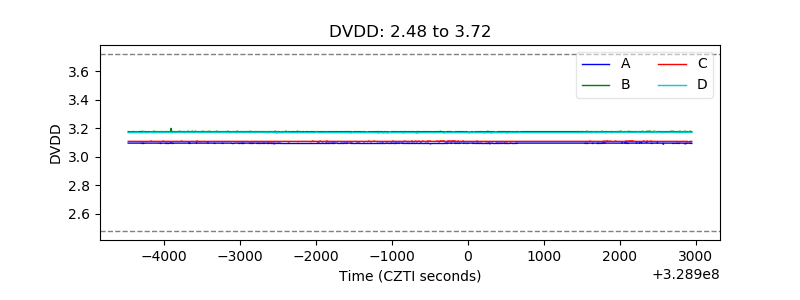 |
| Temperature 1 | 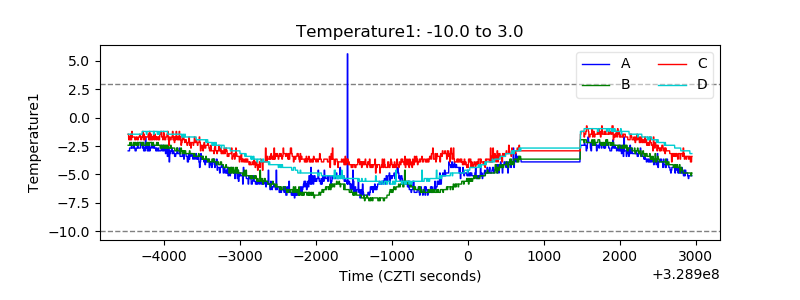 |
| Veto HV Monitor | 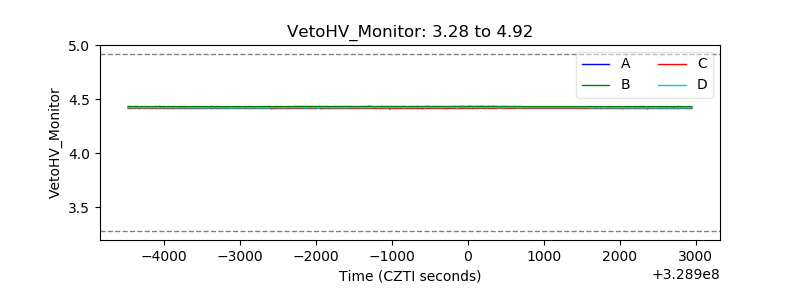 |
| Veto LLD | 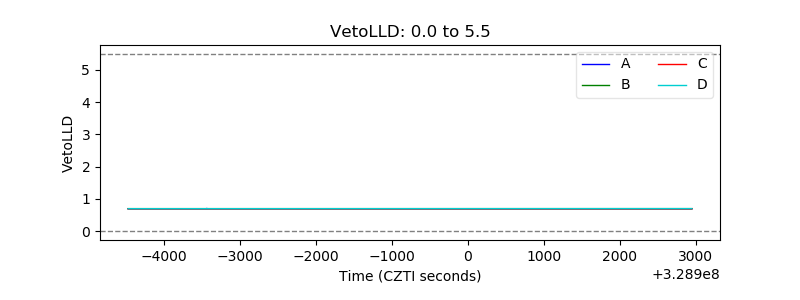 |
| Alpha Counter |  |
| _CPM_Rate | 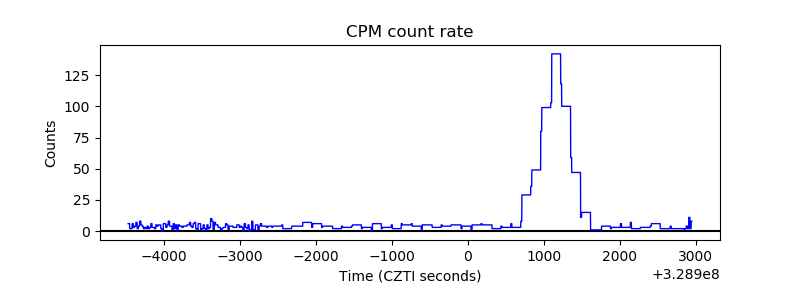 |
| CZT Counter |  |
| +2.5 Volts monitor |  |
| +5 Volts monitor |  |
| _ROLL_ROT | 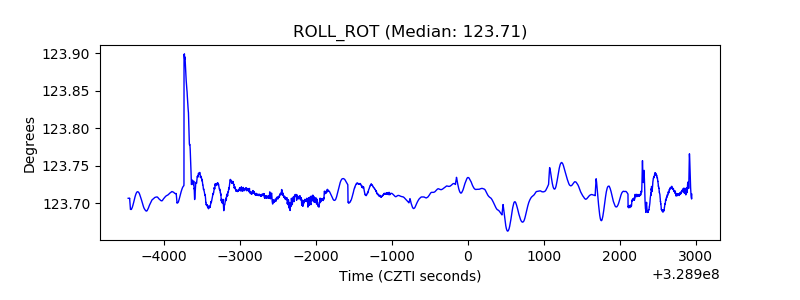 |
| _Roll_DEC | 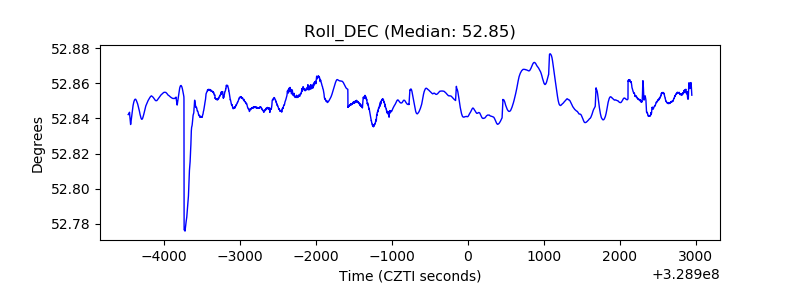 |
| _Roll_RA | 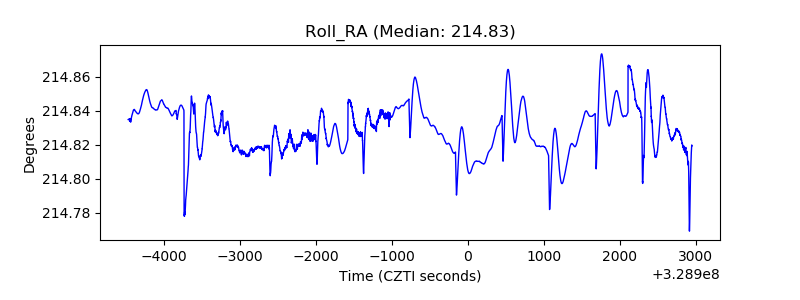 |
| Veto Counter | 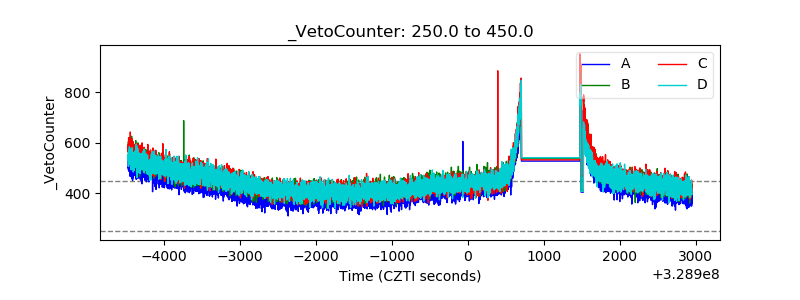 |