| Param | Original file | Final file |
|---|---|---|
| Filename | modeM0/AS1A09_059T01_9000003706_25320cztM0_level2.evt | modeM0/AS1A09_059T01_9000003706_25320cztM0_level2_quad_clean.evt |
| Size (bytes) | 608,785,920 | 110,943,360 |
| Size | 580.6 MB | 105.8 MB |
| Events in quadrant A | 3,534,929 | 733,733 |
| Events in quadrant B | 3,708,262 | 737,633 |
| Events in quadrant C | 3,642,247 | 708,795 |
| Events in quadrant D | 7,050,126 | 664,364 |
| Mode M0 | |||
|---|---|---|---|
| Quadrant | BADHDUFLAG | Total packets | Discarded packets |
| A | 0 | 15386 | 0 |
| B | 0 | 15837 | 0 |
| C | 0 | 15496 | 0 |
| D | 0 | 26041 | 0 |
| Mode M9 | |||
|---|---|---|---|
| Quadrant | BADHDUFLAG | Total packets | Discarded packets |
| A | 0 | 4 | 0 |
| B | 0 | 4 | 0 |
| C | 0 | 4 | 0 |
| D | 0 | 4 | 0 |
| Quadrant | Total seconds | Saturated seconds | Saturation percentage |
|---|---|---|---|
| A | 7402 | 46 | 0.621454% |
| B | 7403 | 117 | 1.580440% |
| C | 7403 | 116 | 1.566932% |
| D | 7403 | 684 | 9.239498% |
Noise dominated data is calculated using 1-second bins in cleaned event files. If a bin has >2000 counts, and if more than 50% of those come from <1% of pixels, then it is considered to be noise-dominated and hence unusable.
| Quadrant | # 1 sec bins | Bins with >0 counts | Bins with >2000 counts | High rate bins dominated by noise | Noise dominated (total time) | Noise dominated (detector-on time) | Marked lightcurve |
|---|---|---|---|---|---|---|---|
| A | 7812 | 7405 | 0 | 0 | 0.00% | 0.00% | 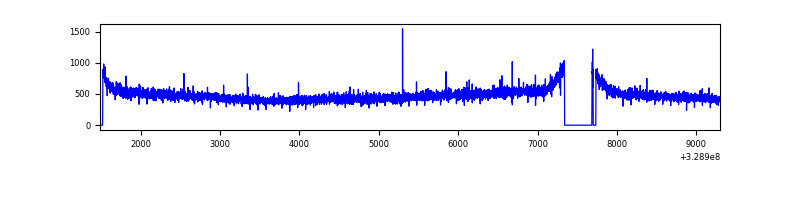 |
| B | 7813 | 7406 | 25 | 25 | 0.32% | 0.34% | 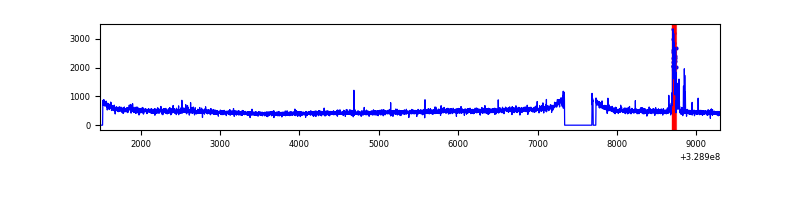 |
| C | 7813 | 7406 | 0 | 0 | 0.00% | 0.00% | 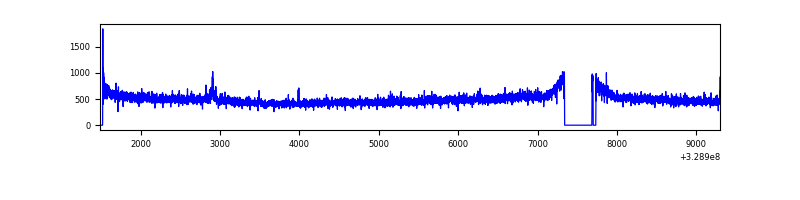 |
| D | 7813 | 7406 | 465 | 465 | 5.95% | 6.28% | 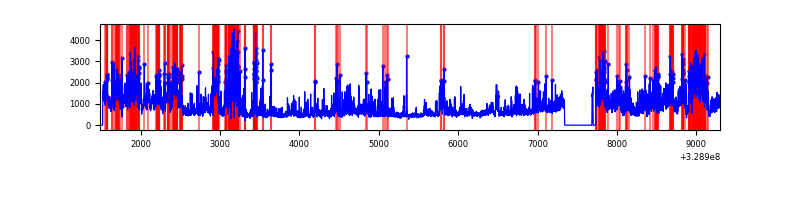 |
Top three noisy pixels from each quadrant. If the there are fewer than three noisy pixels in the level2.evt file, extra rows are filled as -1
| Pixel properties | Quadrant properties | ||||||
|---|---|---|---|---|---|---|---|
| Quadrant | DetID | PixID | Counts | Sigma | Mean | Median | Sigma |
| A | 13 | 254 | 11760 | 58.77 | 916 | 896 | 184.9 |
| A | 3 | 137 | 8430 | 40.75 | 916 | 896 | 184.9 |
| A | 0 | 226 | 7800 | 37.35 | 916 | 896 | 184.9 |
| B | 3 | 112 | 131176 | 745.94 | 908 | 884 | 174.7 |
| B | 12 | 111 | 21107 | 115.78 | 908 | 884 | 174.7 |
| B | 11 | 111 | 19084 | 104.2 | 908 | 884 | 174.7 |
| C | 14 | 238 | 139837 | 673.22 | 882 | 887 | 206.4 |
| C | 9 | 54 | 28882 | 135.64 | 882 | 887 | 206.4 |
| C | 3 | 233 | 14496 | 65.94 | 882 | 887 | 206.4 |
| D | 1 | 52 | 1911801 | 9036.12 | 876 | 851 | 211.5 |
| D | 8 | 195 | 1427240 | 6744.82 | 876 | 851 | 211.5 |
| D | 12 | 235 | 160247 | 753.72 | 876 | 851 | 211.5 |
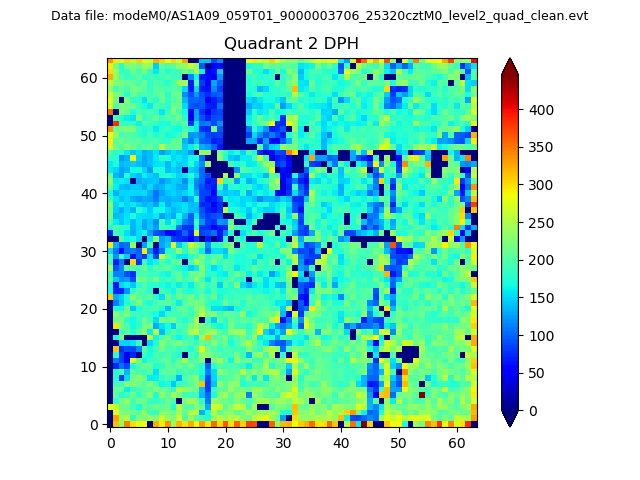
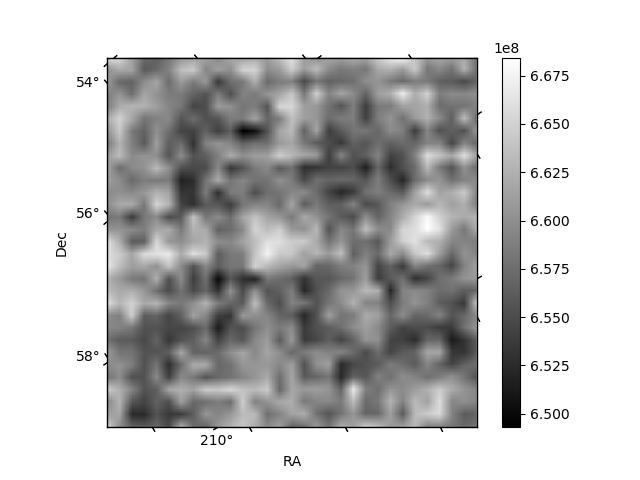
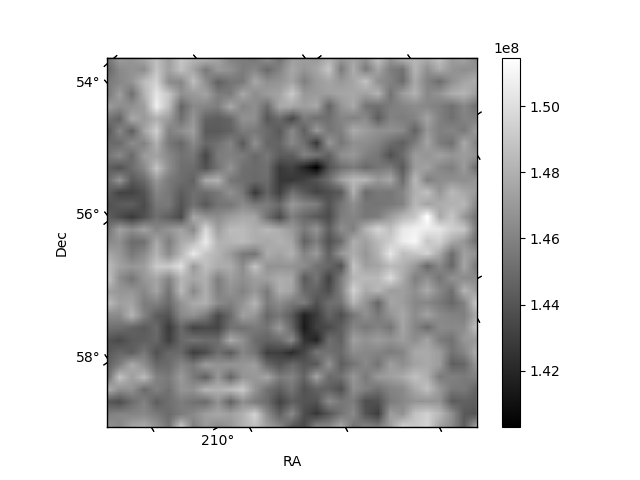
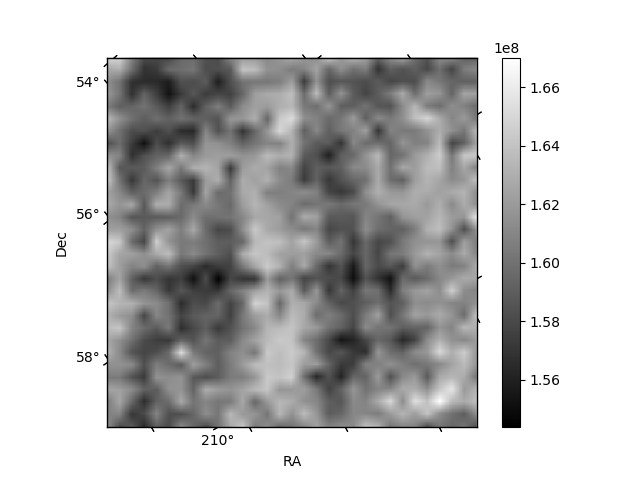
Histogram calculated using DETX and DETY for each event in the final _common_clean file
| Quadrant A | 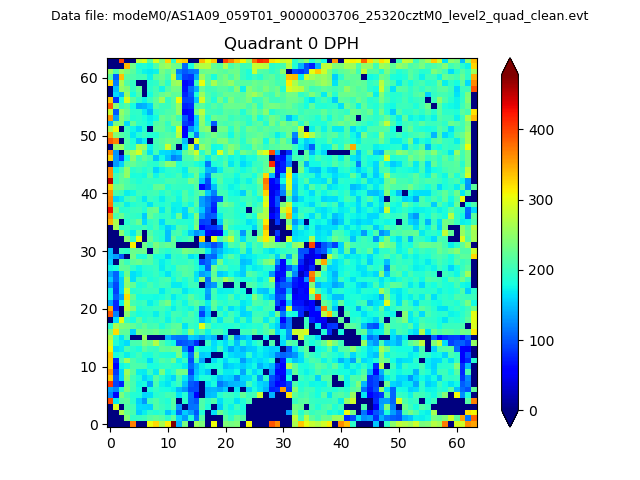 |
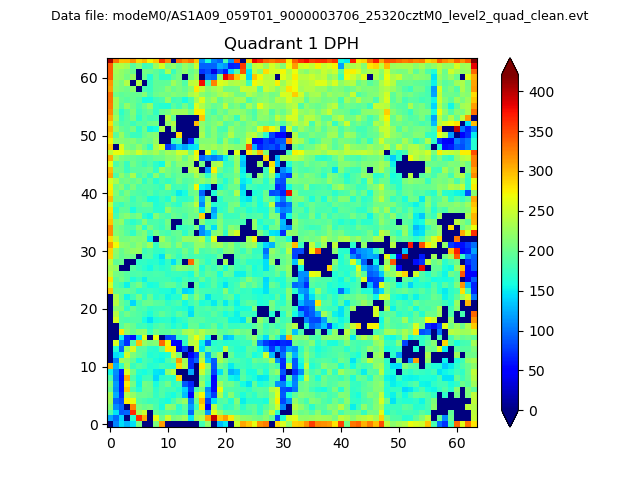 |
Quadrant B |
|---|---|---|---|
| Quadrant D | 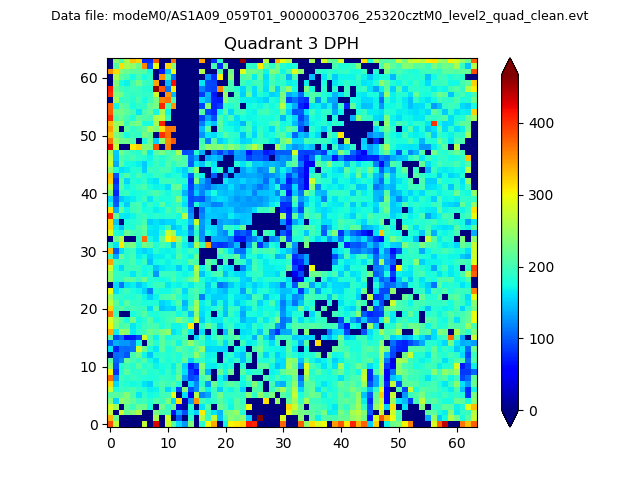 |
 |
Quadrant C |
| Plot type | Count rate plots | Images |
|---|---|---|
| Comparison with Poisson distribution Blue bars denote a histogram of data divided into 1 sec bins. Red curve is a Poisson curve with rate = median count rate of data. |
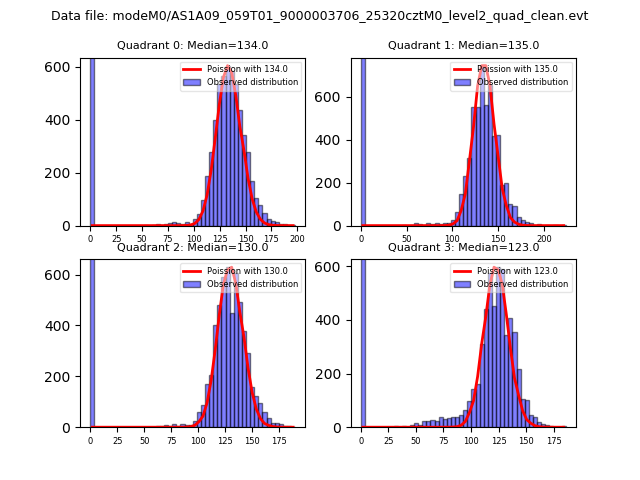 |
 |
| Quadrant-wise count rates Data is divided into 100 sec bins |
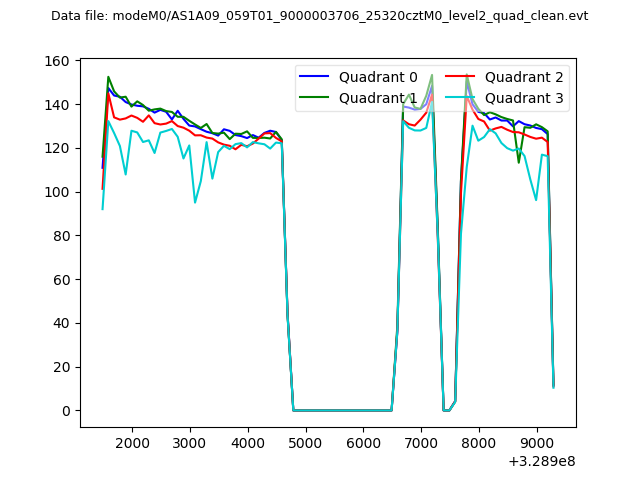 |
|
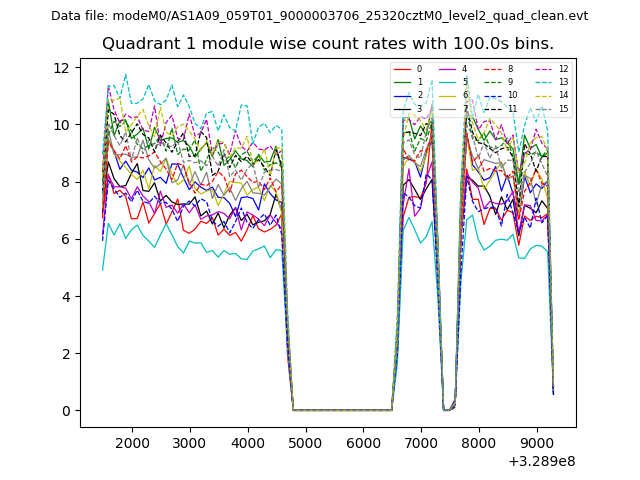
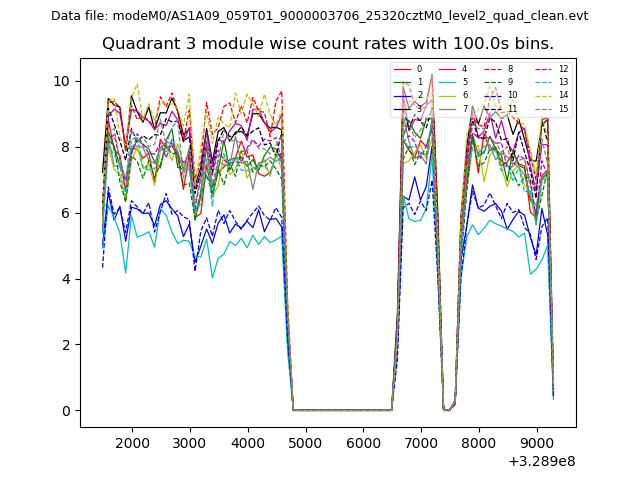
| Module-wise count rates for Quadrant A Data is divided into 100 sec bins |
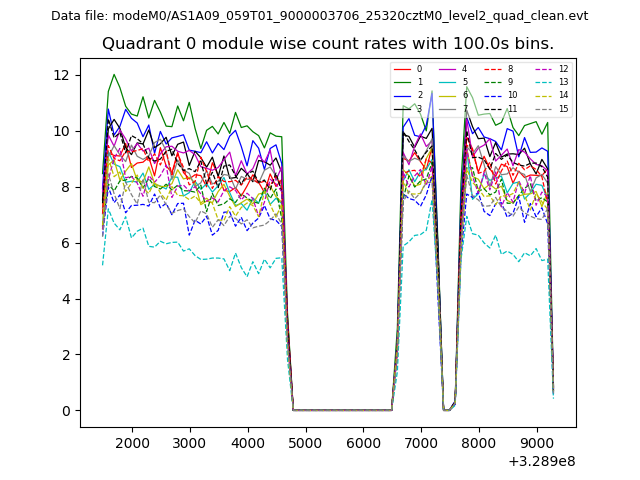 |
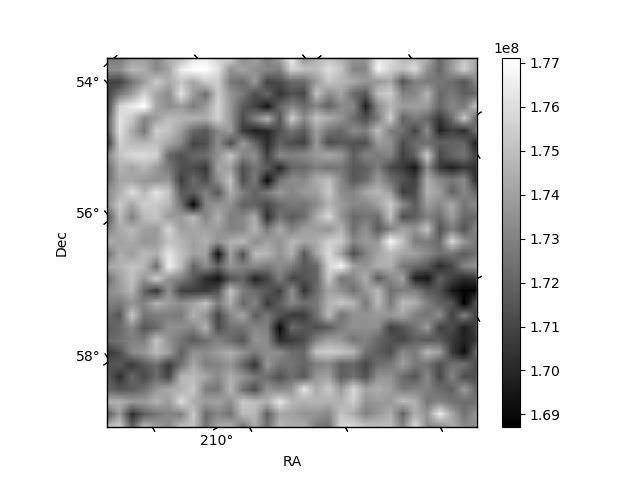 |
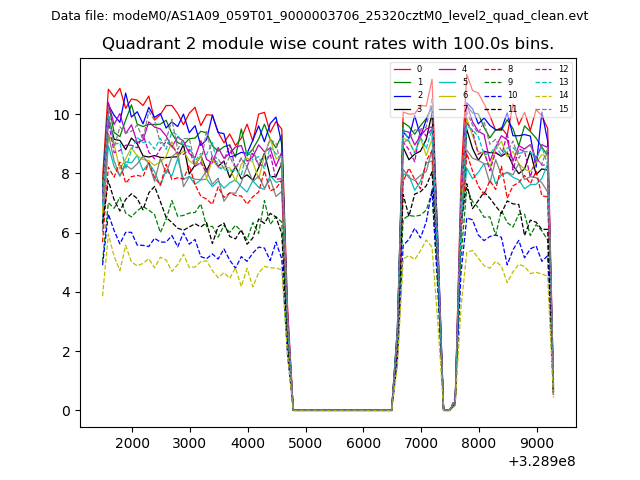
| Module-wise count rates for Quadrant B Data is divided into 100 sec bins |
 |
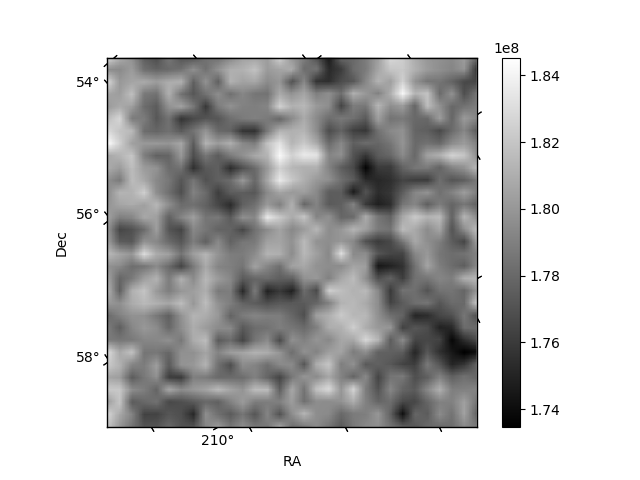 |
| Module-wise count rates for Quadrant C Data is divided into 100 sec bins |
 |
 |
| Module-wise count rates for Quadrant D Data is divided into 100 sec bins |
 |
 |
| Parameter | Plot |
|---|---|
| CZT HV Monitor | 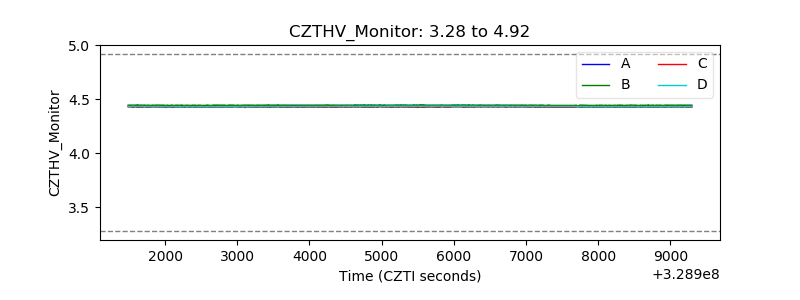 |
| D_VDD | 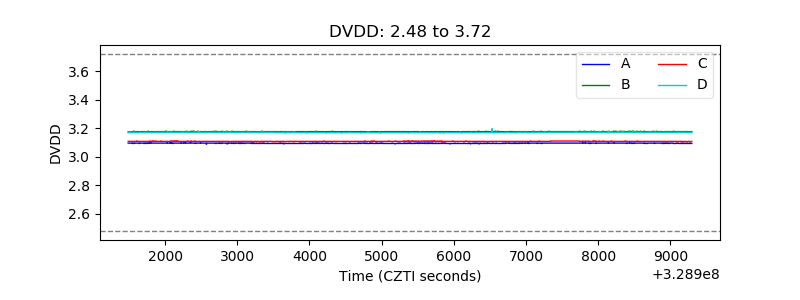 |
| Temperature 1 | 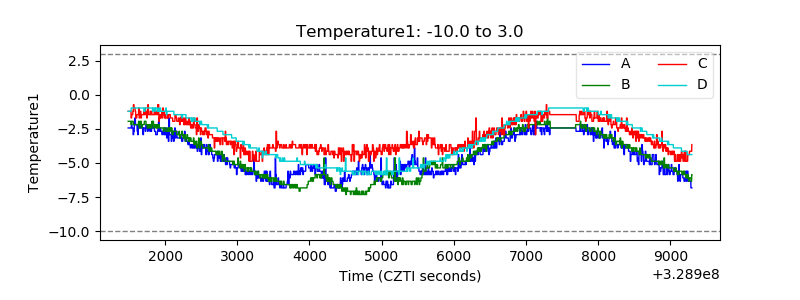 |
| Veto HV Monitor | 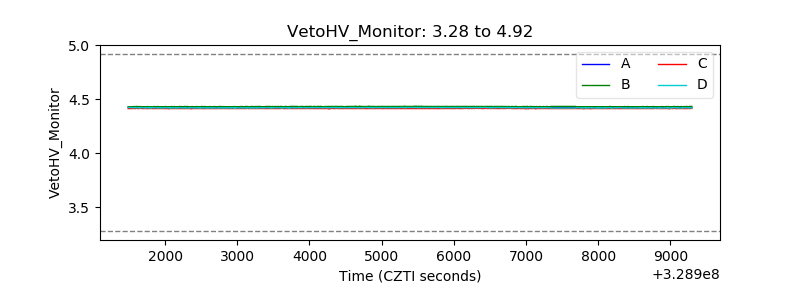 |
| Veto LLD | 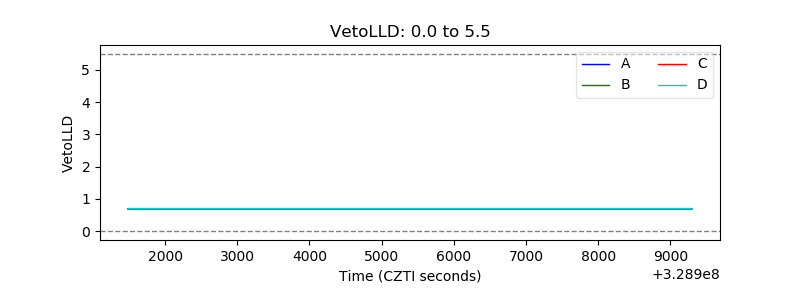 |
| Alpha Counter | 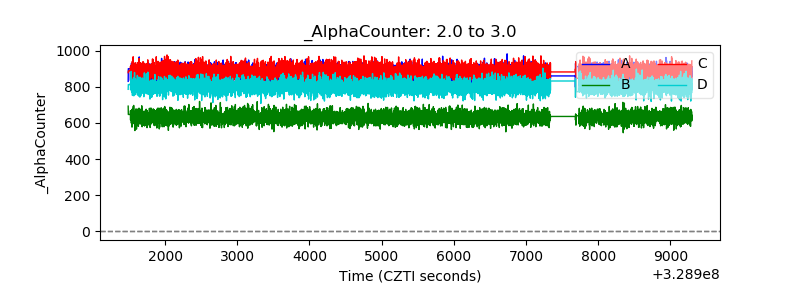 |
| _CPM_Rate | 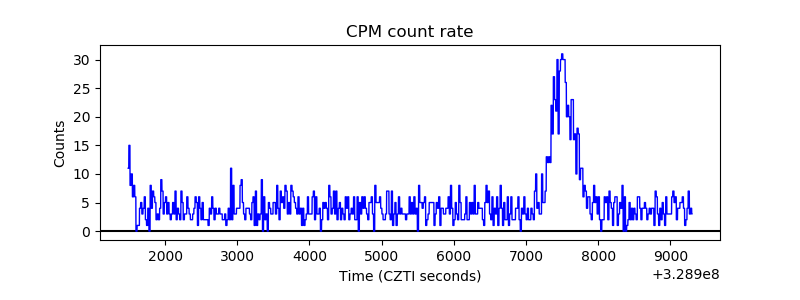 |
| CZT Counter | 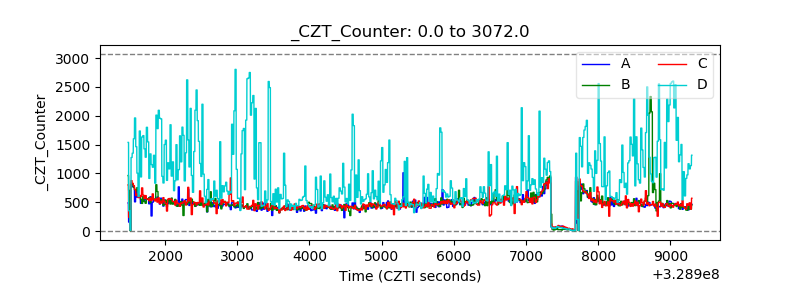 |
| +2.5 Volts monitor | 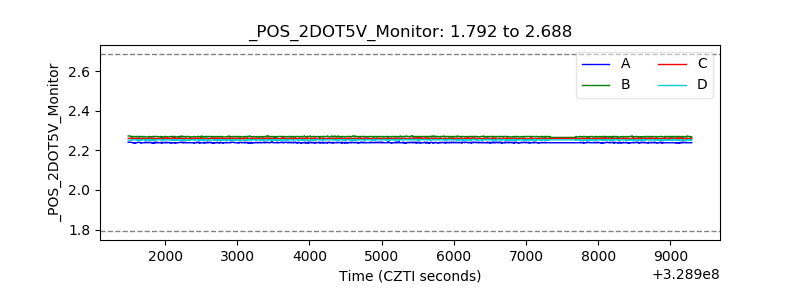 |
| +5 Volts monitor |  |
| _ROLL_ROT | 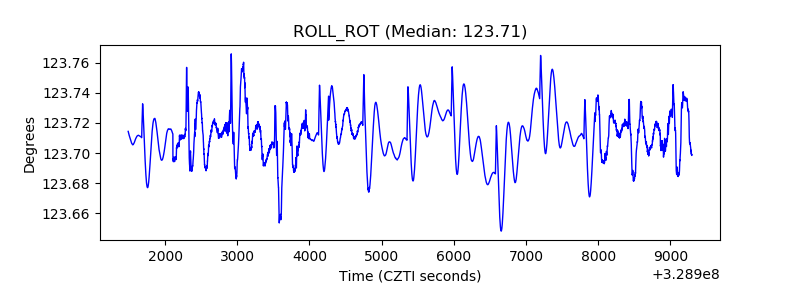 |
| _Roll_DEC | 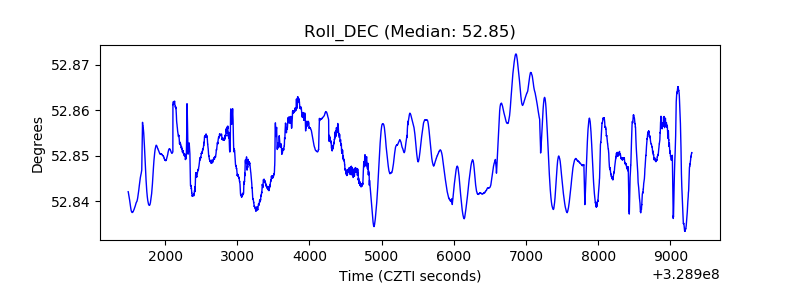 |
| _Roll_RA | 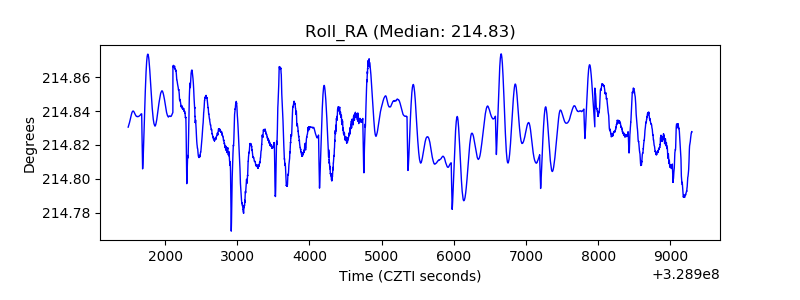 |
| Veto Counter | 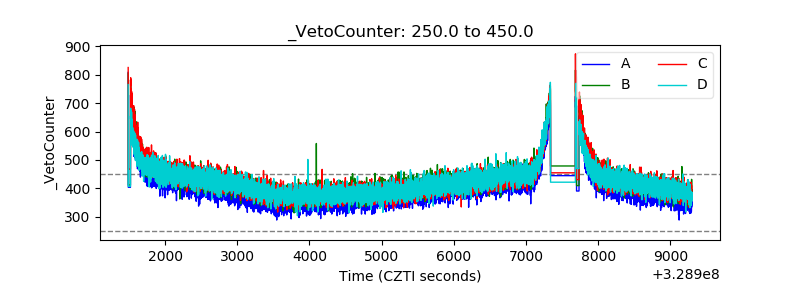 |