| Param | Original file | Final file |
|---|---|---|
| Filename | modeM0/AS1A09_059T01_9000003706_25321cztM0_level2.evt | modeM0/AS1A09_059T01_9000003706_25321cztM0_level2_quad_clean.evt |
| Size (bytes) | 764,596,800 | 114,439,680 |
| Size | 729.2 MB | 109.1 MB |
| Events in quadrant A | 3,701,086 | 771,429 |
| Events in quadrant B | 3,887,238 | 776,847 |
| Events in quadrant C | 5,352,591 | 709,274 |
| Events in quadrant D | 9,691,281 | 668,550 |
| Mode M0 | |||
|---|---|---|---|
| Quadrant | BADHDUFLAG | Total packets | Discarded packets |
| A | 0 | 16217 | 0 |
| B | 0 | 16690 | 0 |
| C | 0 | 20811 | 0 |
| D | 0 | 34226 | 0 |
| Mode M9 | |||
|---|---|---|---|
| Quadrant | BADHDUFLAG | Total packets | Discarded packets |
| A | 0 | 5 | 0 |
| B | 0 | 5 | 0 |
| C | 0 | 5 | 0 |
| D | 0 | 5 | 0 |
| Quadrant | Total seconds | Saturated seconds | Saturation percentage |
|---|---|---|---|
| A | 7743 | 79 | 1.020276% |
| B | 7744 | 178 | 2.298554% |
| C | 7743 | 771 | 9.957381% |
| D | 7743 | 1407 | 18.171251% |
Noise dominated data is calculated using 1-second bins in cleaned event files. If a bin has >2000 counts, and if more than 50% of those come from <1% of pixels, then it is considered to be noise-dominated and hence unusable.
| Quadrant | # 1 sec bins | Bins with >0 counts | Bins with >2000 counts | High rate bins dominated by noise | Noise dominated (total time) | Noise dominated (detector-on time) | Marked lightcurve |
|---|---|---|---|---|---|---|---|
| A | 8293 | 7747 | 0 | 0 | 0.00% | 0.00% | 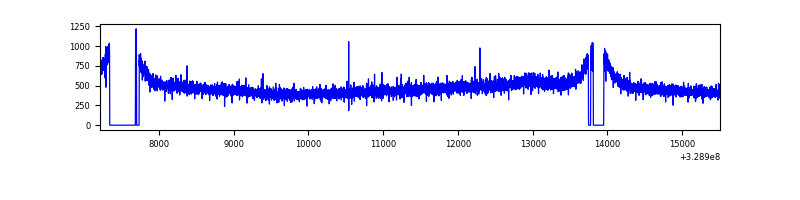 |
| B | 8294 | 7748 | 29 | 29 | 0.35% | 0.37% | 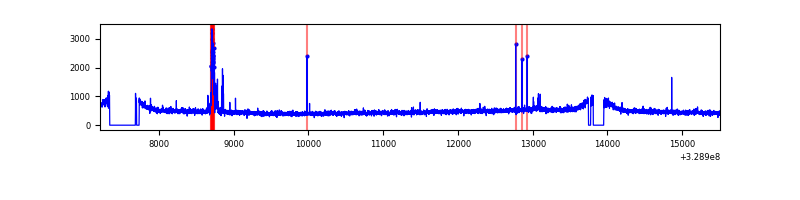 |
| C | 8293 | 7747 | 549 | 549 | 6.62% | 7.09% | 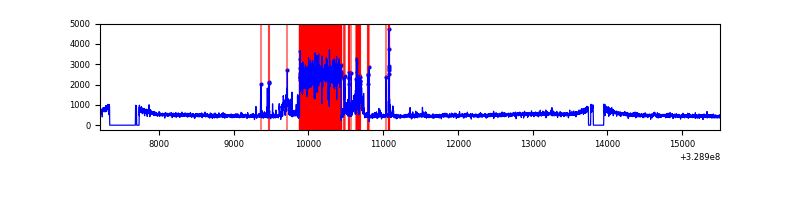 |
| D | 8293 | 7747 | 994 | 994 | 11.99% | 12.83% | 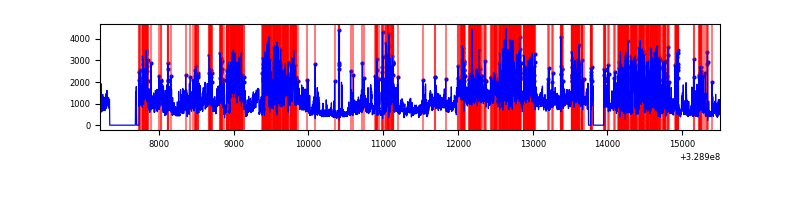 |
Top three noisy pixels from each quadrant. If the there are fewer than three noisy pixels in the level2.evt file, extra rows are filled as -1
| Pixel properties | Quadrant properties | ||||||
|---|---|---|---|---|---|---|---|
| Quadrant | DetID | PixID | Counts | Sigma | Mean | Median | Sigma |
| A | 13 | 254 | 12485 | 59.22 | 959 | 936 | 195.0 |
| A | 3 | 137 | 8992 | 41.31 | 959 | 936 | 195.0 |
| A | 0 | 226 | 8069 | 36.57 | 959 | 936 | 195.0 |
| B | 3 | 112 | 128661 | 698.64 | 952 | 925 | 182.8 |
| B | 12 | 111 | 22340 | 117.13 | 952 | 925 | 182.8 |
| B | 11 | 111 | 20020 | 104.44 | 952 | 925 | 182.8 |
| C | 9 | 54 | 1656781 | 7828.19 | 902 | 910 | 211.5 |
| C | 14 | 238 | 141472 | 664.51 | 902 | 910 | 211.5 |
| C | 3 | 233 | 15991 | 71.3 | 902 | 910 | 211.5 |
| D | 1 | 52 | 3423473 | 15930.78 | 889 | 862 | 214.8 |
| D | 8 | 195 | 2262894 | 10528.79 | 889 | 862 | 214.8 |
| D | 12 | 233 | 289695 | 1344.39 | 889 | 862 | 214.8 |
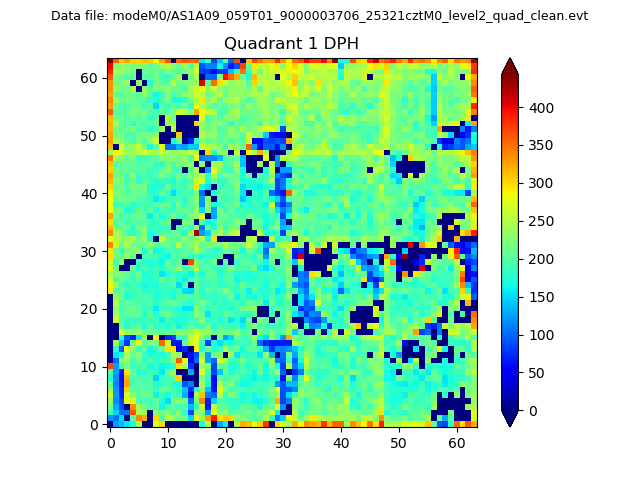
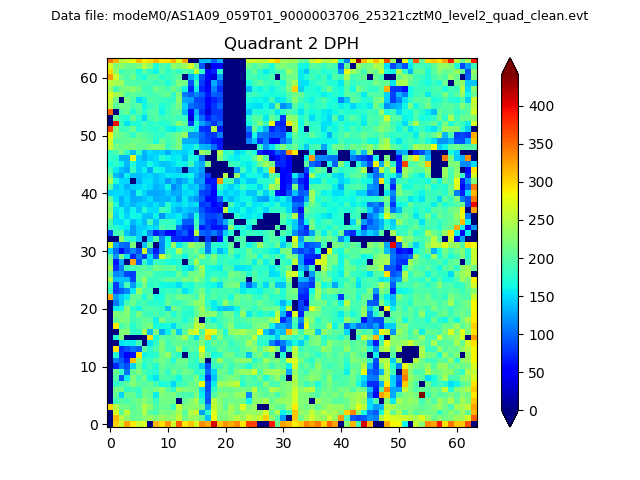
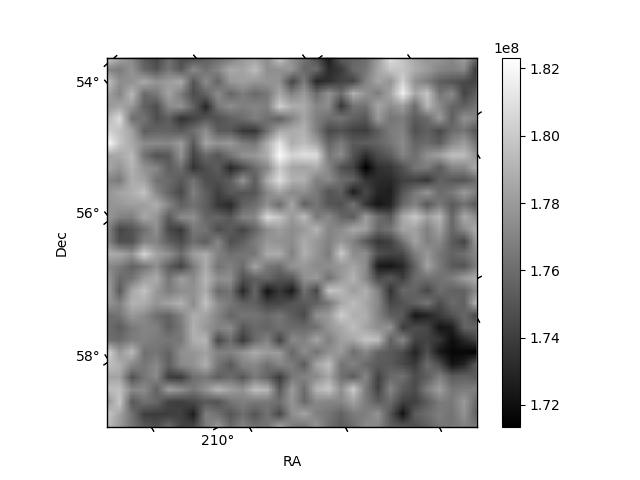
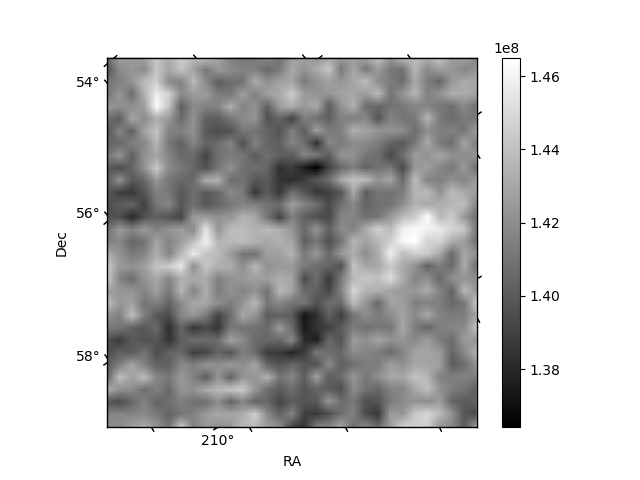
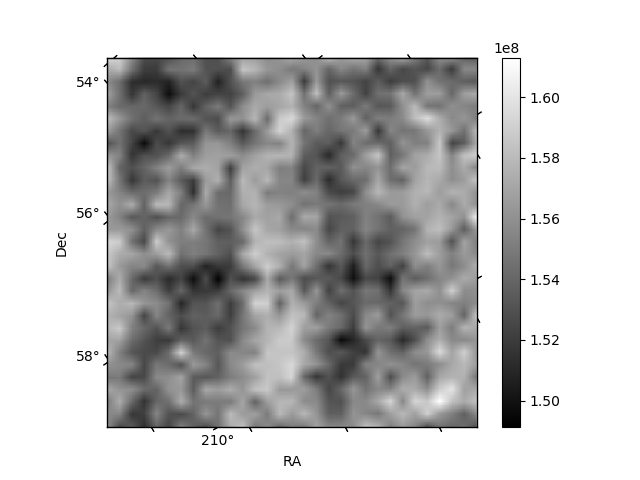
Histogram calculated using DETX and DETY for each event in the final _common_clean file
| Quadrant A |  |
 |
Quadrant B |
|---|---|---|---|
| Quadrant D | 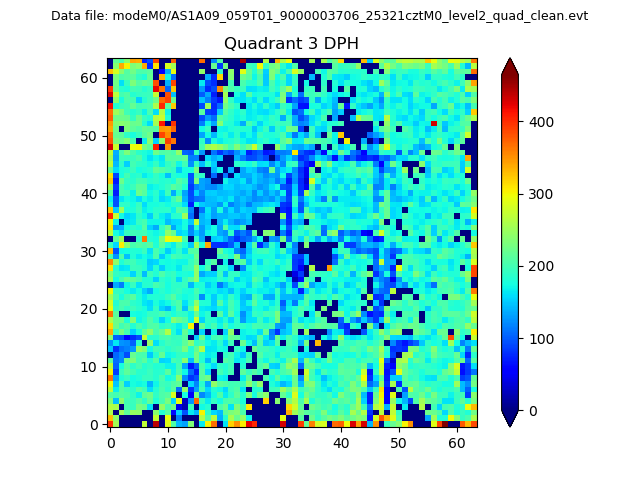 |
 |
Quadrant C |
| Plot type | Count rate plots | Images |
|---|---|---|
| Comparison with Poisson distribution Blue bars denote a histogram of data divided into 1 sec bins. Red curve is a Poisson curve with rate = median count rate of data. |
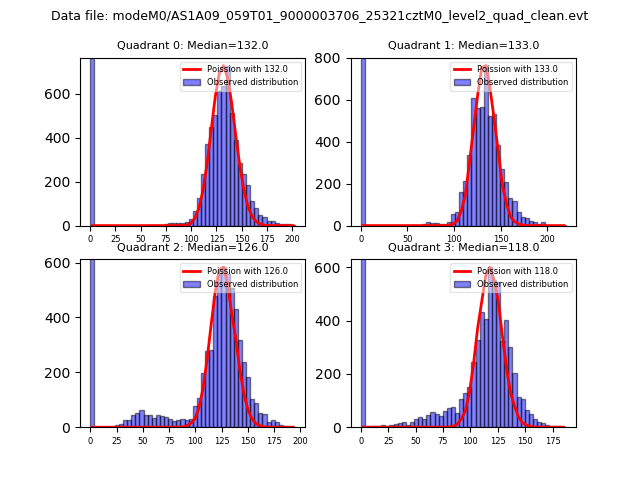 |
 |
| Quadrant-wise count rates Data is divided into 100 sec bins |
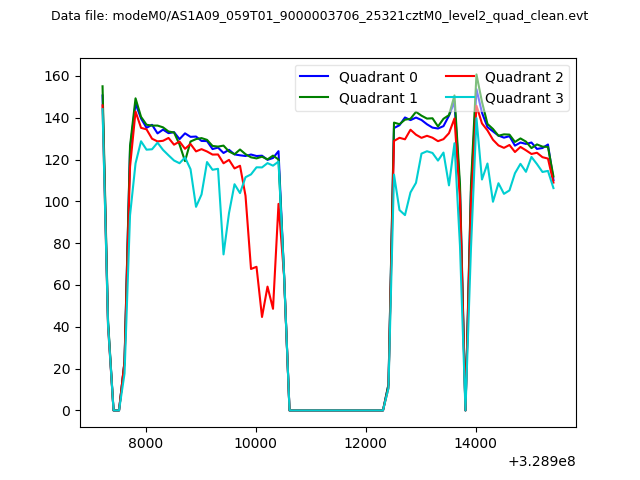 |
|
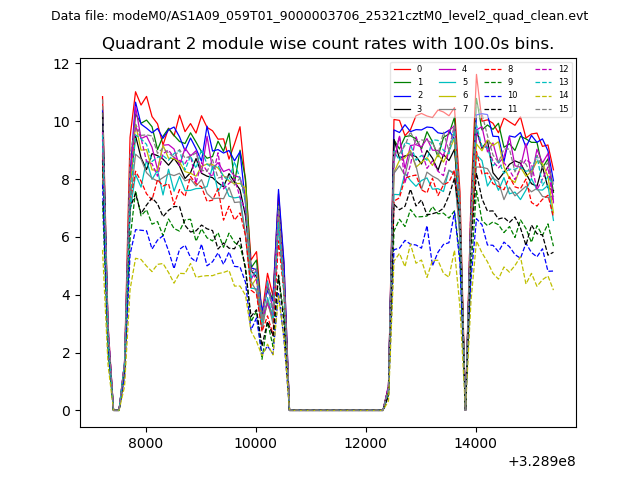
| Module-wise count rates for Quadrant A Data is divided into 100 sec bins |
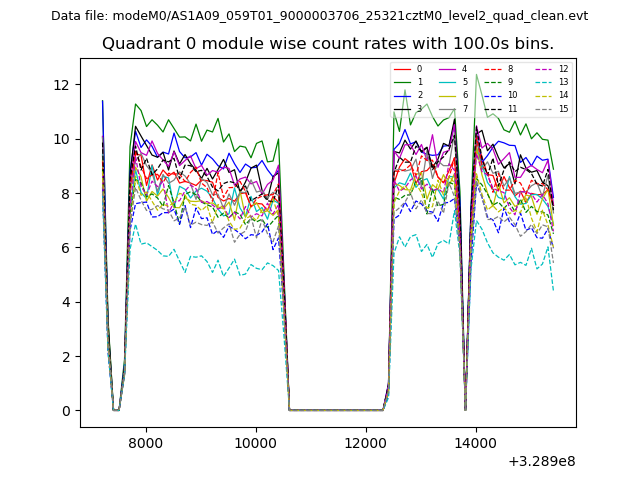 |
 |
| Module-wise count rates for Quadrant B Data is divided into 100 sec bins |
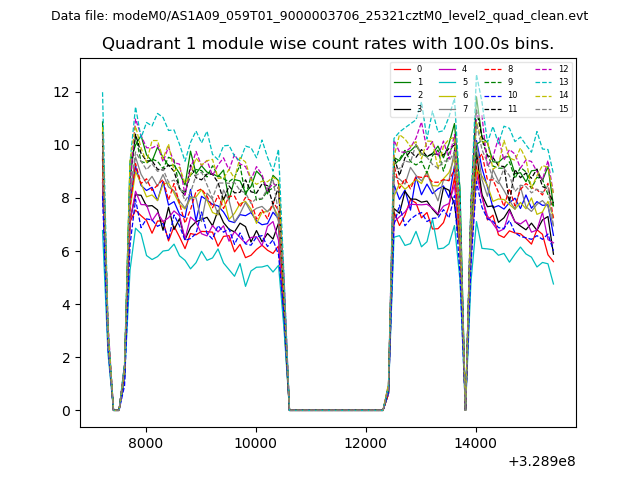 |
 |
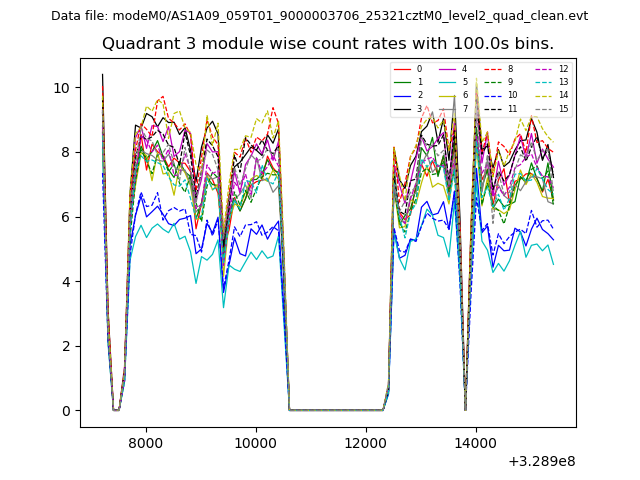
| Module-wise count rates for Quadrant C Data is divided into 100 sec bins |
 |
 |
| Module-wise count rates for Quadrant D Data is divided into 100 sec bins |
 |
 |
| Parameter | Plot |
|---|---|
| CZT HV Monitor | 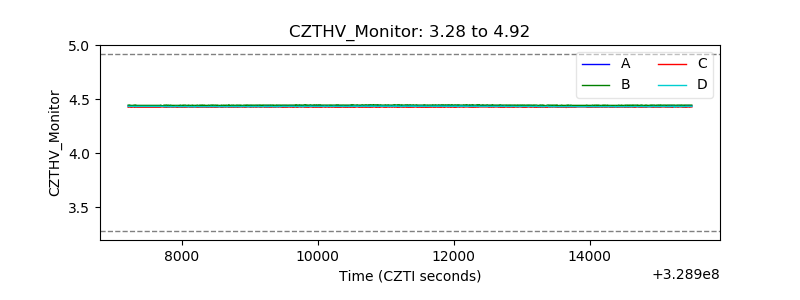 |
| D_VDD | 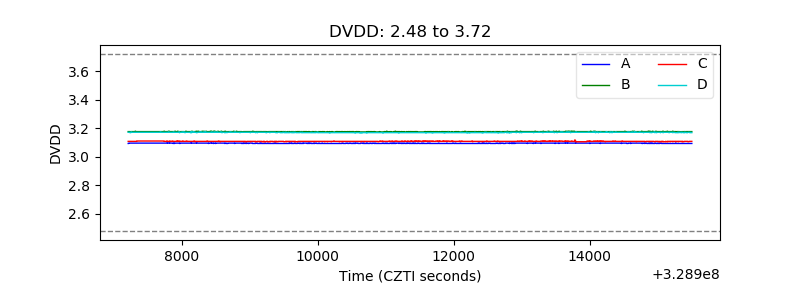 |
| Temperature 1 | 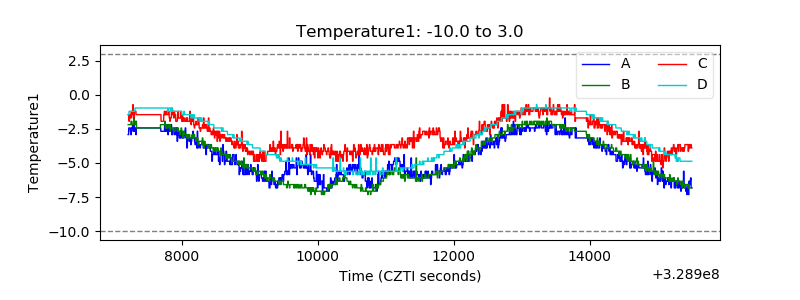 |
| Veto HV Monitor |  |
| Veto LLD | 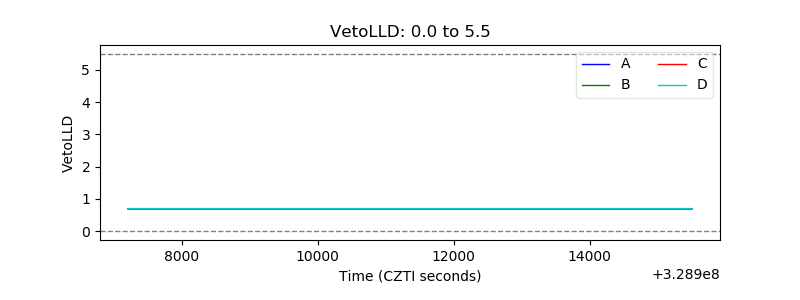 |
| Alpha Counter | 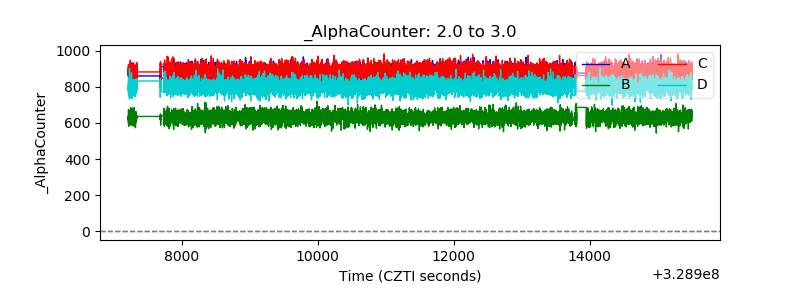 |
| _CPM_Rate | 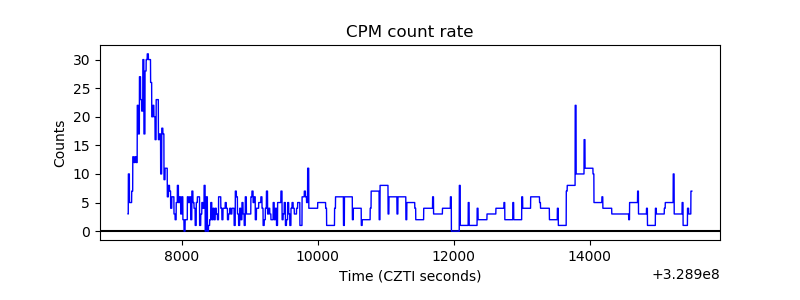 |
| CZT Counter |  |
| +2.5 Volts monitor |  |
| +5 Volts monitor | 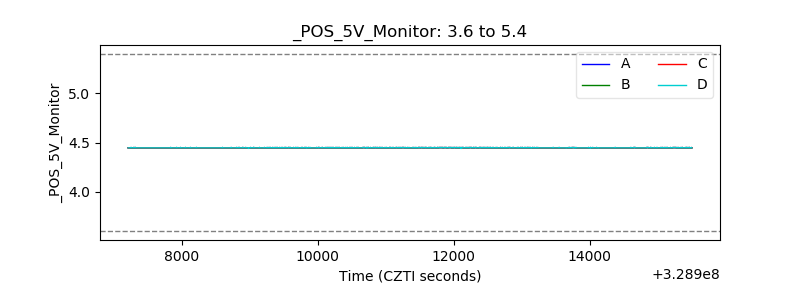 |
| _ROLL_ROT | 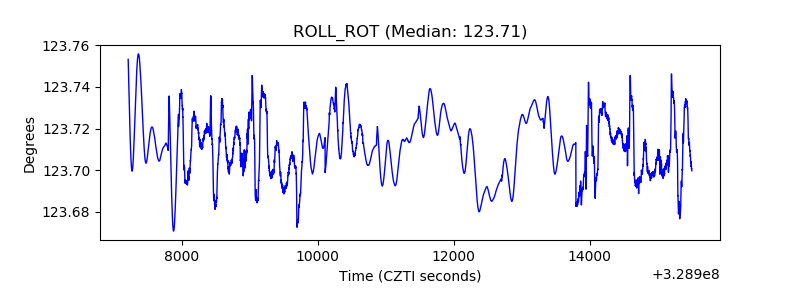 |
| _Roll_DEC | 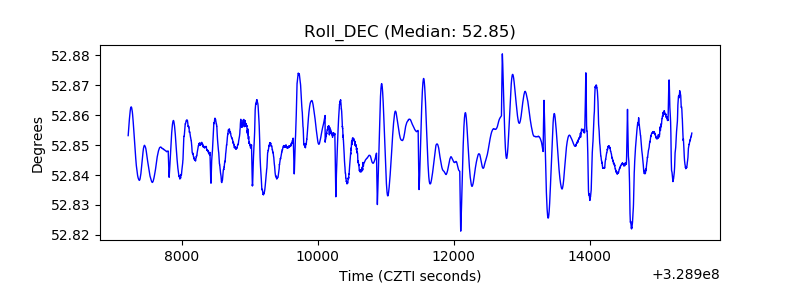 |
| _Roll_RA |  |
| Veto Counter | 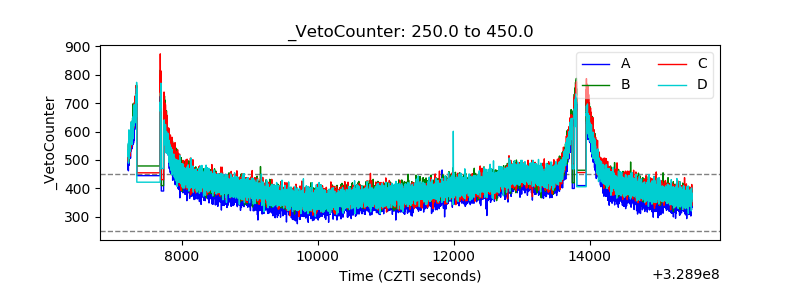 |