| Param | Original file | Final file |
|---|---|---|
| Filename | modeM0/AS1A09_059T01_9000003706_25322cztM0_level2.evt | modeM0/AS1A09_059T01_9000003706_25322cztM0_level2_quad_clean.evt |
| Size (bytes) | 614,266,560 | 118,039,680 |
| Size | 585.8 MB | 112.6 MB |
| Events in quadrant A | 3,687,468 | 779,408 |
| Events in quadrant B | 3,768,113 | 788,025 |
| Events in quadrant C | 3,800,916 | 754,881 |
| Events in quadrant D | 6,811,931 | 704,103 |
| Mode M0 | |||
|---|---|---|---|
| Quadrant | BADHDUFLAG | Total packets | Discarded packets |
| A | 0 | 16366 | 0 |
| B | 0 | 16462 | 0 |
| C | 0 | 16511 | 0 |
| D | 0 | 25584 | 0 |
| Mode M9 | |||
|---|---|---|---|
| Quadrant | BADHDUFLAG | Total packets | Discarded packets |
| A | 0 | 5 | 0 |
| B | 0 | 5 | 0 |
| C | 0 | 5 | 0 |
| D | 0 | 5 | 0 |
| Quadrant | Total seconds | Saturated seconds | Saturation percentage |
|---|---|---|---|
| A | 7885 | 54 | 0.684845% |
| B | 7886 | 91 | 1.153944% |
| C | 7886 | 144 | 1.826021% |
| D | 7886 | 809 | 10.258686% |
Noise dominated data is calculated using 1-second bins in cleaned event files. If a bin has >2000 counts, and if more than 50% of those come from <1% of pixels, then it is considered to be noise-dominated and hence unusable.
| Quadrant | # 1 sec bins | Bins with >0 counts | Bins with >2000 counts | High rate bins dominated by noise | Noise dominated (total time) | Noise dominated (detector-on time) | Marked lightcurve |
|---|---|---|---|---|---|---|---|
| A | 8440 | 7888 | 0 | 0 | 0.00% | 0.00% | 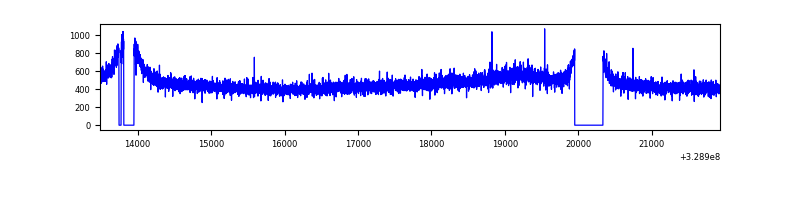 |
| B | 8441 | 7889 | 1 | 1 | 0.01% | 0.01% | 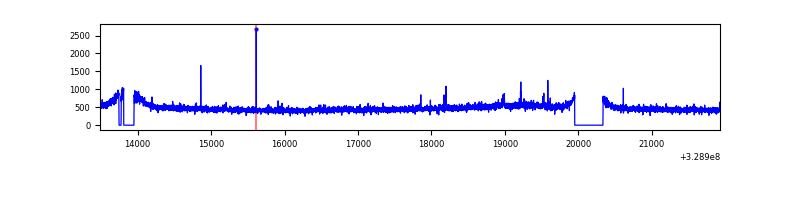 |
| C | 8441 | 7889 | 0 | 0 | 0.00% | 0.00% | 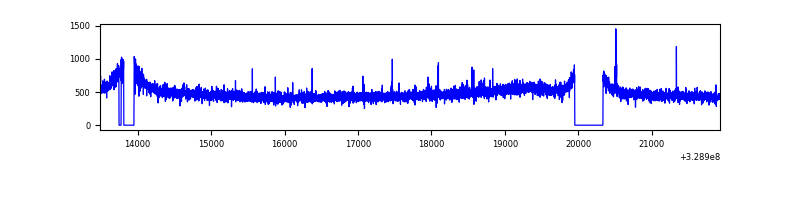 |
| D | 8441 | 7889 | 508 | 508 | 6.02% | 6.44% | 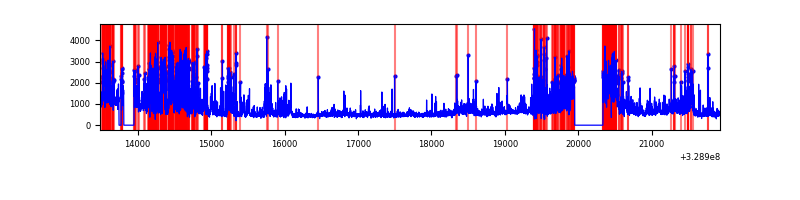 |
Top three noisy pixels from each quadrant. If the there are fewer than three noisy pixels in the level2.evt file, extra rows are filled as -1
| Pixel properties | Quadrant properties | ||||||
|---|---|---|---|---|---|---|---|
| Quadrant | DetID | PixID | Counts | Sigma | Mean | Median | Sigma |
| A | 13 | 254 | 12118 | 58.33 | 955 | 934 | 191.7 |
| A | 3 | 137 | 8978 | 41.95 | 955 | 934 | 191.7 |
| A | 0 | 226 | 7844 | 36.04 | 955 | 934 | 191.7 |
| B | 12 | 111 | 22284 | 117.45 | 952 | 927 | 181.8 |
| B | 11 | 111 | 20139 | 105.65 | 952 | 927 | 181.8 |
| B | 14 | 111 | 18142 | 94.67 | 952 | 927 | 181.8 |
| C | 14 | 238 | 146765 | 676.03 | 926 | 933 | 215.7 |
| C | 0 | 207 | 18040 | 79.3 | 926 | 933 | 215.7 |
| C | 3 | 233 | 9960 | 41.85 | 926 | 933 | 215.7 |
| D | 1 | 52 | 2377736 | 10802.78 | 907 | 881 | 220.0 |
| D | 8 | 195 | 647569 | 2939.19 | 907 | 881 | 220.0 |
| D | 15 | 145 | 121137 | 546.56 | 907 | 881 | 220.0 |
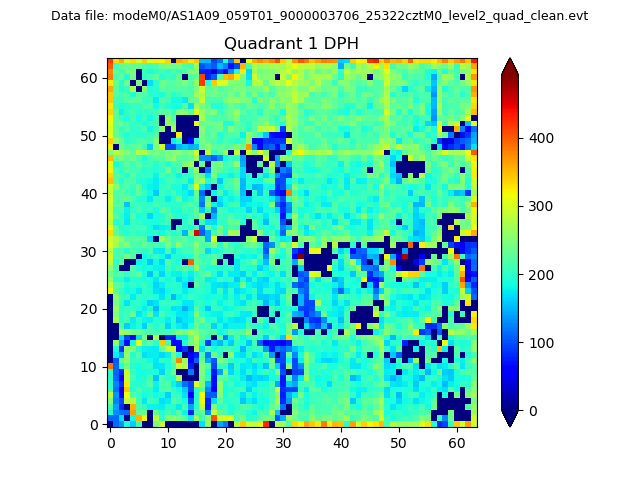
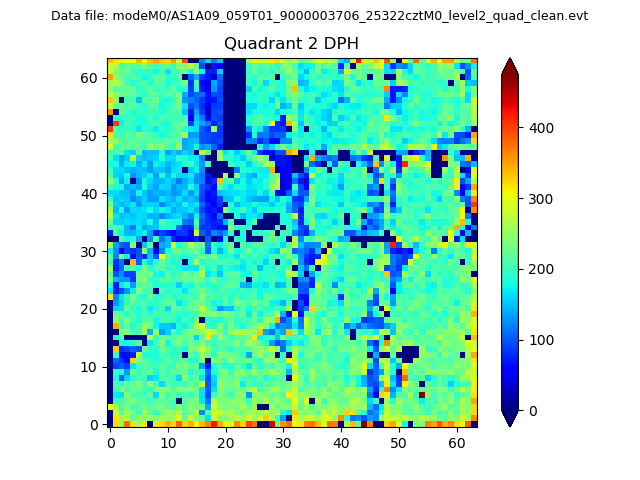
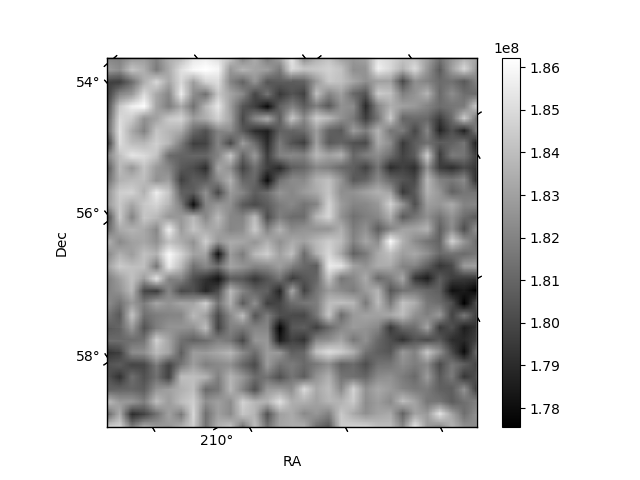
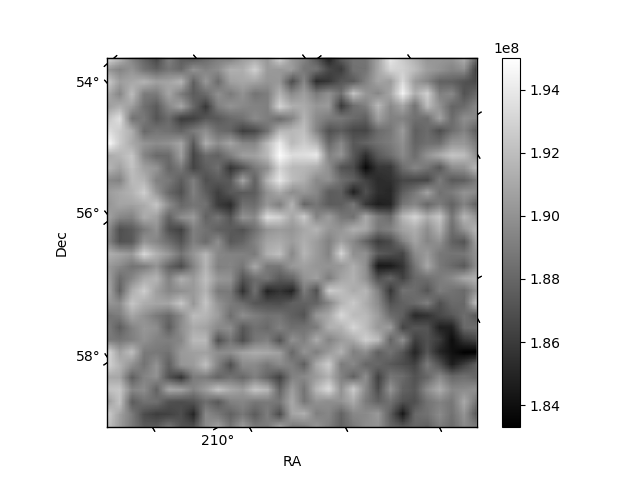
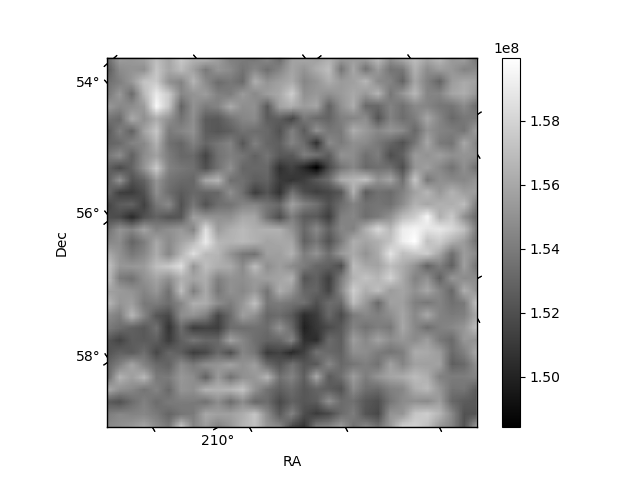
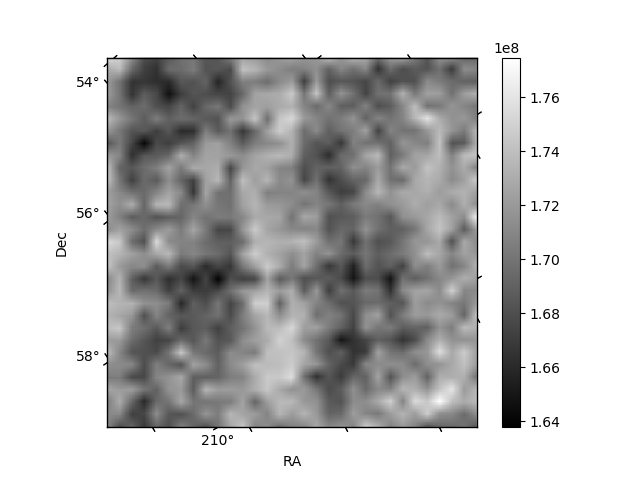
Histogram calculated using DETX and DETY for each event in the final _common_clean file
| Quadrant A |  |
 |
Quadrant B |
|---|---|---|---|
| Quadrant D | 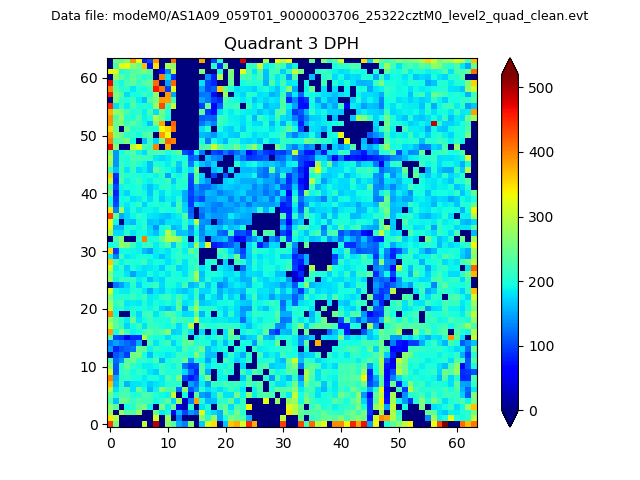 |
 |
Quadrant C |
| Plot type | Count rate plots | Images |
|---|---|---|
| Comparison with Poisson distribution Blue bars denote a histogram of data divided into 1 sec bins. Red curve is a Poisson curve with rate = median count rate of data. |
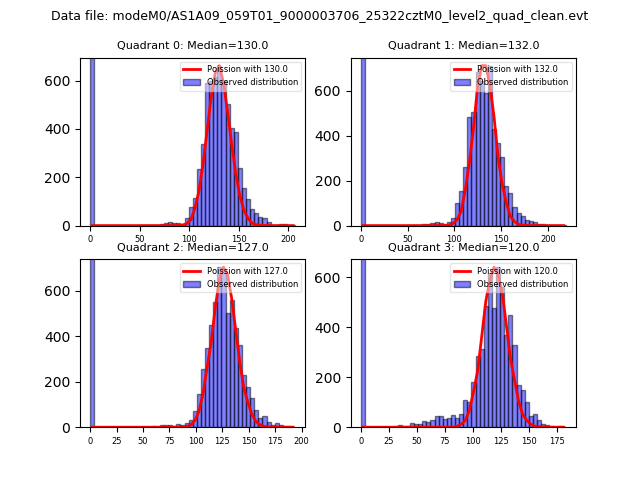 |
 |
| Quadrant-wise count rates Data is divided into 100 sec bins |
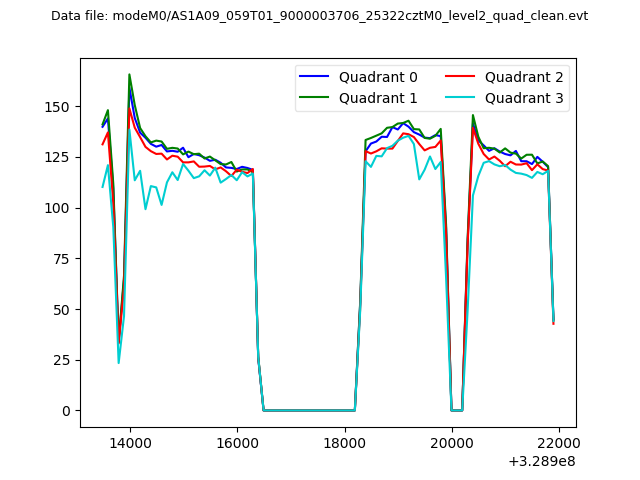 |
|
| Module-wise count rates for Quadrant A Data is divided into 100 sec bins |
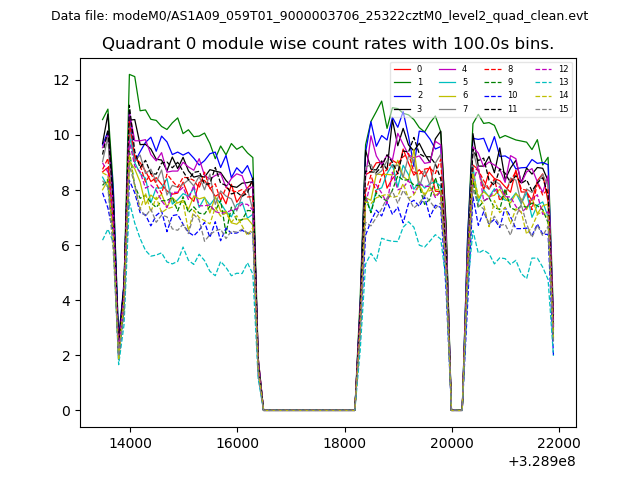 |
 |
| Module-wise count rates for Quadrant B Data is divided into 100 sec bins |
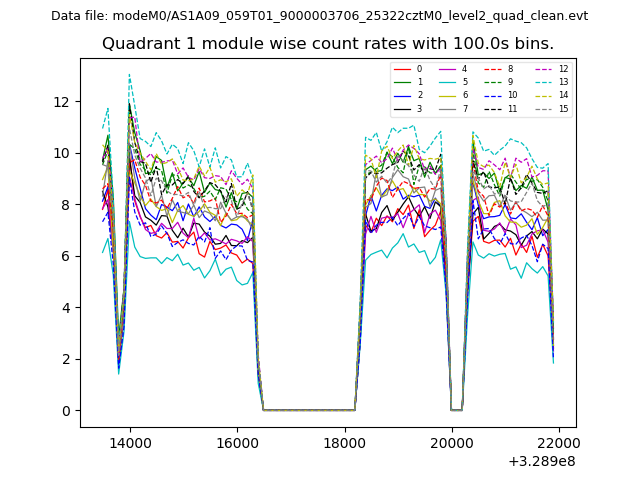 |
 |
| Module-wise count rates for Quadrant C Data is divided into 100 sec bins |
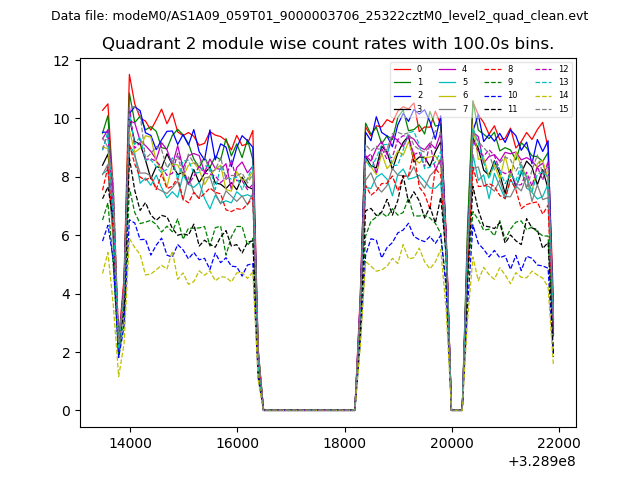 |
 |
| Module-wise count rates for Quadrant D Data is divided into 100 sec bins |
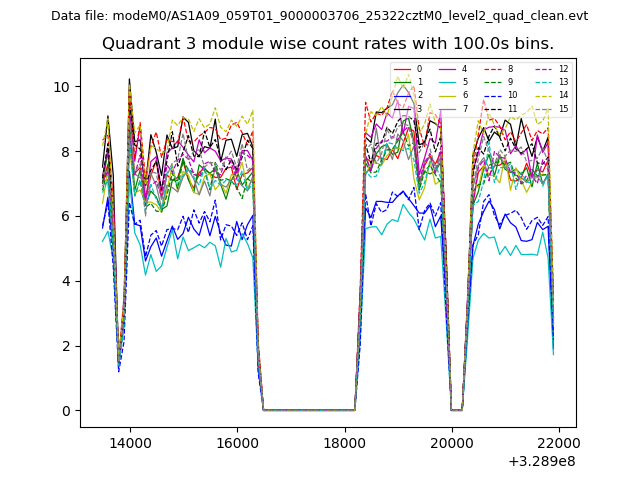 |
 |
| Parameter | Plot |
|---|---|
| CZT HV Monitor | 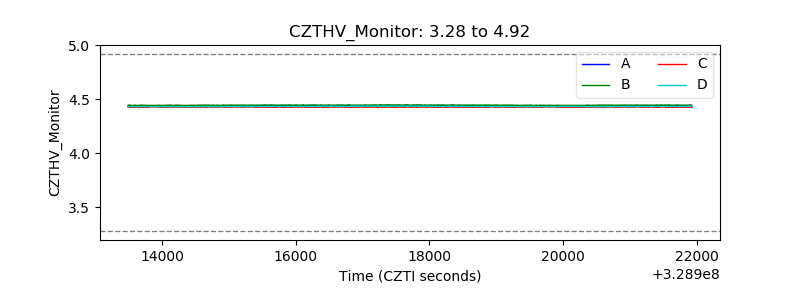 |
| D_VDD | 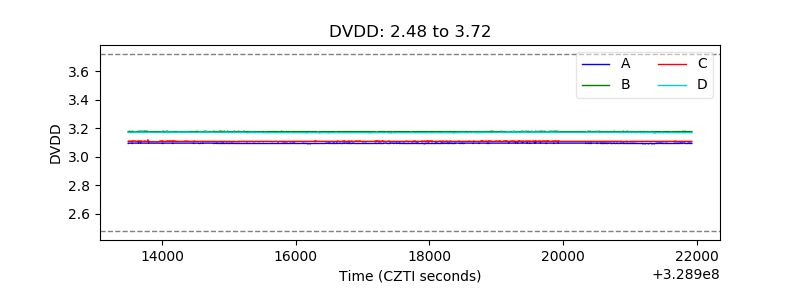 |
| Temperature 1 | 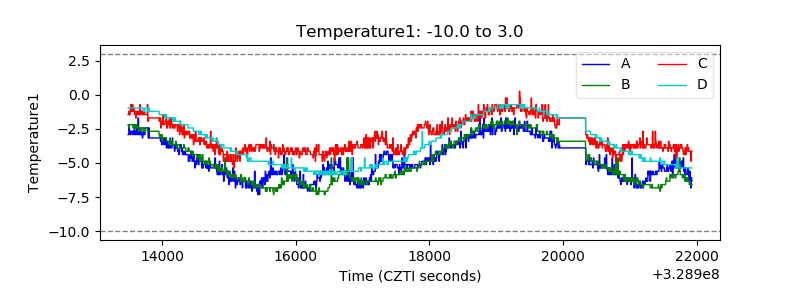 |
| Veto HV Monitor | 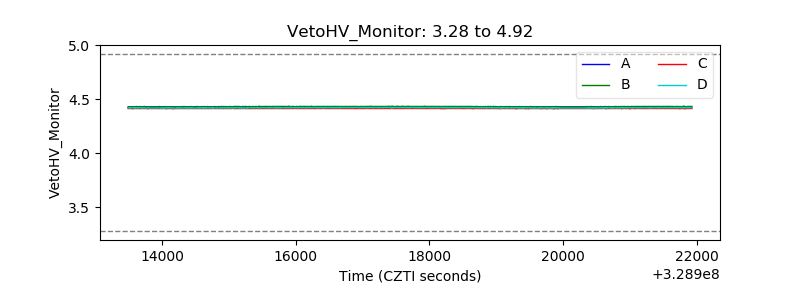 |
| Veto LLD | 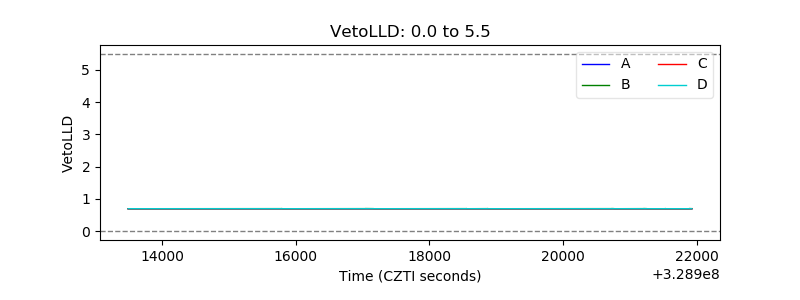 |
| Alpha Counter | 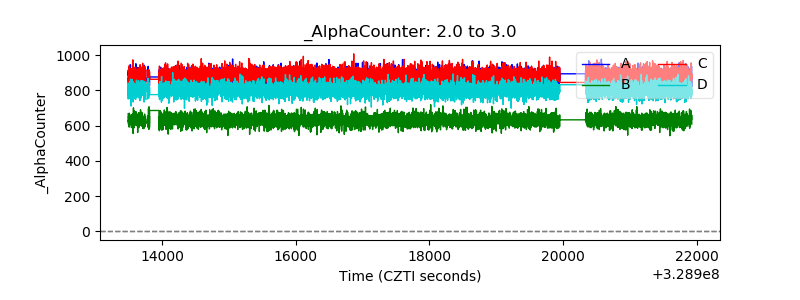 |
| _CPM_Rate | 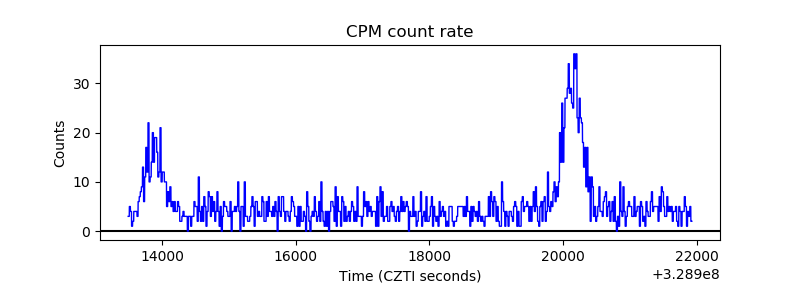 |
| CZT Counter | 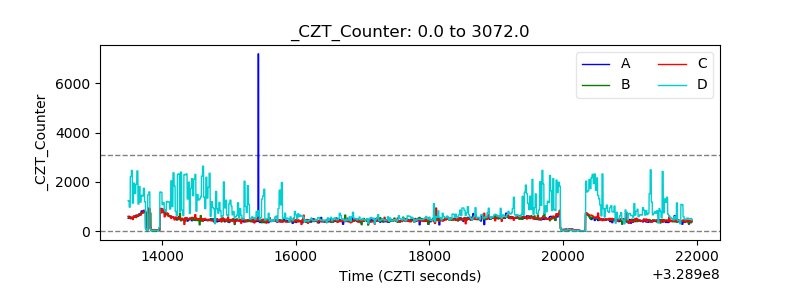 |
| +2.5 Volts monitor | 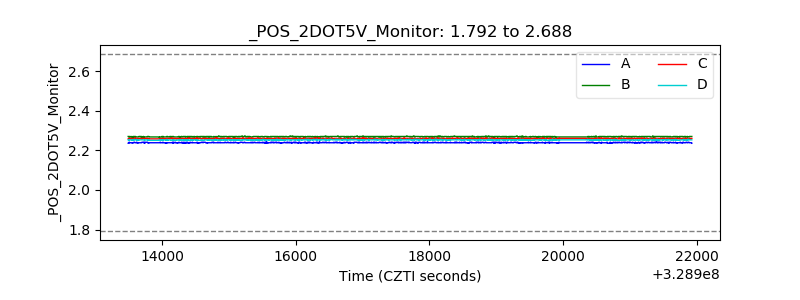 |
| +5 Volts monitor |  |
| _ROLL_ROT | 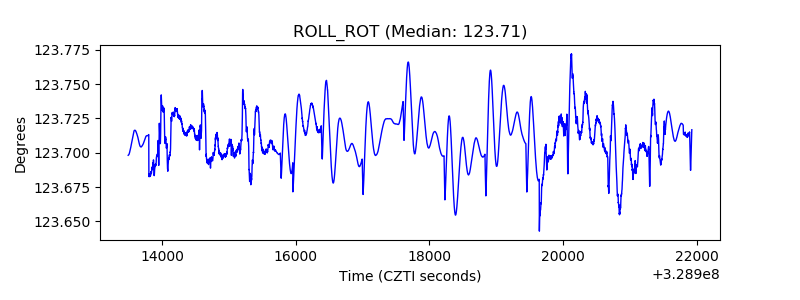 |
| _Roll_DEC |  |
| _Roll_RA |  |
| Veto Counter | 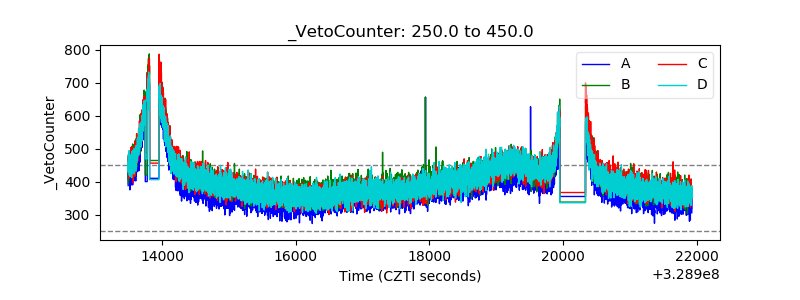 |