| Param | Original file | Final file |
|---|---|---|
| Filename | modeM0/AS1A09_059T01_9000003706_25324cztM0_level2.evt | modeM0/AS1A09_059T01_9000003706_25324cztM0_level2_quad_clean.evt |
| Size (bytes) | 1,039,032,000 | 169,450,560 |
| Size | 990.9 MB | 161.6 MB |
| Events in quadrant A | 5,865,752 | 1,101,366 |
| Events in quadrant B | 5,935,296 | 1,108,217 |
| Events in quadrant C | 8,005,222 | 1,036,403 |
| Events in quadrant D | 10,799,910 | 1,004,808 |
| Mode M0 | |||
|---|---|---|---|
| Quadrant | BADHDUFLAG | Total packets | Discarded packets |
| A | 0 | 25892 | 0 |
| B | 0 | 26055 | 0 |
| C | 0 | 32437 | 0 |
| D | 0 | 40721 | 0 |
| Mode M9 | |||
|---|---|---|---|
| Quadrant | BADHDUFLAG | Total packets | Discarded packets |
| A | 0 | 12 | 0 |
| B | 0 | 12 | 0 |
| C | 0 | 12 | 0 |
| D | 0 | 12 | 0 |
| Quadrant | Total seconds | Saturated seconds | Saturation percentage |
|---|---|---|---|
| A | 12748 | 58 | 0.454973% |
| B | 12748 | 88 | 0.690304% |
| C | 12748 | 702 | 5.506746% |
| D | 12748 | 796 | 6.244117% |
Noise dominated data is calculated using 1-second bins in cleaned event files. If a bin has >2000 counts, and if more than 50% of those come from <1% of pixels, then it is considered to be noise-dominated and hence unusable.
| Quadrant | # 1 sec bins | Bins with >0 counts | Bins with >2000 counts | High rate bins dominated by noise | Noise dominated (total time) | Noise dominated (detector-on time) | Marked lightcurve |
|---|---|---|---|---|---|---|---|
| A | 13958 | 12750 | 0 | 0 | 0.00% | 0.00% | 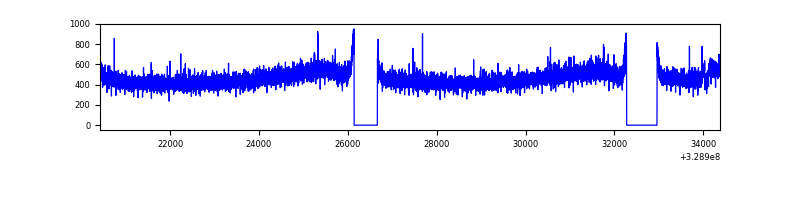 |
| B | 13958 | 12750 | 0 | 0 | 0.00% | 0.00% | 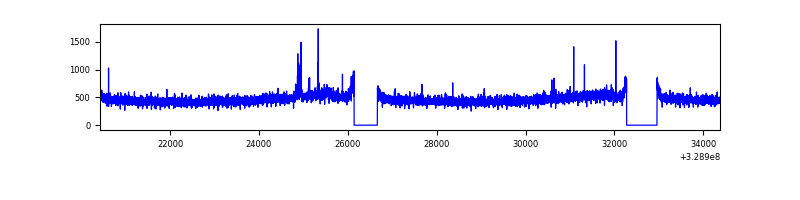 |
| C | 13958 | 12748 | 263 | 263 | 1.88% | 2.06% | 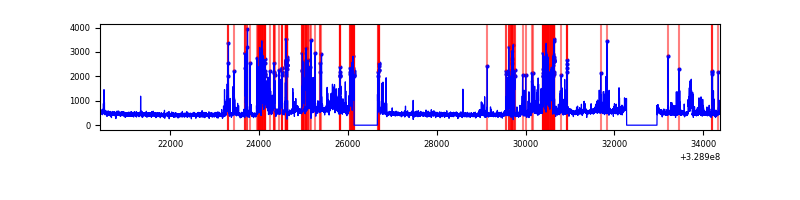 |
| D | 13958 | 12750 | 606 | 606 | 4.34% | 4.75% | 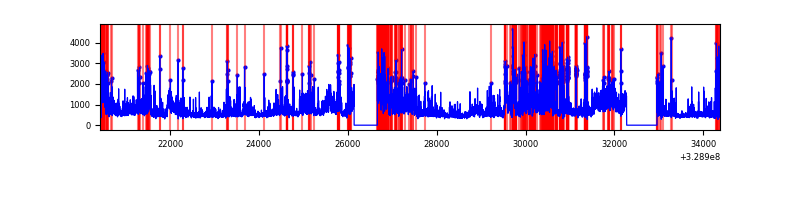 |
Top three noisy pixels from each quadrant. If the there are fewer than three noisy pixels in the level2.evt file, extra rows are filled as -1
| Pixel properties | Quadrant properties | ||||||
|---|---|---|---|---|---|---|---|
| Quadrant | DetID | PixID | Counts | Sigma | Mean | Median | Sigma |
| A | 15 | 173 | 36559 | 115.86 | 1511 | 1480 | 302.8 |
| A | 13 | 254 | 20246 | 61.98 | 1511 | 1480 | 302.8 |
| A | 3 | 137 | 14263 | 42.22 | 1511 | 1480 | 302.8 |
| B | 0 | 190 | 39302 | 132.09 | 1503 | 1467 | 286.4 |
| B | 12 | 111 | 36057 | 120.76 | 1503 | 1467 | 286.4 |
| B | 11 | 111 | 31991 | 106.56 | 1503 | 1467 | 286.4 |
| C | 9 | 54 | 2127837 | 6383.7 | 1433 | 1441 | 333.1 |
| C | 14 | 238 | 227557 | 678.83 | 1433 | 1441 | 333.1 |
| C | 2 | 16 | 21275 | 59.54 | 1433 | 1441 | 333.1 |
| D | 1 | 52 | 3685723 | 10489.52 | 1444 | 1404 | 351.2 |
| D | 8 | 195 | 936114 | 2661.19 | 1444 | 1404 | 351.2 |
| D | 12 | 233 | 208077 | 588.41 | 1444 | 1404 | 351.2 |
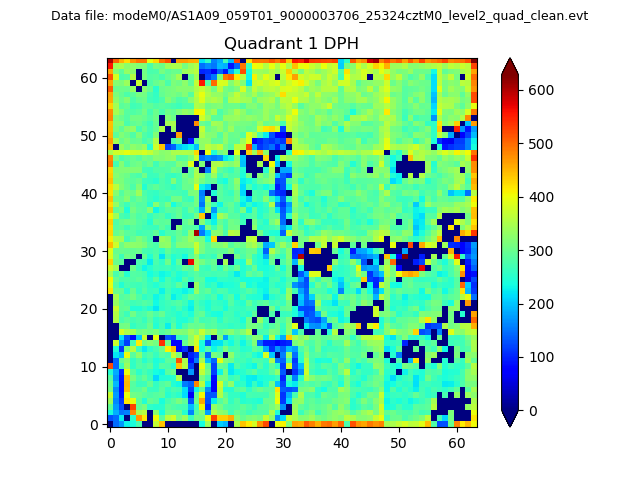
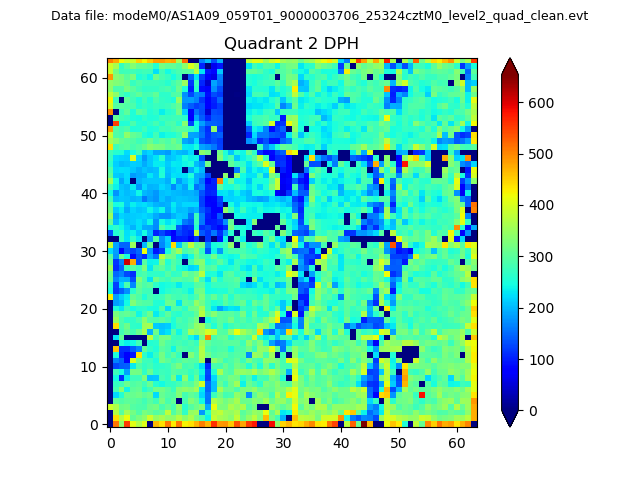
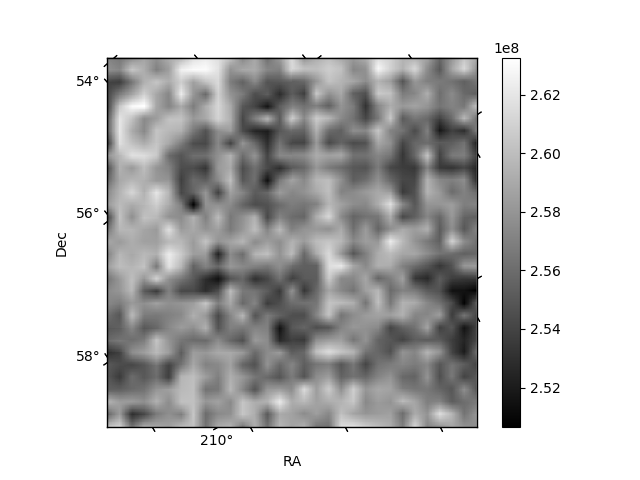
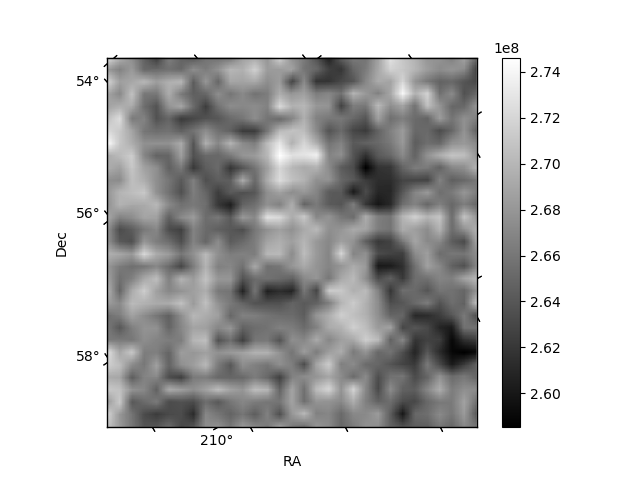
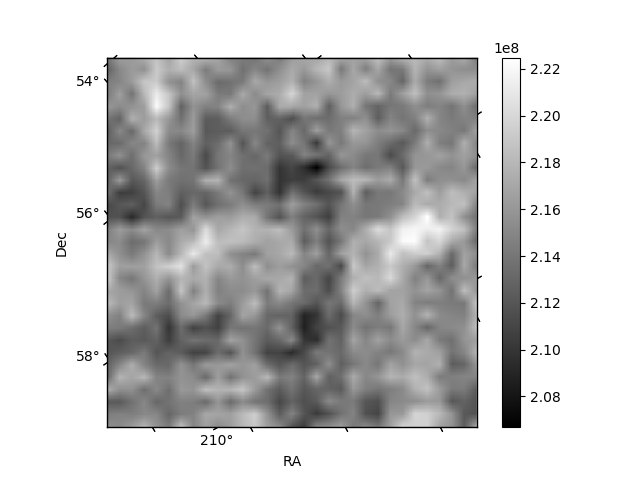
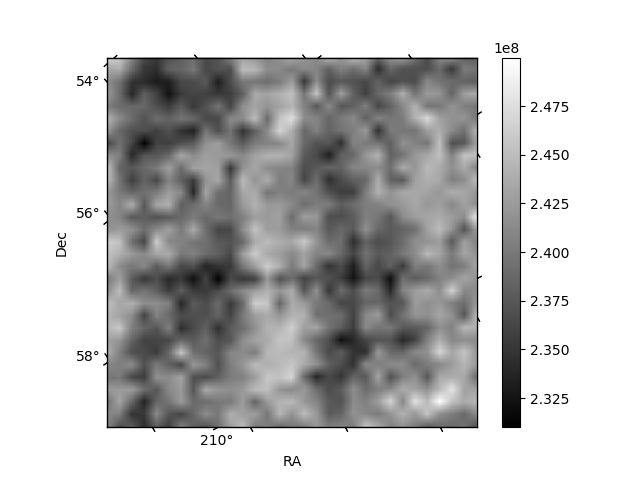
Histogram calculated using DETX and DETY for each event in the final _common_clean file
| Quadrant A |  |
 |
Quadrant B |
|---|---|---|---|
| Quadrant D |  |
 |
Quadrant C |
| Plot type | Count rate plots | Images |
|---|---|---|
| Comparison with Poisson distribution Blue bars denote a histogram of data divided into 1 sec bins. Red curve is a Poisson curve with rate = median count rate of data. |
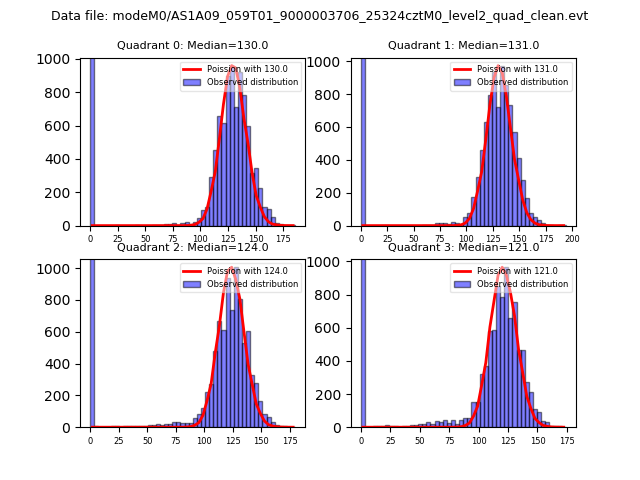 |
 |
| Quadrant-wise count rates Data is divided into 100 sec bins |
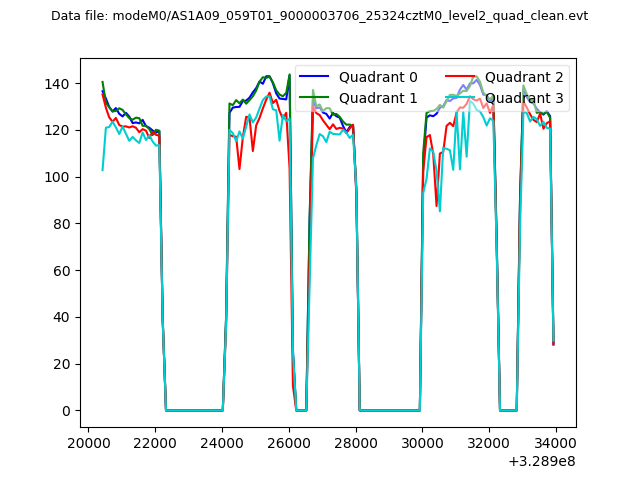 |
|
| Module-wise count rates for Quadrant A Data is divided into 100 sec bins |
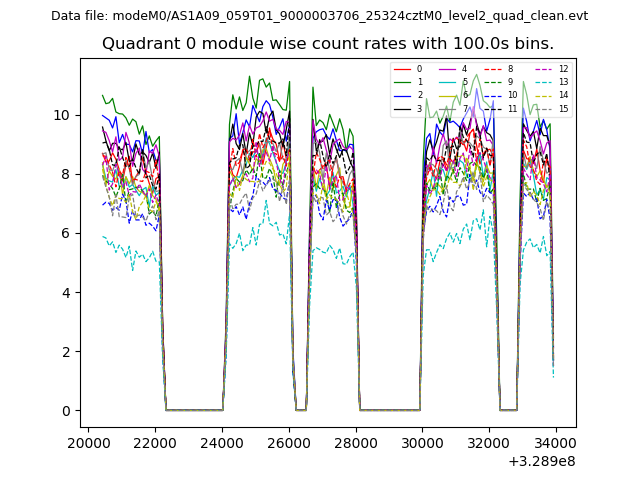 |
 |
| Module-wise count rates for Quadrant B Data is divided into 100 sec bins |
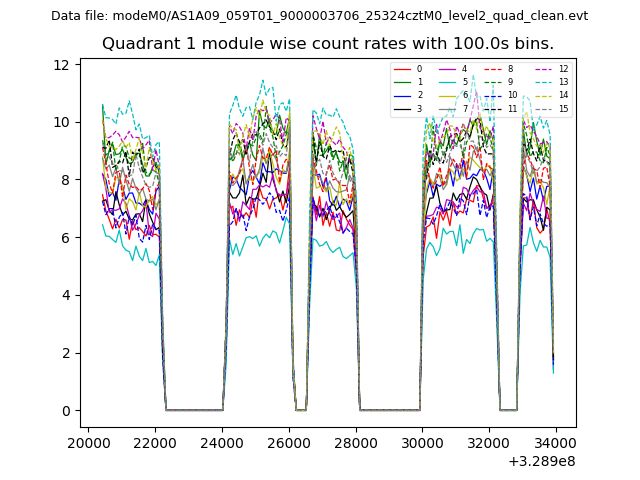 |
 |
| Module-wise count rates for Quadrant C Data is divided into 100 sec bins |
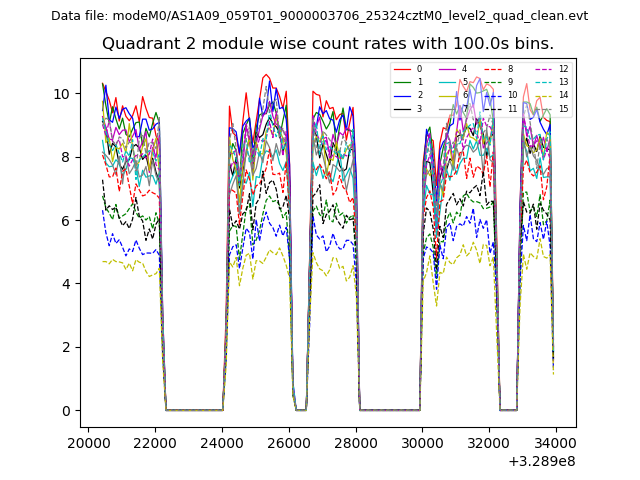 |
 |
| Module-wise count rates for Quadrant D Data is divided into 100 sec bins |
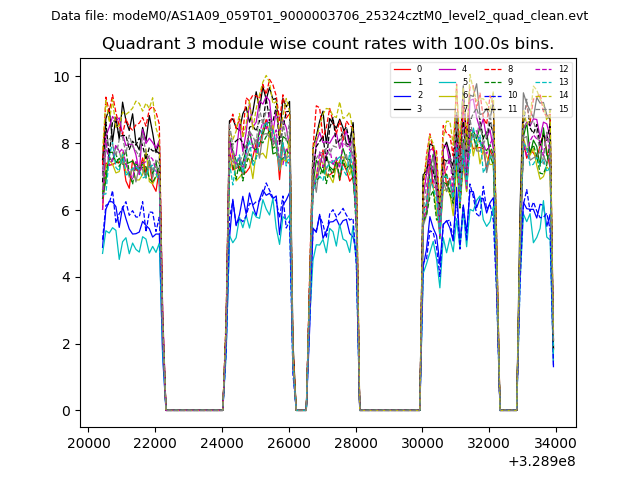 |
 |
| Parameter | Plot |
|---|---|
| CZT HV Monitor | 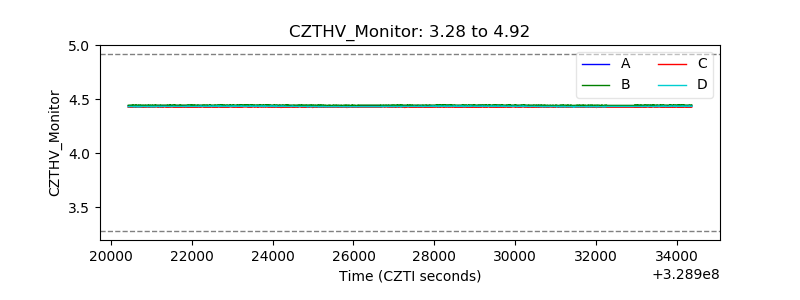 |
| D_VDD | 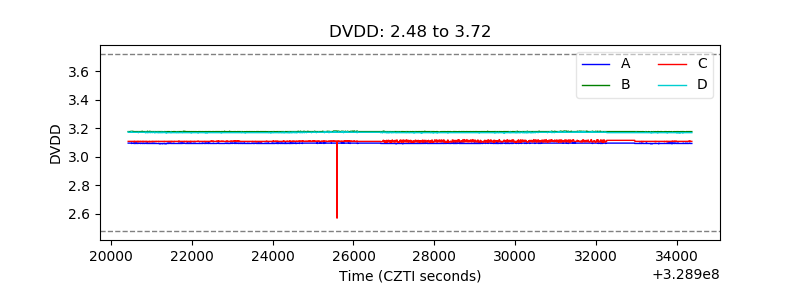 |
| Temperature 1 |  |
| Veto HV Monitor | 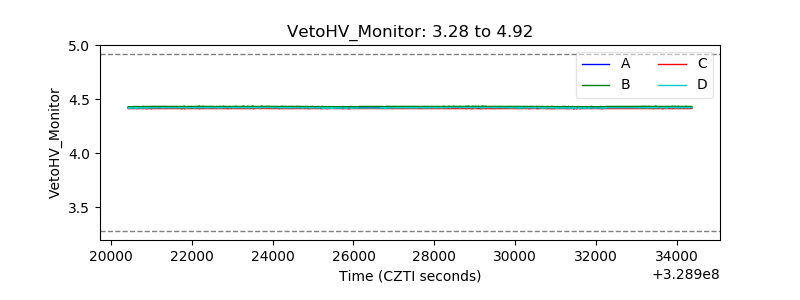 |
| Veto LLD | 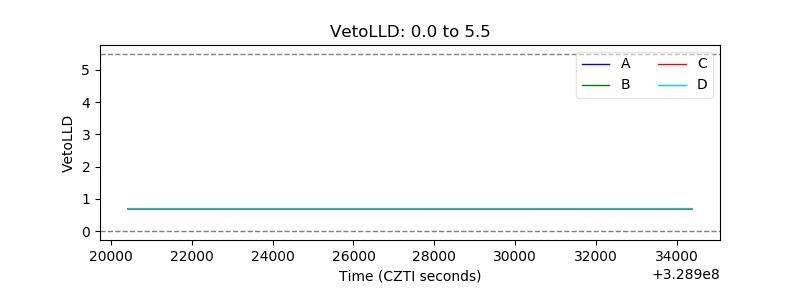 |
| Alpha Counter | 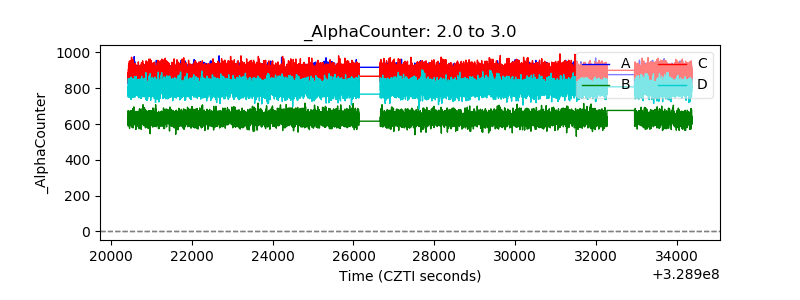 |
| _CPM_Rate | 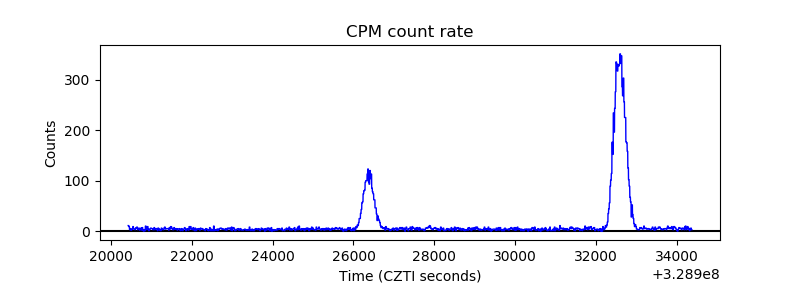 |
| CZT Counter | 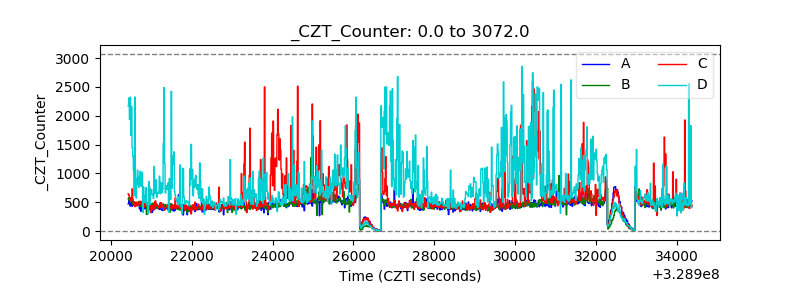 |
| +2.5 Volts monitor |  |
| +5 Volts monitor |  |
| _ROLL_ROT | 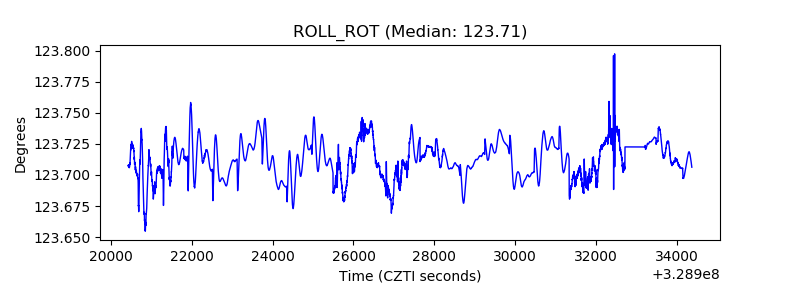 |
| _Roll_DEC | 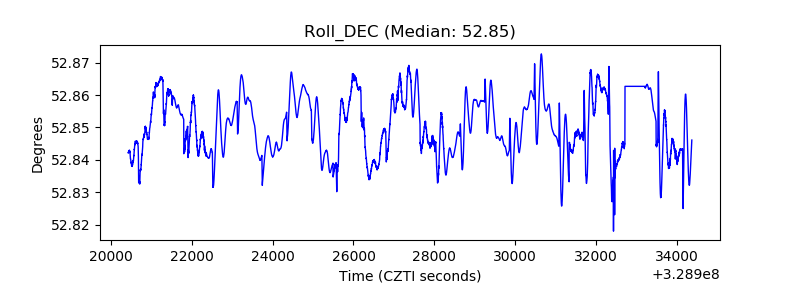 |
| _Roll_RA | 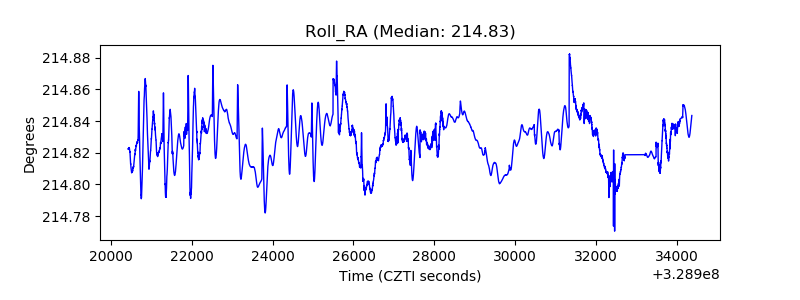 |
| Veto Counter | 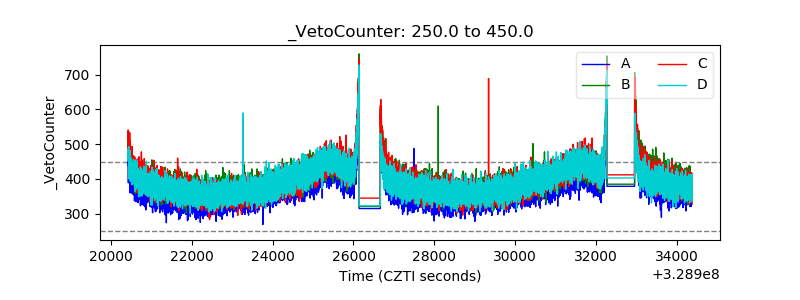 |