| Param | Original file | Final file |
|---|---|---|
| Filename | modeM0/AS1A09_059T01_9000003706_25325cztM0_level2.evt | modeM0/AS1A09_059T01_9000003706_25325cztM0_level2_quad_clean.evt |
| Size (bytes) | 623,387,520 | 96,480,000 |
| Size | 594.5 MB | 92.0 MB |
| Events in quadrant A | 3,956,993 | 618,204 |
| Events in quadrant B | 3,537,697 | 624,236 |
| Events in quadrant C | 5,802,210 | 584,803 |
| Events in quadrant D | 5,082,103 | 580,257 |
| Mode M0 | |||
|---|---|---|---|
| Quadrant | BADHDUFLAG | Total packets | Discarded packets |
| A | 0 | 16194 | 0 |
| B | 0 | 15128 | 0 |
| C | 0 | 22063 | 0 |
| D | 0 | 20071 | 0 |
| Mode M9 | |||
|---|---|---|---|
| Quadrant | BADHDUFLAG | Total packets | Discarded packets |
| A | 0 | 15 | 0 |
| B | 0 | 15 | 0 |
| C | 0 | 15 | 0 |
| D | 0 | 15 | 0 |
| Quadrant | Total seconds | Saturated seconds | Saturation percentage |
|---|---|---|---|
| A | 7382 | 58 | 0.785695% |
| B | 7382 | 76 | 1.029531% |
| C | 7382 | 660 | 8.940666% |
| D | 7382 | 165 | 2.235167% |
Noise dominated data is calculated using 1-second bins in cleaned event files. If a bin has >2000 counts, and if more than 50% of those come from <1% of pixels, then it is considered to be noise-dominated and hence unusable.
| Quadrant | # 1 sec bins | Bins with >0 counts | Bins with >2000 counts | High rate bins dominated by noise | Noise dominated (total time) | Noise dominated (detector-on time) | Marked lightcurve |
|---|---|---|---|---|---|---|---|
| A | 8942 | 7384 | 0 | 0 | 0.00% | 0.00% | 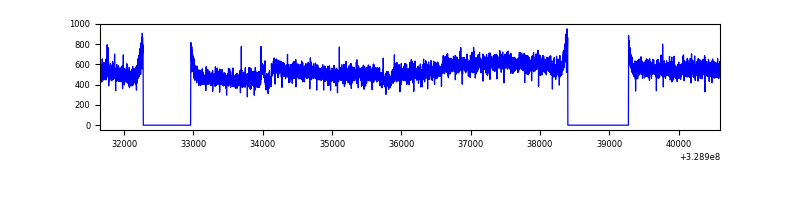 |
| B | 8942 | 7383 | 2 | 2 | 0.02% | 0.03% | 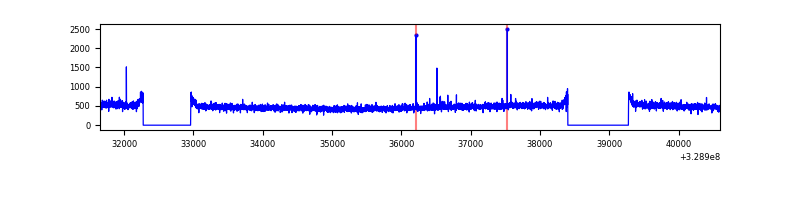 |
| C | 8942 | 7383 | 254 | 254 | 2.84% | 3.44% | 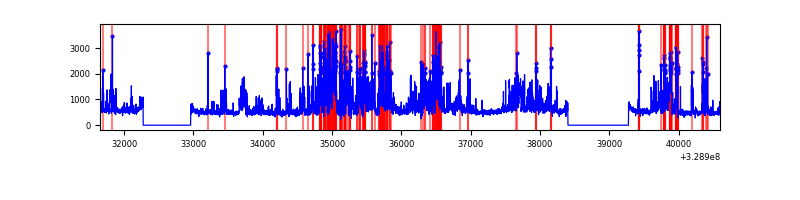 |
| D | 8942 | 7384 | 87 | 87 | 0.97% | 1.18% | 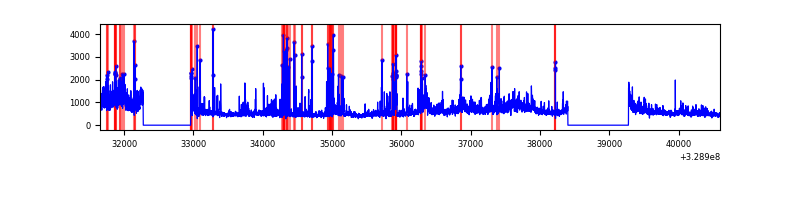 |
Top three noisy pixels from each quadrant. If the there are fewer than three noisy pixels in the level2.evt file, extra rows are filled as -1
| Pixel properties | Quadrant properties | ||||||
|---|---|---|---|---|---|---|---|
| Quadrant | DetID | PixID | Counts | Sigma | Mean | Median | Sigma |
| A | 15 | 173 | 482776 | 2658.48 | 901 | 881 | 181.3 |
| A | 13 | 254 | 11280 | 57.37 | 901 | 881 | 181.3 |
| A | 3 | 137 | 8437 | 41.68 | 901 | 881 | 181.3 |
| B | 12 | 111 | 21669 | 120.31 | 897 | 873 | 172.9 |
| B | 11 | 111 | 18950 | 104.58 | 897 | 873 | 172.9 |
| B | 14 | 111 | 17373 | 95.45 | 897 | 873 | 172.9 |
| C | 9 | 54 | 2332371 | 11597.38 | 852 | 857 | 201.0 |
| C | 14 | 238 | 134788 | 666.2 | 852 | 857 | 201.0 |
| C | 2 | 16 | 11844 | 54.65 | 852 | 857 | 201.0 |
| D | 8 | 195 | 976098 | 4619.69 | 874 | 850 | 211.1 |
| D | 1 | 52 | 607451 | 2873.43 | 874 | 850 | 211.1 |
| D | 12 | 235 | 70847 | 331.57 | 874 | 850 | 211.1 |
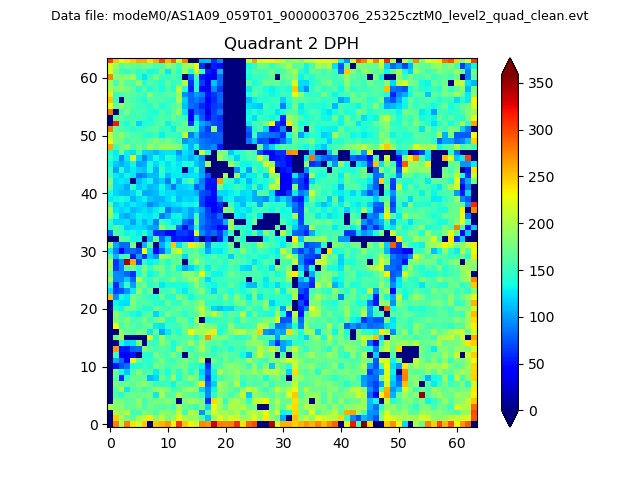
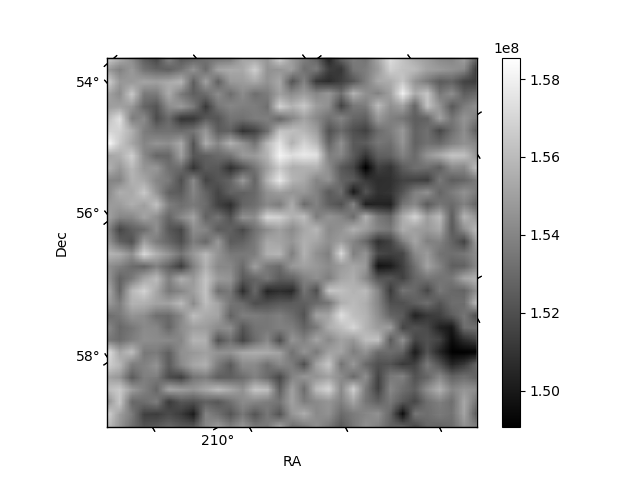
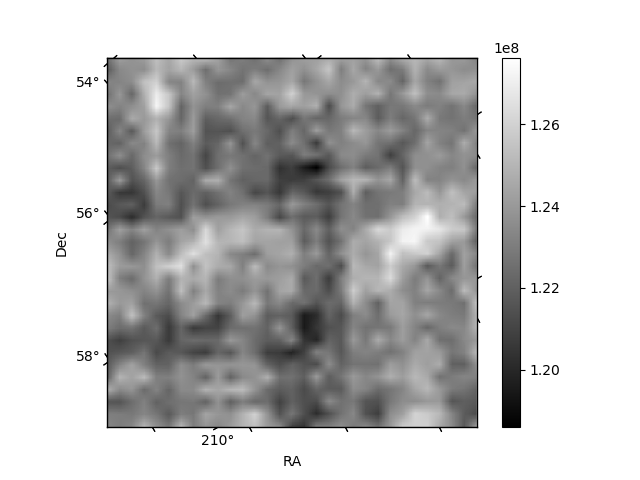
Histogram calculated using DETX and DETY for each event in the final _common_clean file
| Quadrant A | 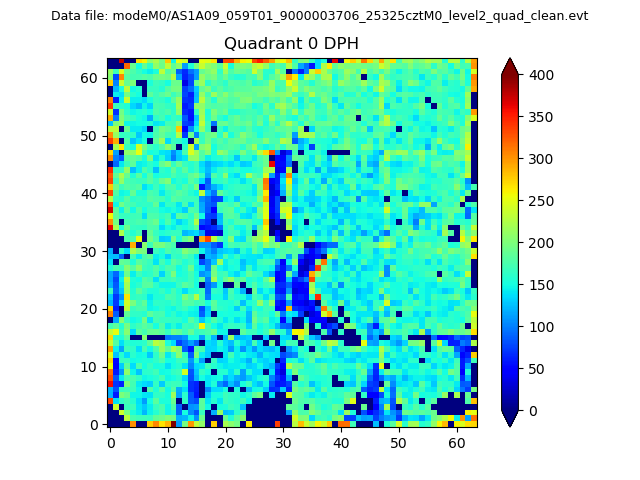 |
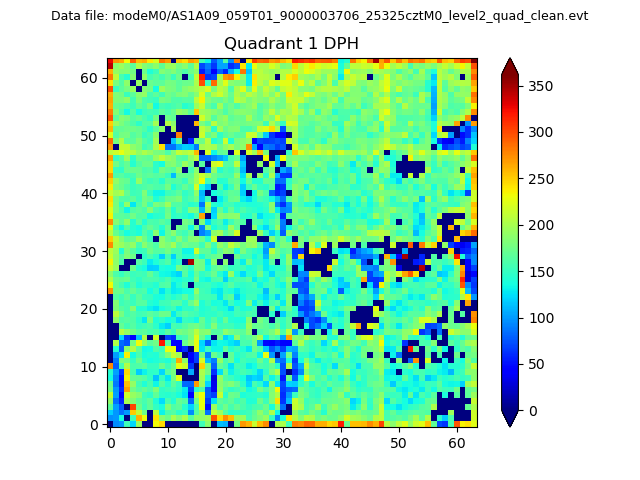 |
Quadrant B |
|---|---|---|---|
| Quadrant D | 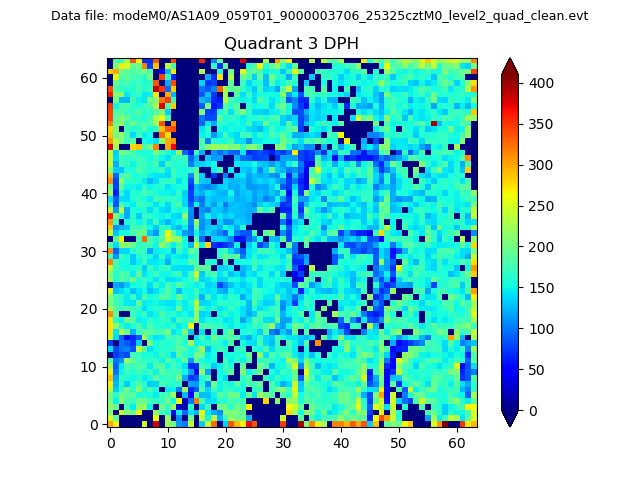 |
 |
Quadrant C |
| Plot type | Count rate plots | Images |
|---|---|---|
| Comparison with Poisson distribution Blue bars denote a histogram of data divided into 1 sec bins. Red curve is a Poisson curve with rate = median count rate of data. |
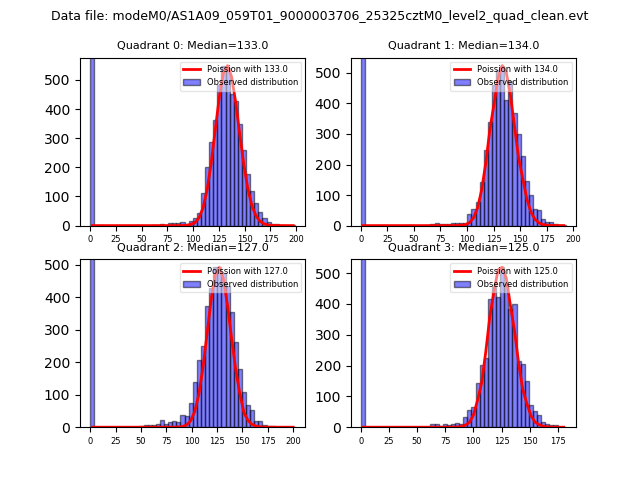 |
 |
| Quadrant-wise count rates Data is divided into 100 sec bins |
 |
|
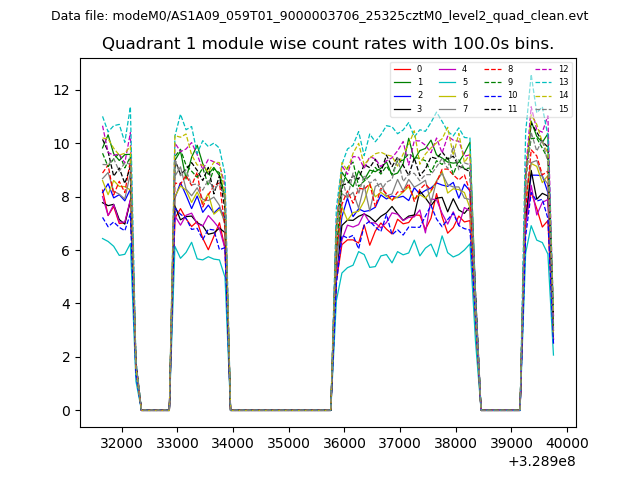
| Module-wise count rates for Quadrant A Data is divided into 100 sec bins |
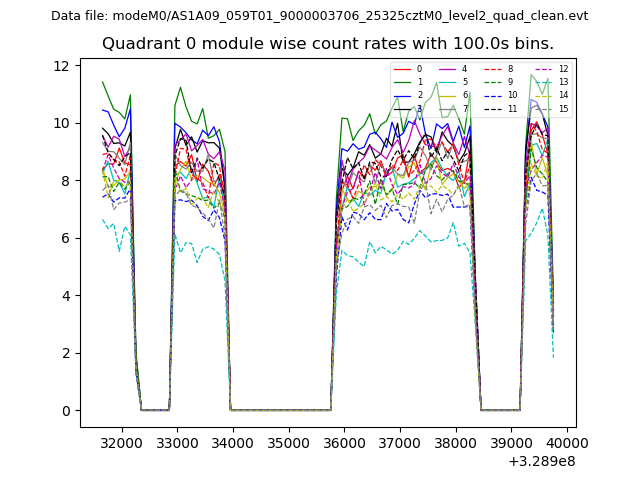 |
 |
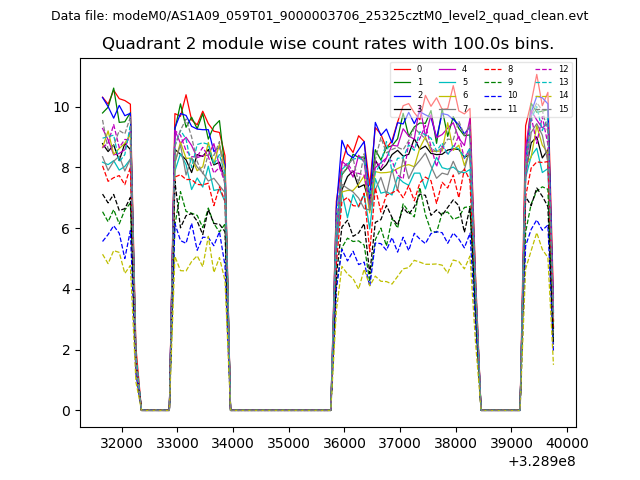
| Module-wise count rates for Quadrant B Data is divided into 100 sec bins |
 |
 |
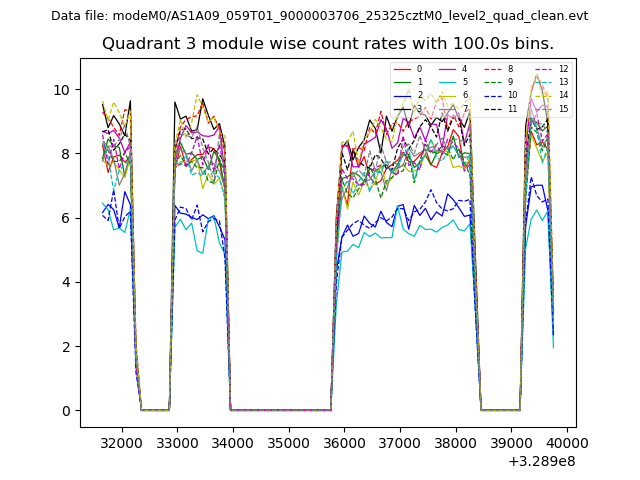
| Module-wise count rates for Quadrant C Data is divided into 100 sec bins |
 |
 |
| Module-wise count rates for Quadrant D Data is divided into 100 sec bins |
 |
 |
| Parameter | Plot |
|---|---|
| CZT HV Monitor | 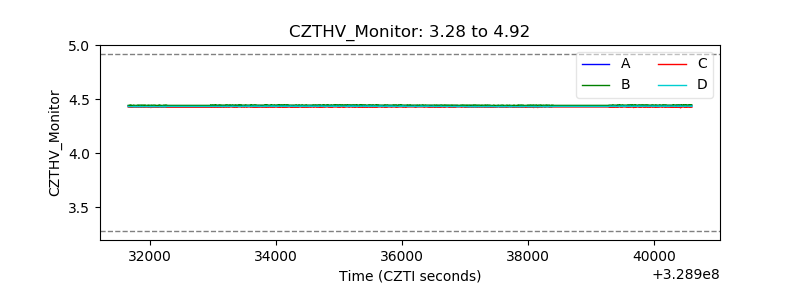 |
| D_VDD | 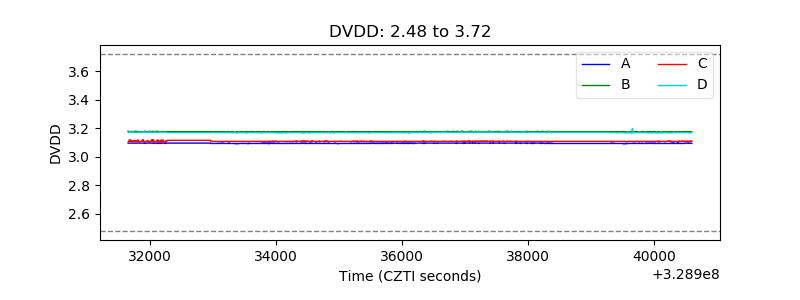 |
| Temperature 1 | 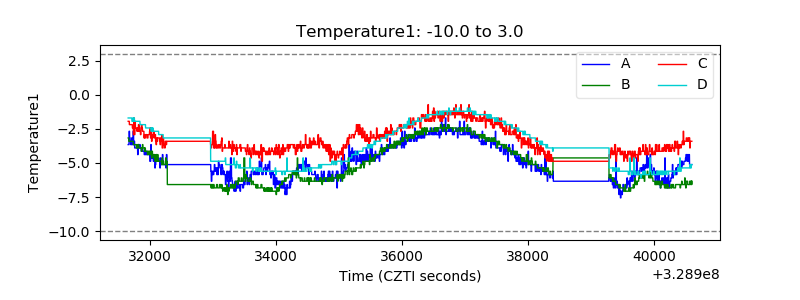 |
| Veto HV Monitor | 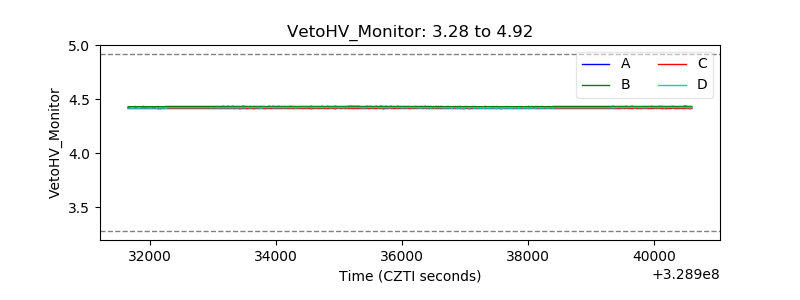 |
| Veto LLD | 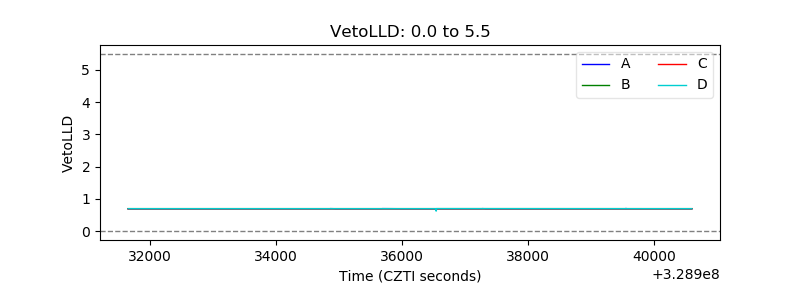 |
| Alpha Counter | 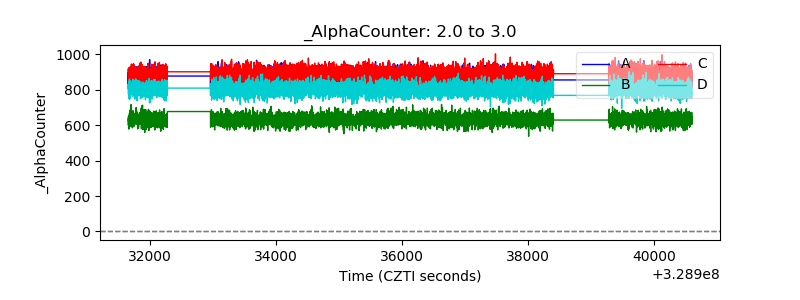 |
| _CPM_Rate | 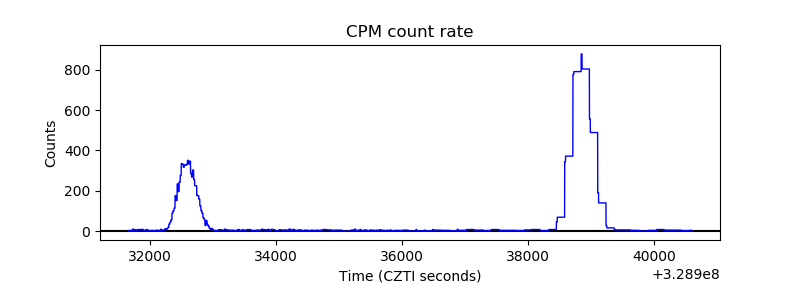 |
| CZT Counter | 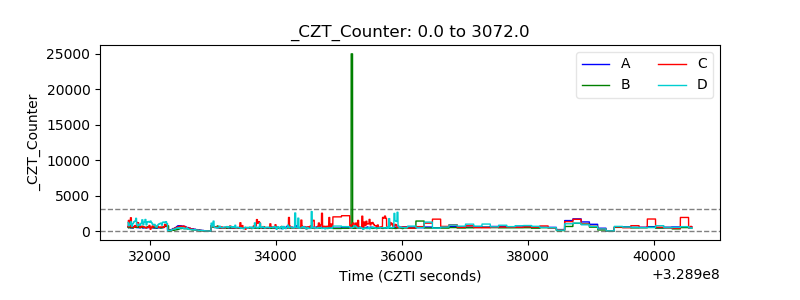 |
| +2.5 Volts monitor |  |
| +5 Volts monitor |  |
| _ROLL_ROT | 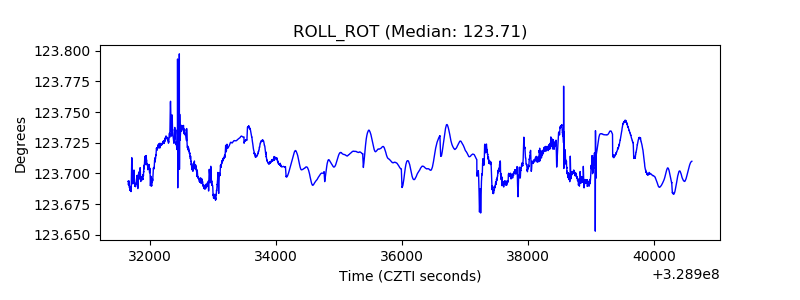 |
| _Roll_DEC | 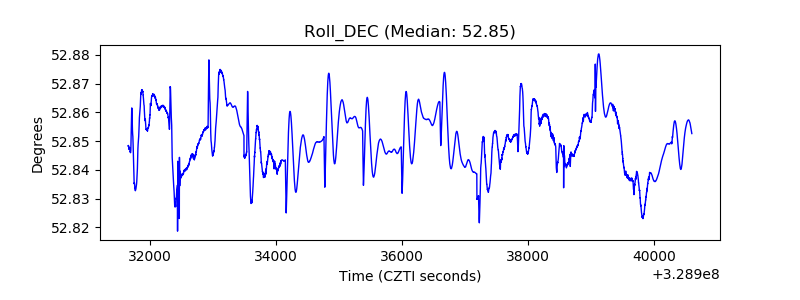 |
| _Roll_RA | 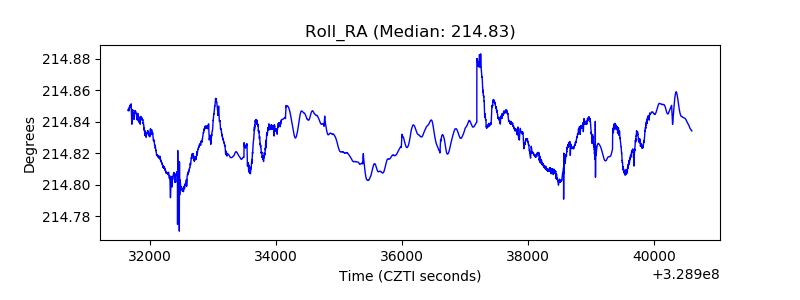 |
| Veto Counter | 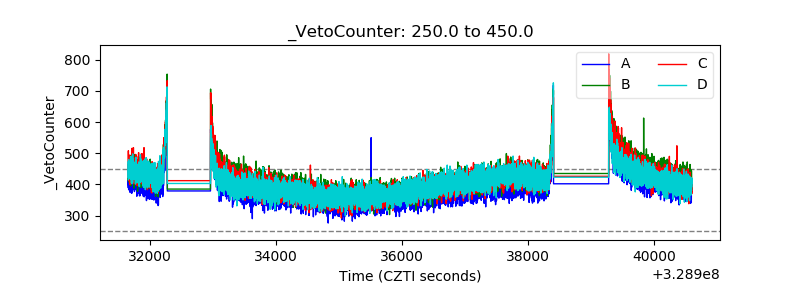 |