| Param | Original file | Final file |
|---|---|---|
| Filename | modeM0/AS1A09_059T01_9000003706_25326cztM0_level2.evt | modeM0/AS1A09_059T01_9000003706_25326cztM0_level2_quad_clean.evt |
| Size (bytes) | 549,875,520 | 74,629,440 |
| Size | 524.4 MB | 71.2 MB |
| Events in quadrant A | 3,886,545 | 459,654 |
| Events in quadrant B | 3,279,206 | 466,998 |
| Events in quadrant C | 5,050,444 | 435,961 |
| Events in quadrant D | 3,984,683 | 431,913 |
| Mode M0 | |||
|---|---|---|---|
| Quadrant | BADHDUFLAG | Total packets | Discarded packets |
| A | 0 | 15839 | 0 |
| B | 0 | 13864 | 0 |
| C | 0 | 19339 | 0 |
| D | 0 | 16183 | 0 |
| Mode M9 | |||
|---|---|---|---|
| Quadrant | BADHDUFLAG | Total packets | Discarded packets |
| A | 0 | 13 | 0 |
| B | 0 | 14 | 0 |
| C | 0 | 14 | 0 |
| D | 0 | 14 | 0 |
| Quadrant | Total seconds | Saturated seconds | Saturation percentage |
|---|---|---|---|
| A | 6671 | 84 | 1.259182% |
| B | 6670 | 94 | 1.409295% |
| C | 6668 | 616 | 9.238152% |
| D | 6667 | 95 | 1.424929% |
Noise dominated data is calculated using 1-second bins in cleaned event files. If a bin has >2000 counts, and if more than 50% of those come from <1% of pixels, then it is considered to be noise-dominated and hence unusable.
| Quadrant | # 1 sec bins | Bins with >0 counts | Bins with >2000 counts | High rate bins dominated by noise | Noise dominated (total time) | Noise dominated (detector-on time) | Marked lightcurve |
|---|---|---|---|---|---|---|---|
| A | 7671 | 6671 | 0 | 0 | 0.00% | 0.00% | 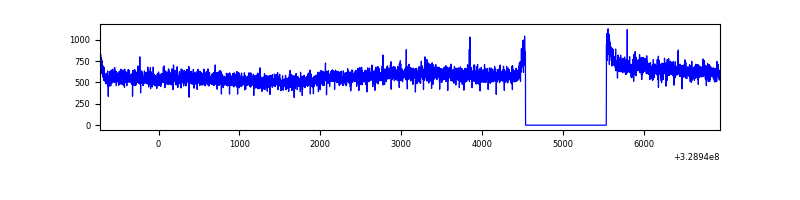 |
| B | 7670 | 6670 | 0 | 0 | 0.00% | 0.00% | 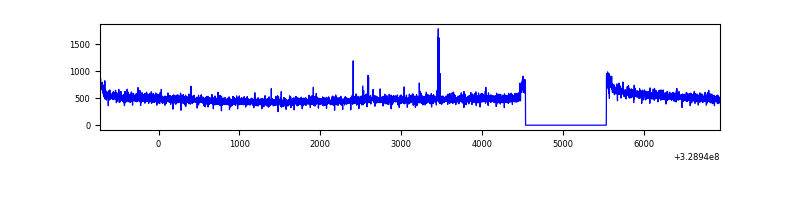 |
| C | 7670 | 6671 | 298 | 298 | 3.89% | 4.47% | 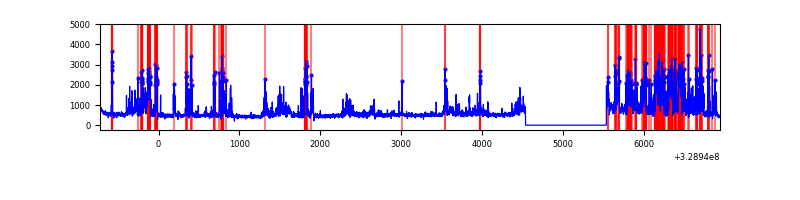 |
| D | 7670 | 6671 | 28 | 28 | 0.37% | 0.42% | 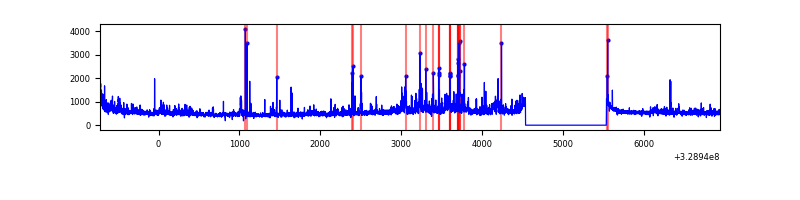 |
Top three noisy pixels from each quadrant. If the there are fewer than three noisy pixels in the level2.evt file, extra rows are filled as -1
| Pixel properties | Quadrant properties | ||||||
|---|---|---|---|---|---|---|---|
| Quadrant | DetID | PixID | Counts | Sigma | Mean | Median | Sigma |
| A | 15 | 173 | 647135 | 3837.77 | 840 | 823 | 168.4 |
| A | 13 | 254 | 9578 | 51.99 | 840 | 823 | 168.4 |
| A | 3 | 137 | 7556 | 39.98 | 840 | 823 | 168.4 |
| B | 12 | 111 | 19813 | 118.71 | 834 | 811 | 160.1 |
| B | 11 | 111 | 17709 | 105.57 | 834 | 811 | 160.1 |
| B | 14 | 111 | 16272 | 96.59 | 834 | 811 | 160.1 |
| C | 9 | 54 | 1883142 | 10474.33 | 776 | 782 | 179.7 |
| C | 14 | 238 | 123553 | 683.15 | 776 | 782 | 179.7 |
| C | 3 | 233 | 8910 | 45.23 | 776 | 782 | 179.7 |
| D | 8 | 195 | 457737 | 2331.57 | 809 | 787 | 196.0 |
| D | 1 | 52 | 333402 | 1697.15 | 809 | 787 | 196.0 |
| D | 12 | 235 | 69521 | 350.71 | 809 | 787 | 196.0 |
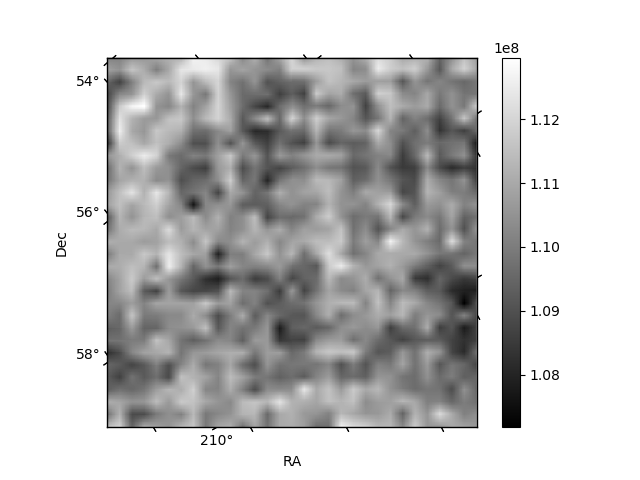
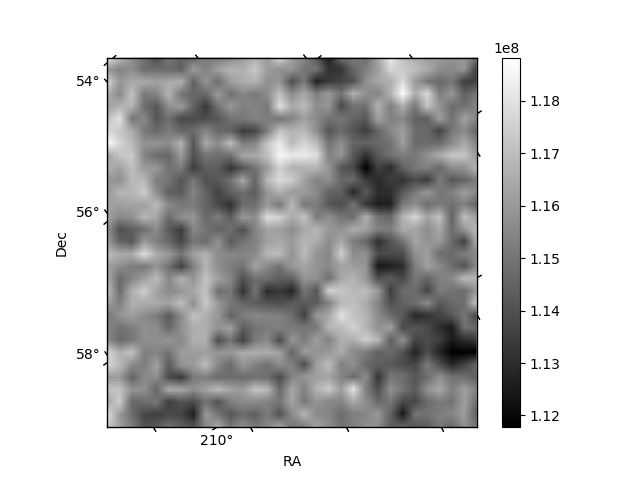
Histogram calculated using DETX and DETY for each event in the final _common_clean file
| Quadrant A | 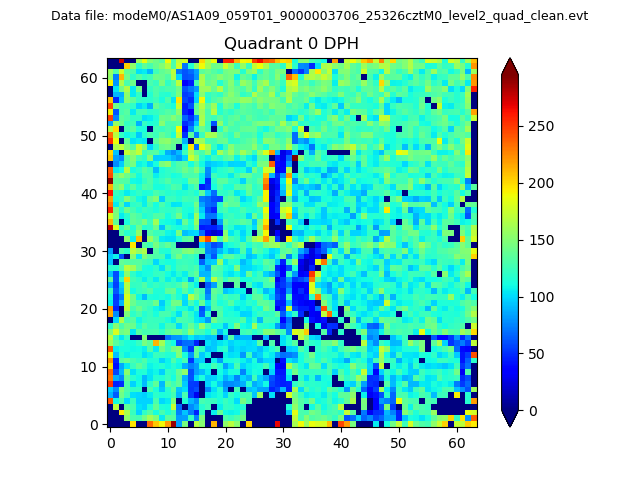 |
 |
Quadrant B |
|---|---|---|---|
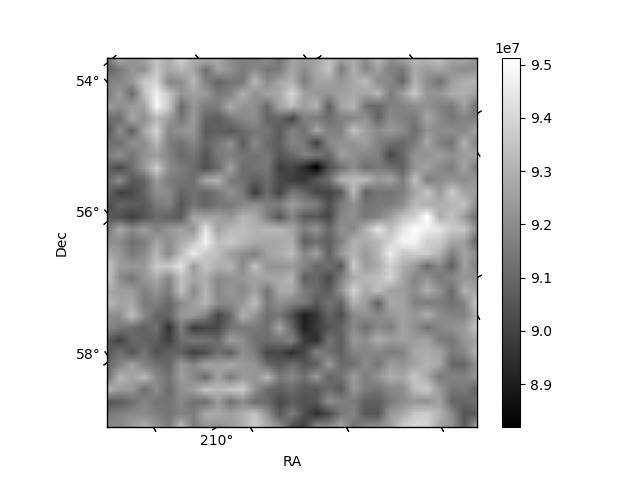
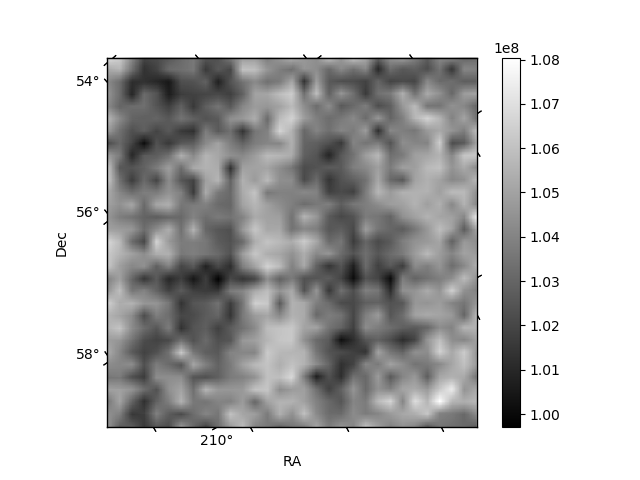
| Quadrant D | 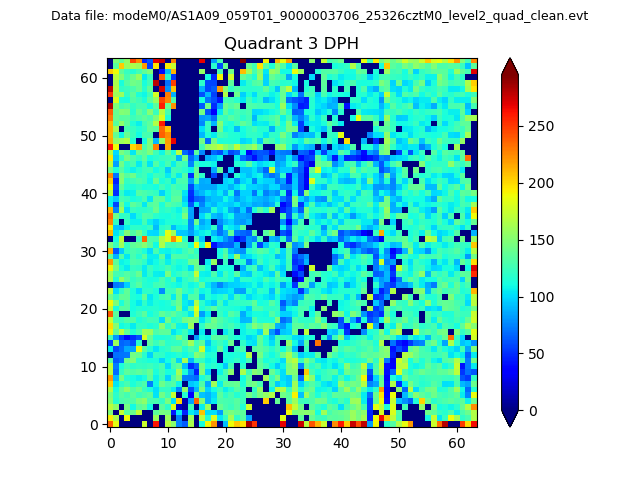 |
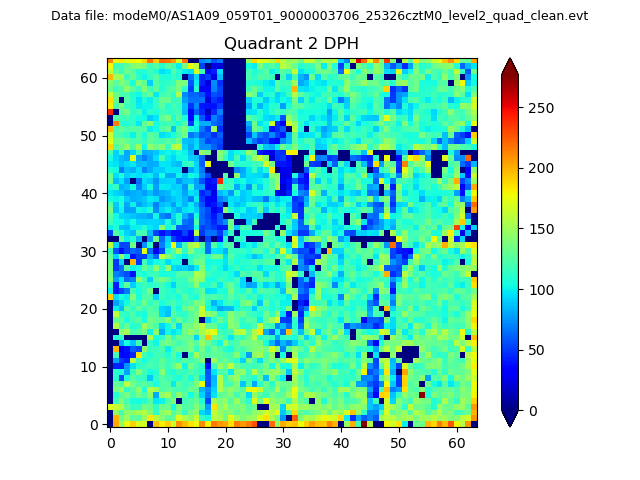 |
Quadrant C |
| Plot type | Count rate plots | Images |
|---|---|---|
| Comparison with Poisson distribution Blue bars denote a histogram of data divided into 1 sec bins. Red curve is a Poisson curve with rate = median count rate of data. |
 |
 |
| Quadrant-wise count rates Data is divided into 100 sec bins |
 |
|
| Module-wise count rates for Quadrant A Data is divided into 100 sec bins |
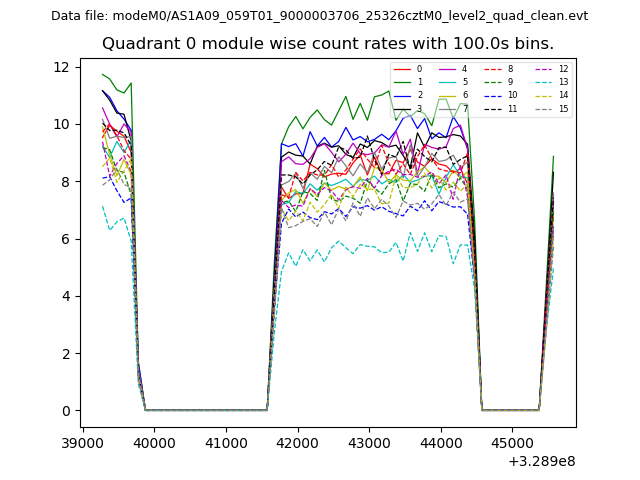 |
 |
| Module-wise count rates for Quadrant B Data is divided into 100 sec bins |
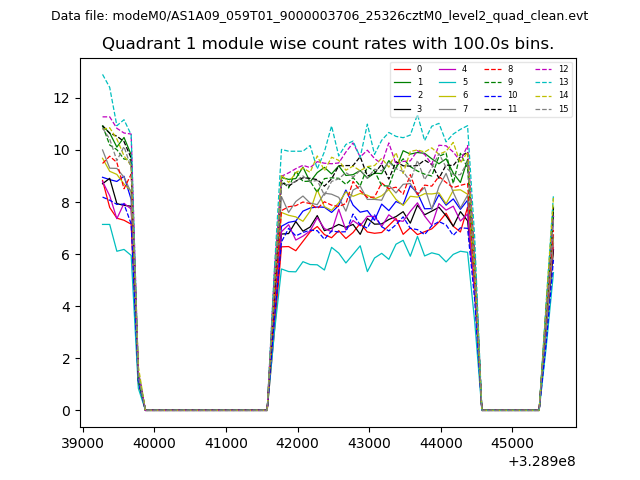 |
 |
| Module-wise count rates for Quadrant C Data is divided into 100 sec bins |
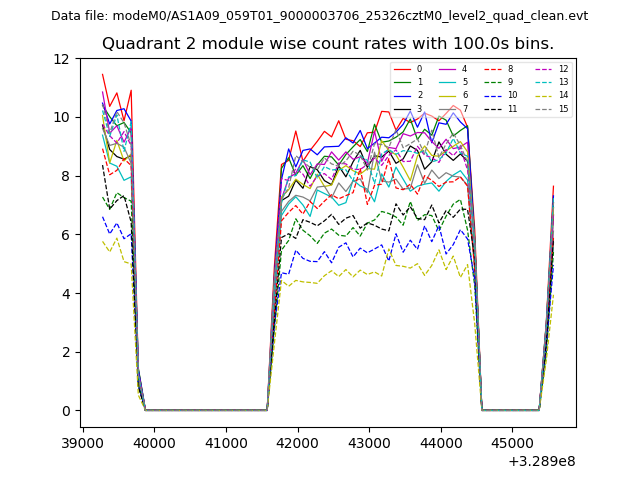 |
 |
| Module-wise count rates for Quadrant D Data is divided into 100 sec bins |
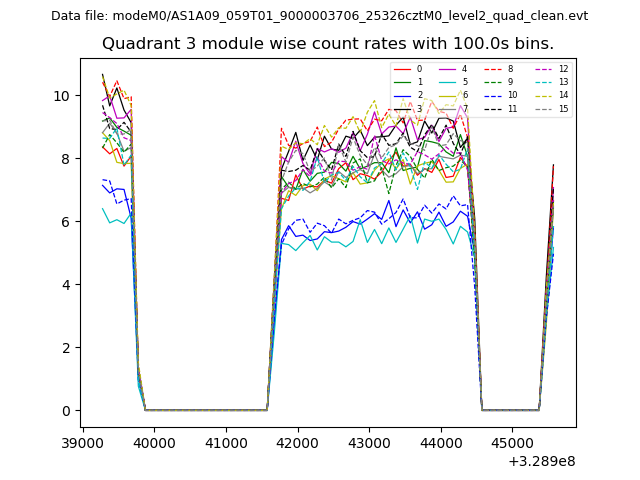 |
 |
| Parameter | Plot |
|---|---|
| CZT HV Monitor | 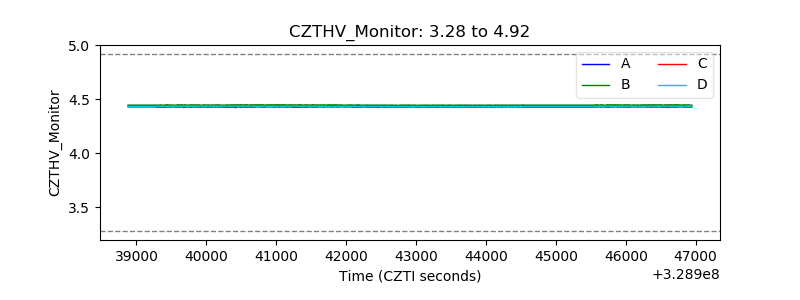 |
| D_VDD | 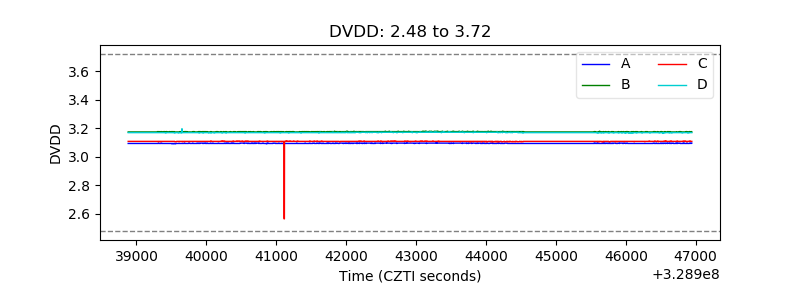 |
| Temperature 1 | 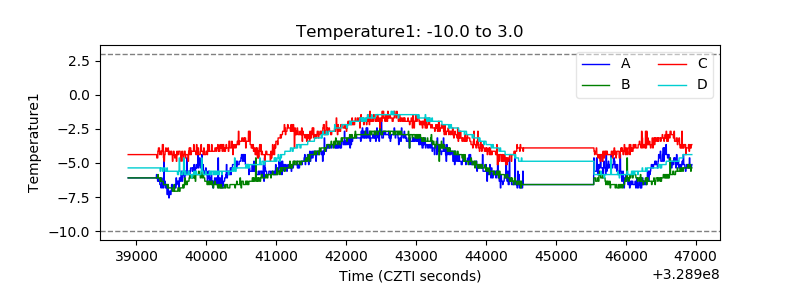 |
| Veto HV Monitor | 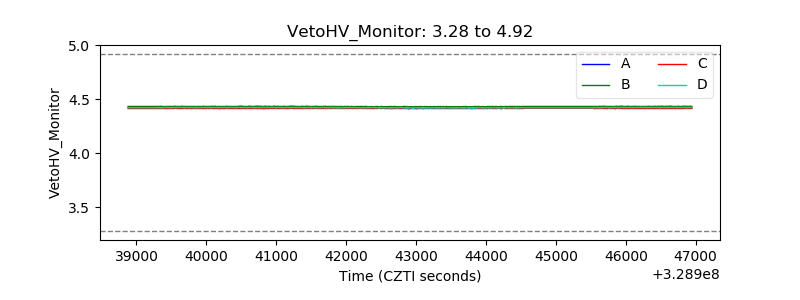 |
| Veto LLD | 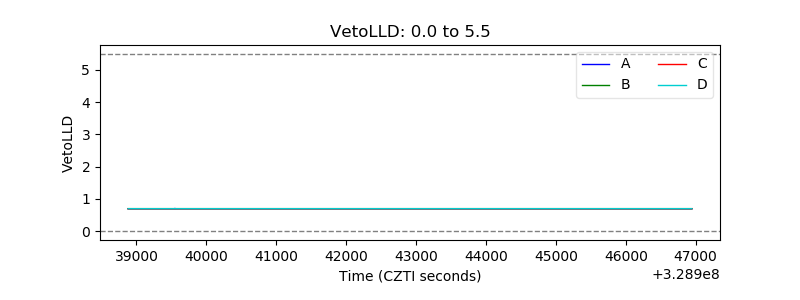 |
| Alpha Counter |  |
| _CPM_Rate |  |
| CZT Counter | 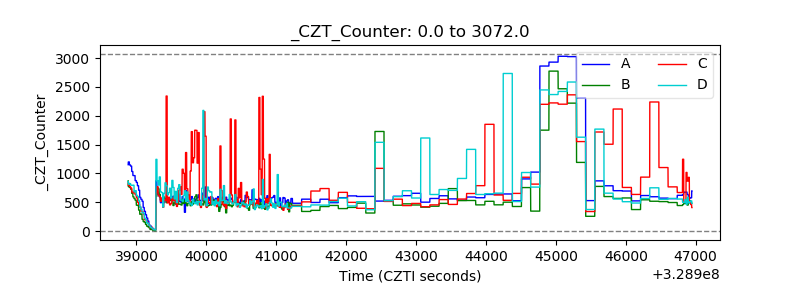 |
| +2.5 Volts monitor |  |
| +5 Volts monitor |  |
| _ROLL_ROT | 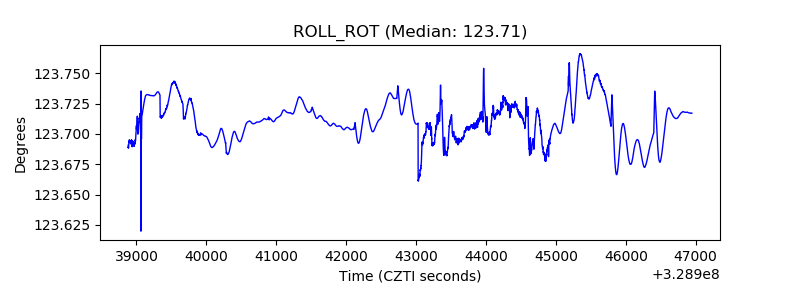 |
| _Roll_DEC | 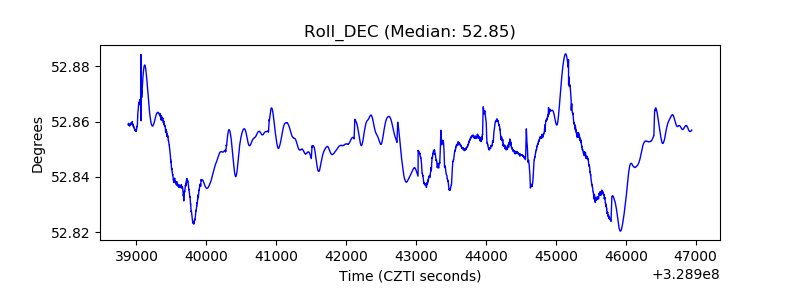 |
| _Roll_RA | 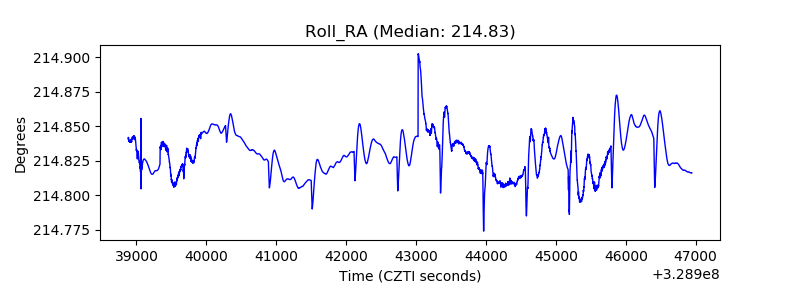 |
| Veto Counter | 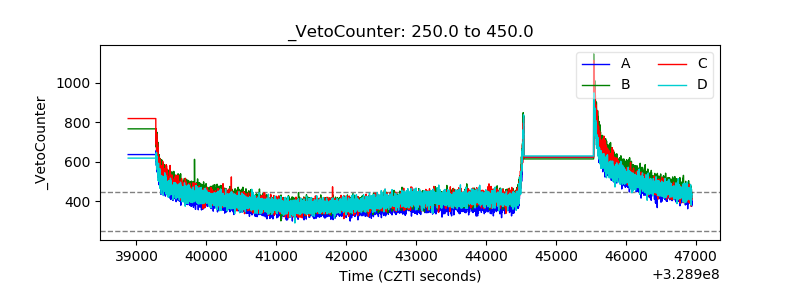 |