| Param | Original file | Final file |
|---|---|---|
| Filename | modeM0/AS1A09_059T01_9000003706_25328cztM0_level2.evt | modeM0/AS1A09_059T01_9000003706_25328cztM0_level2_quad_clean.evt |
| Size (bytes) | 524,459,520 | 71,392,320 |
| Size | 500.2 MB | 68.1 MB |
| Events in quadrant A | 3,651,247 | 441,976 |
| Events in quadrant B | 3,345,522 | 445,005 |
| Events in quadrant C | 4,333,930 | 416,588 |
| Events in quadrant D | 4,117,282 | 410,260 |
| Mode M0 | |||
|---|---|---|---|
| Quadrant | BADHDUFLAG | Total packets | Discarded packets |
| A | 0 | 15202 | 0 |
| B | 0 | 13924 | 0 |
| C | 0 | 16964 | 0 |
| D | 0 | 16560 | 0 |
| Mode M9 | |||
|---|---|---|---|
| Quadrant | BADHDUFLAG | Total packets | Discarded packets |
| A | 0 | 17 | 0 |
| B | 0 | 18 | 0 |
| C | 0 | 18 | 0 |
| D | 0 | 18 | 0 |
| Quadrant | Total seconds | Saturated seconds | Saturation percentage |
|---|---|---|---|
| A | 6413 | 106 | 1.652893% |
| B | 6413 | 112 | 1.746453% |
| C | 6412 | 497 | 7.751092% |
| D | 6412 | 102 | 1.590767% |
Noise dominated data is calculated using 1-second bins in cleaned event files. If a bin has >2000 counts, and if more than 50% of those come from <1% of pixels, then it is considered to be noise-dominated and hence unusable.
| Quadrant | # 1 sec bins | Bins with >0 counts | Bins with >2000 counts | High rate bins dominated by noise | Noise dominated (total time) | Noise dominated (detector-on time) | Marked lightcurve |
|---|---|---|---|---|---|---|---|
| A | 7563 | 6413 | 0 | 0 | 0.00% | 0.00% | 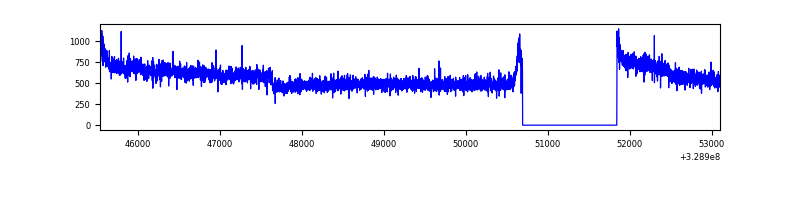 |
| B | 7563 | 6413 | 1 | 1 | 0.01% | 0.02% | 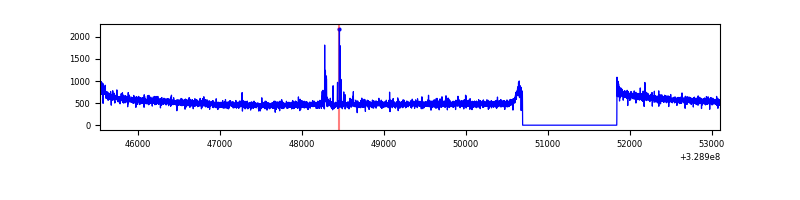 |
| C | 7562 | 6412 | 223 | 223 | 2.95% | 3.48% | 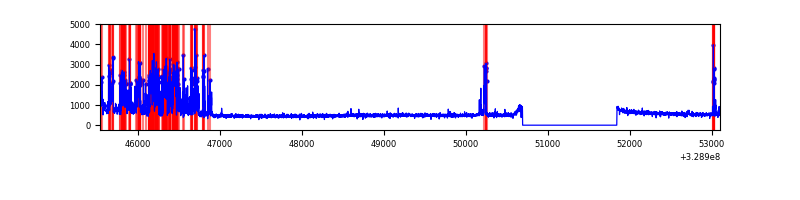 |
| D | 7562 | 6412 | 20 | 20 | 0.26% | 0.31% | 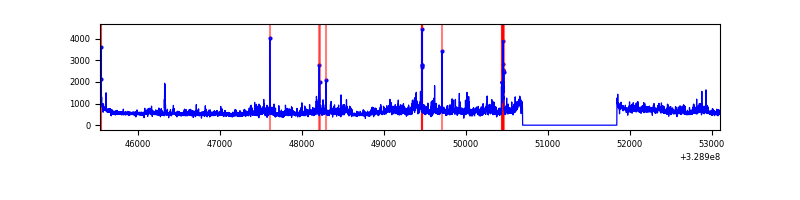 |
Top three noisy pixels from each quadrant. If the there are fewer than three noisy pixels in the level2.evt file, extra rows are filled as -1
| Pixel properties | Quadrant properties | ||||||
|---|---|---|---|---|---|---|---|
| Quadrant | DetID | PixID | Counts | Sigma | Mean | Median | Sigma |
| A | 15 | 173 | 346710 | 2038.04 | 858 | 843 | 169.7 |
| A | 13 | 254 | 9779 | 52.66 | 858 | 843 | 169.7 |
| A | 3 | 137 | 7406 | 38.67 | 858 | 843 | 169.7 |
| B | 3 | 112 | 29111 | 176.81 | 847 | 826 | 160.0 |
| B | 12 | 111 | 19334 | 115.7 | 847 | 826 | 160.0 |
| B | 11 | 111 | 17507 | 104.28 | 847 | 826 | 160.0 |
| C | 9 | 54 | 1116249 | 6173.36 | 788 | 796 | 180.7 |
| C | 14 | 238 | 127096 | 698.99 | 788 | 796 | 180.7 |
| C | 3 | 233 | 13561 | 70.64 | 788 | 796 | 180.7 |
| D | 8 | 195 | 827435 | 4200.73 | 820 | 797 | 196.8 |
| D | 12 | 233 | 56564 | 283.39 | 820 | 797 | 196.8 |
| D | 1 | 52 | 49684 | 248.43 | 820 | 797 | 196.8 |
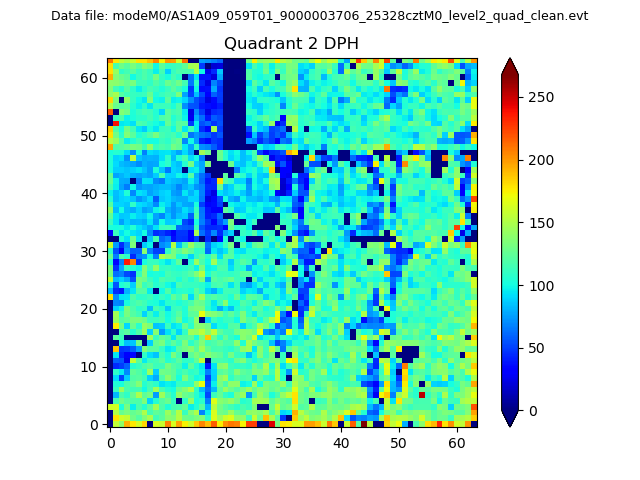
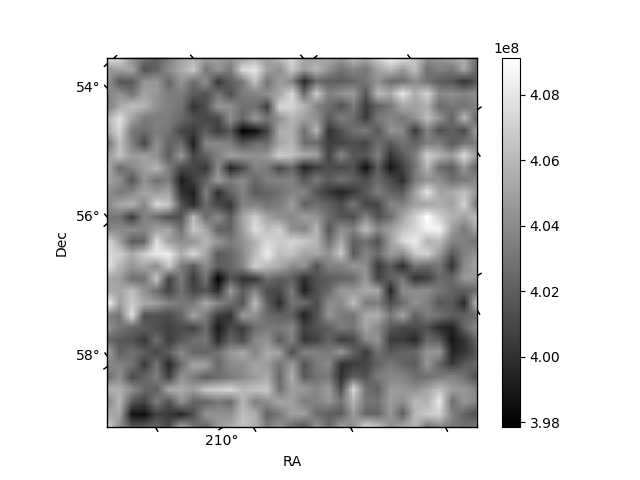
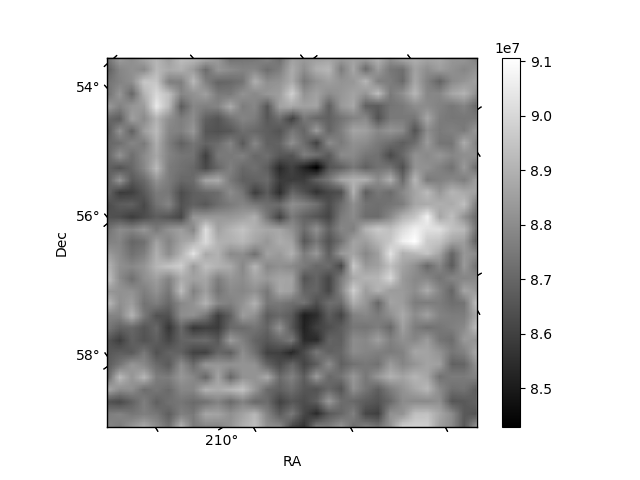
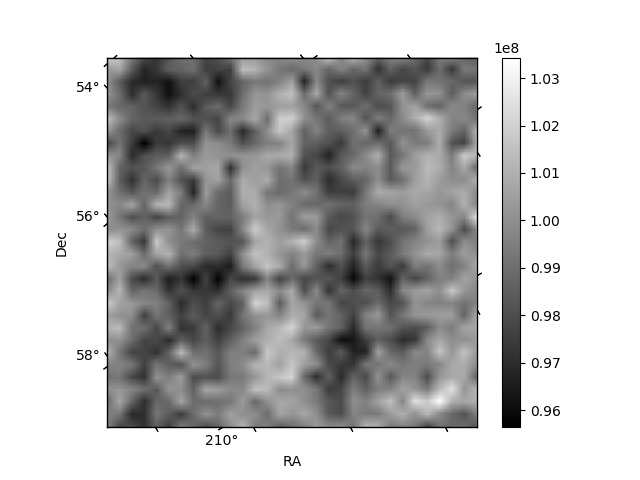
Histogram calculated using DETX and DETY for each event in the final _common_clean file
| Quadrant A | 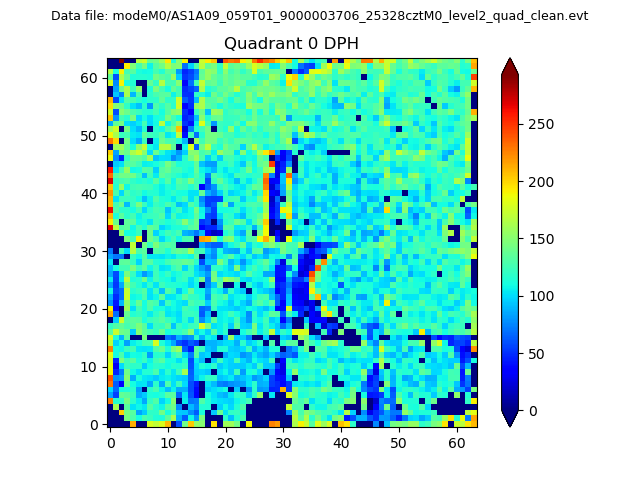 |
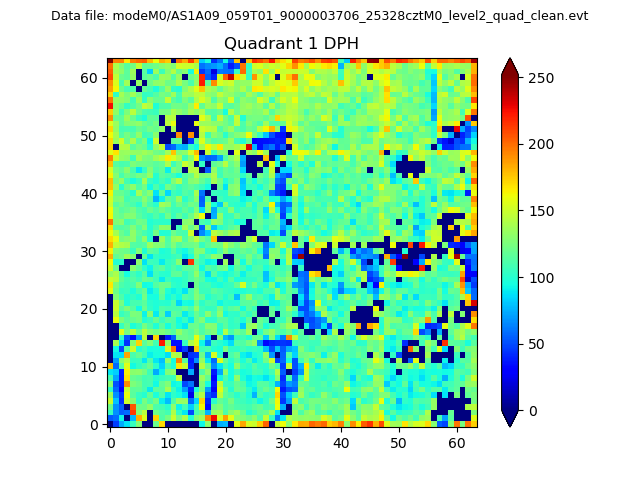 |
Quadrant B |
|---|---|---|---|
| Quadrant D | 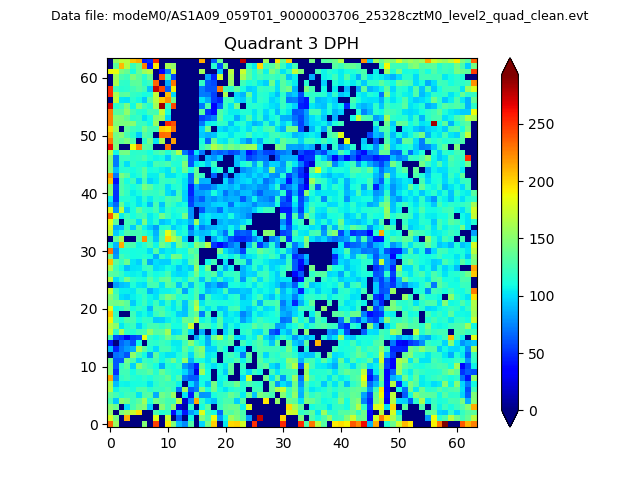 |
 |
Quadrant C |
| Plot type | Count rate plots | Images |
|---|---|---|
| Comparison with Poisson distribution Blue bars denote a histogram of data divided into 1 sec bins. Red curve is a Poisson curve with rate = median count rate of data. |
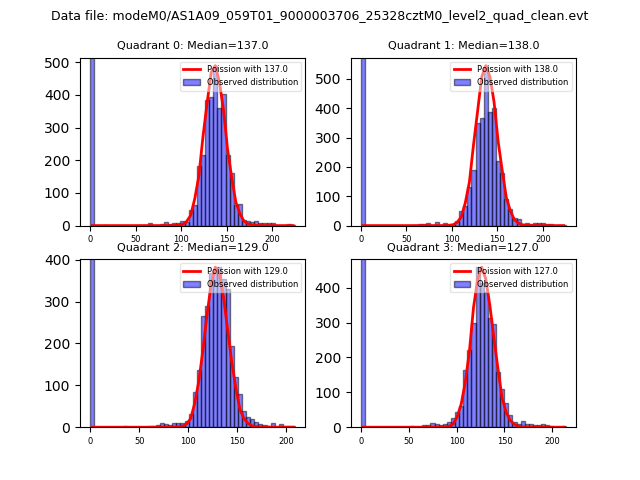 |
 |
| Quadrant-wise count rates Data is divided into 100 sec bins |
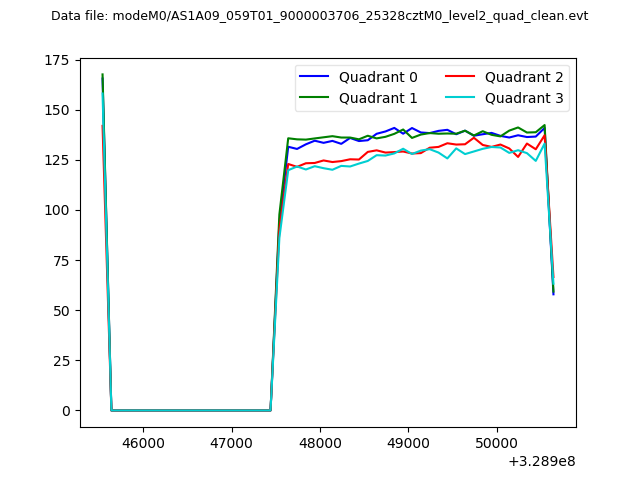 |
|
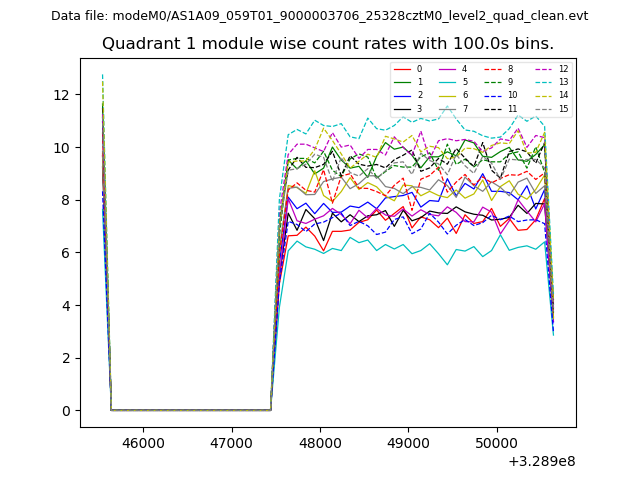
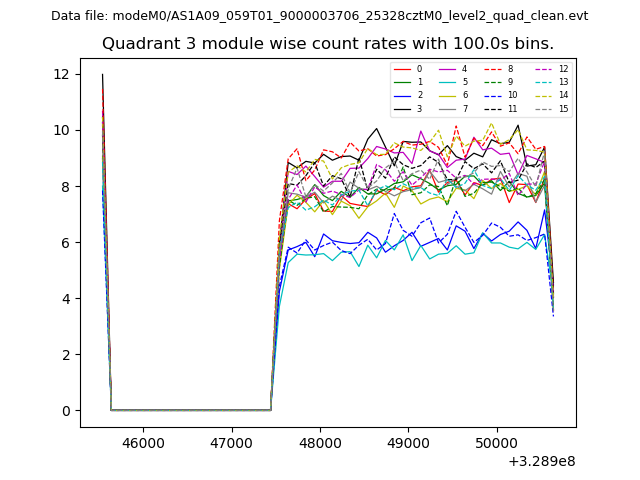
| Module-wise count rates for Quadrant A Data is divided into 100 sec bins |
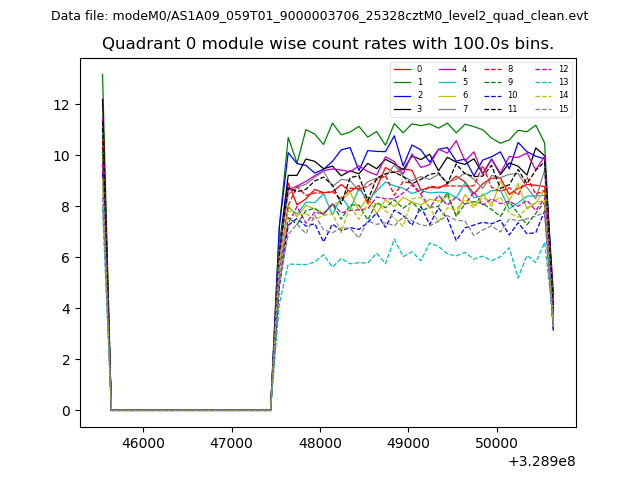 |
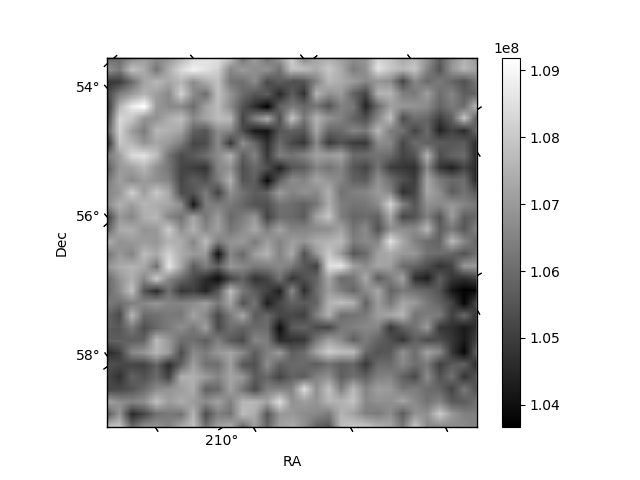 |
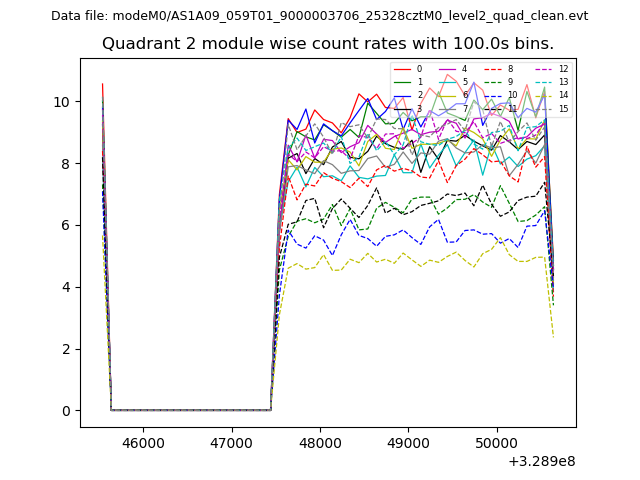
| Module-wise count rates for Quadrant B Data is divided into 100 sec bins |
 |
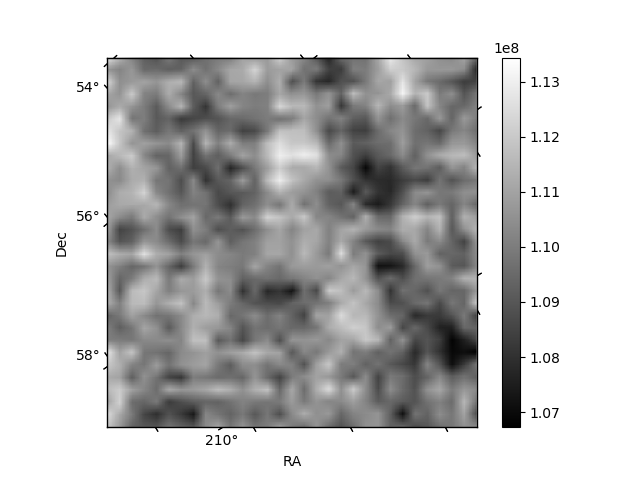 |
| Module-wise count rates for Quadrant C Data is divided into 100 sec bins |
 |
 |
| Module-wise count rates for Quadrant D Data is divided into 100 sec bins |
 |
 |
| Parameter | Plot |
|---|---|
| CZT HV Monitor | 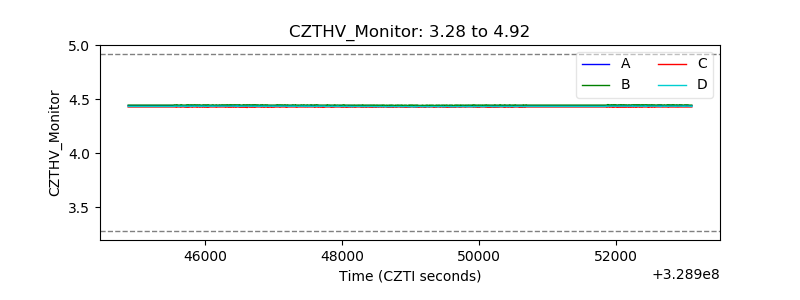 |
| D_VDD | 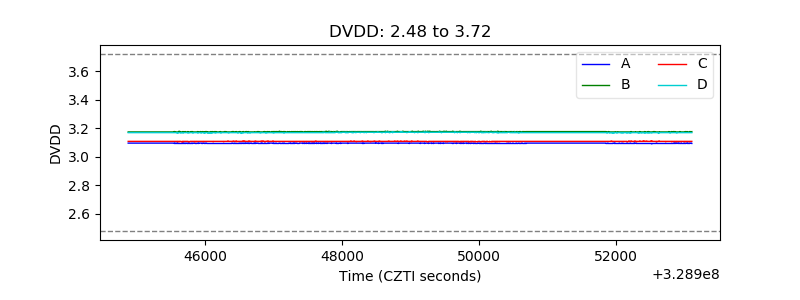 |
| Temperature 1 | 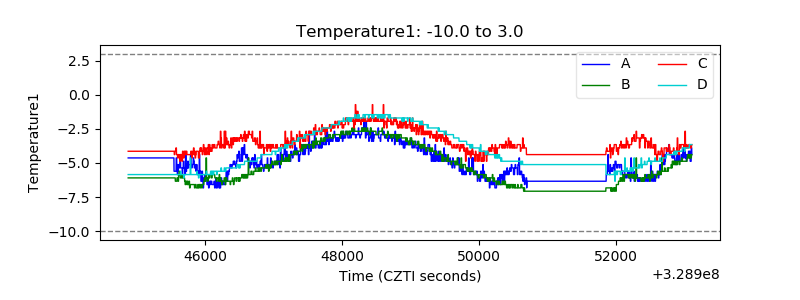 |
| Veto HV Monitor |  |
| Veto LLD | 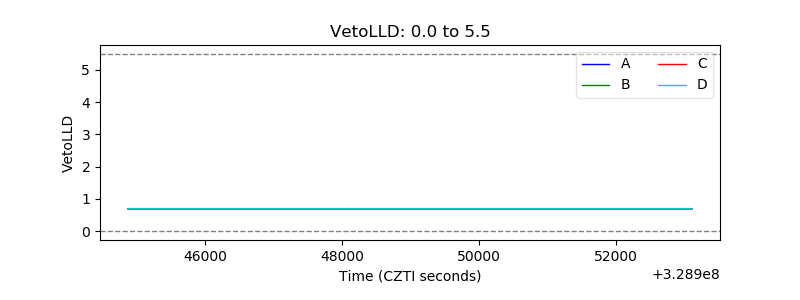 |
| Alpha Counter | 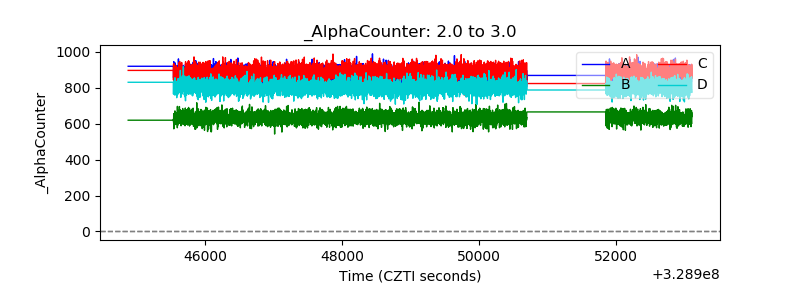 |
| _CPM_Rate | 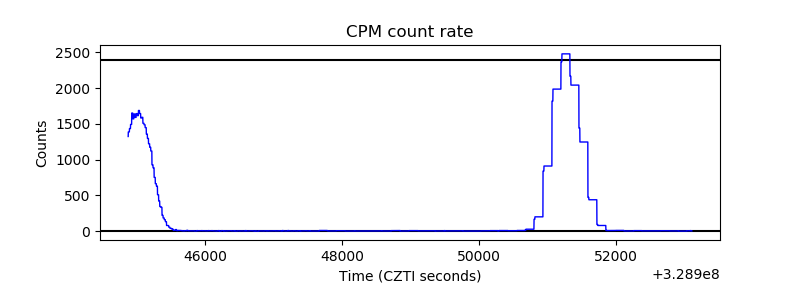 |
| CZT Counter | 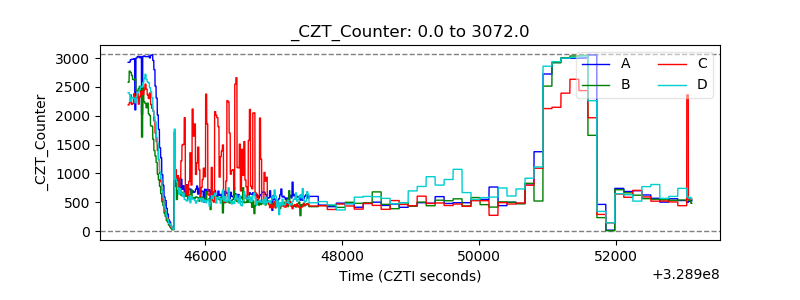 |
| +2.5 Volts monitor | 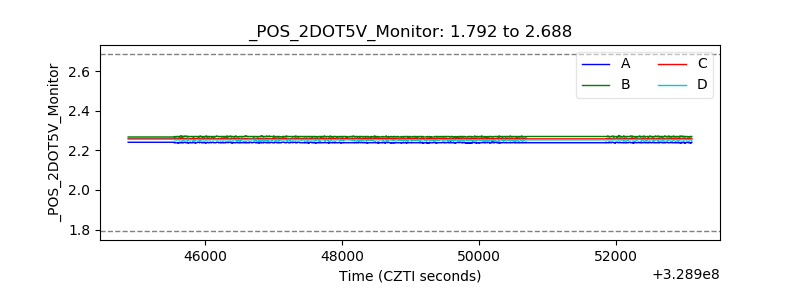 |
| +5 Volts monitor |  |
| _ROLL_ROT | 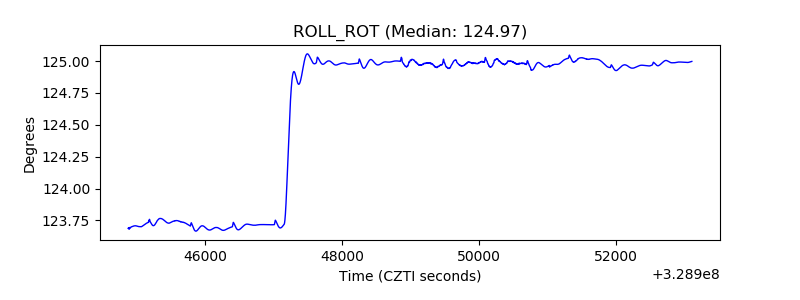 |
| _Roll_DEC | 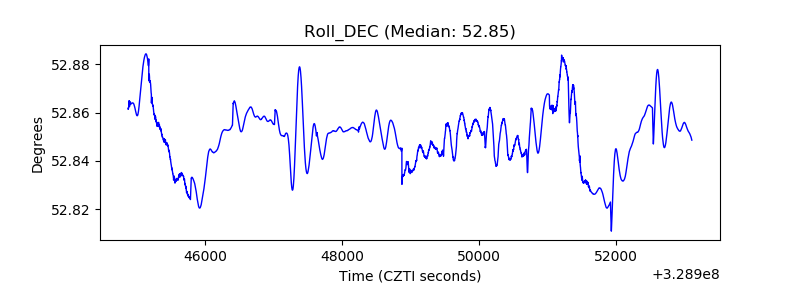 |
| _Roll_RA | 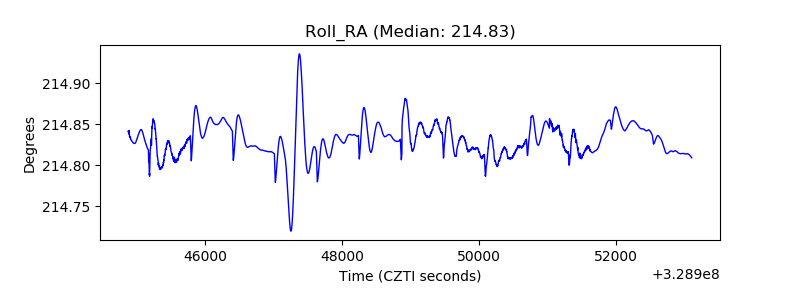 |
| Veto Counter | 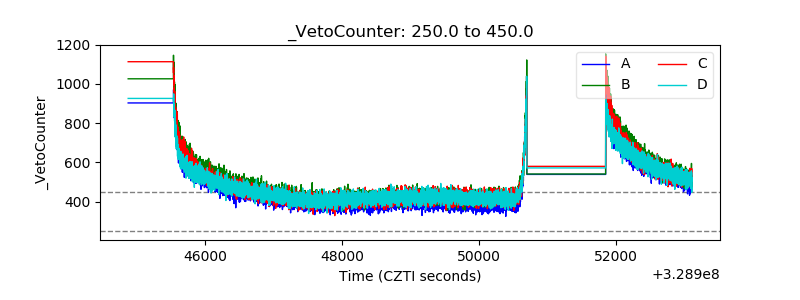 |