| Param | Original file | Final file |
|---|---|---|
| Filename | modeM0/AS1A09_059T01_9000003706_25329cztM0_level2.evt | modeM0/AS1A09_059T01_9000003706_25329cztM0_level2_quad_clean.evt |
| Size (bytes) | 937,670,400 | 148,752,000 |
| Size | 894.2 MB | 141.9 MB |
| Events in quadrant A | 6,378,034 | 965,680 |
| Events in quadrant B | 5,867,096 | 972,699 |
| Events in quadrant C | 6,869,376 | 911,473 |
| Events in quadrant D | 8,523,150 | 876,410 |
| Mode M0 | |||
|---|---|---|---|
| Quadrant | BADHDUFLAG | Total packets | Discarded packets |
| A | 0 | 26163 | 0 |
| B | 0 | 24331 | 0 |
| C | 0 | 27507 | 0 |
| D | 0 | 33212 | 0 |
| Mode M9 | |||
|---|---|---|---|
| Quadrant | BADHDUFLAG | Total packets | Discarded packets |
| A | 0 | 24 | 0 |
| B | 0 | 24 | 0 |
| C | 0 | 24 | 0 |
| D | 0 | 24 | 0 |
| Quadrant | Total seconds | Saturated seconds | Saturation percentage |
|---|---|---|---|
| A | 11247 | 148 | 1.315906% |
| B | 11247 | 146 | 1.298124% |
| C | 11248 | 504 | 4.480797% |
| D | 11248 | 366 | 3.253912% |
Noise dominated data is calculated using 1-second bins in cleaned event files. If a bin has >2000 counts, and if more than 50% of those come from <1% of pixels, then it is considered to be noise-dominated and hence unusable.
| Quadrant | # 1 sec bins | Bins with >0 counts | Bins with >2000 counts | High rate bins dominated by noise | Noise dominated (total time) | Noise dominated (detector-on time) | Marked lightcurve |
|---|---|---|---|---|---|---|---|
| A | 13657 | 11247 | 0 | 0 | 0.00% | 0.00% | 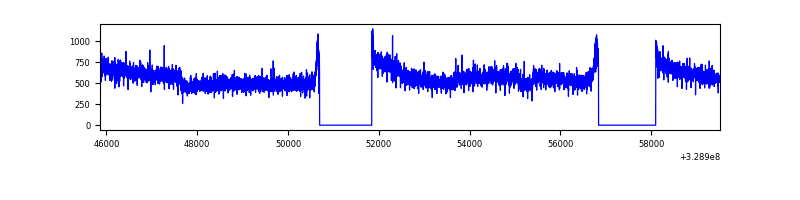 |
| B | 13658 | 11248 | 1 | 1 | 0.01% | 0.01% | 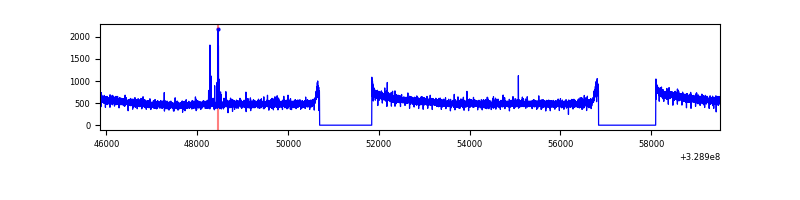 |
| C | 13658 | 11248 | 200 | 200 | 1.46% | 1.78% | 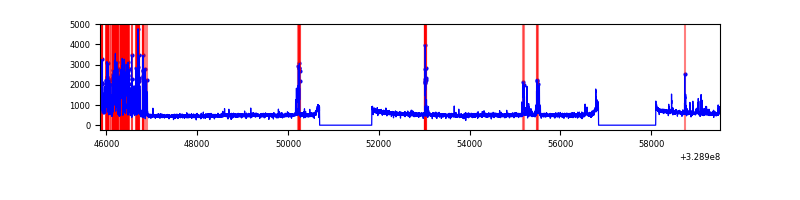 |
| D | 13658 | 11248 | 224 | 224 | 1.64% | 1.99% | 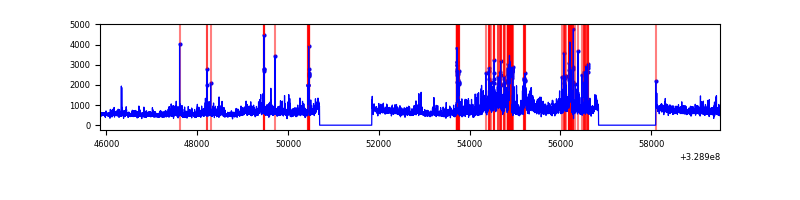 |
Top three noisy pixels from each quadrant. If the there are fewer than three noisy pixels in the level2.evt file, extra rows are filled as -1
| Pixel properties | Quadrant properties | ||||||
|---|---|---|---|---|---|---|---|
| Quadrant | DetID | PixID | Counts | Sigma | Mean | Median | Sigma |
| A | 15 | 173 | 532742 | 1775.6 | 1518 | 1490 | 299.2 |
| A | 13 | 254 | 17292 | 52.81 | 1518 | 1490 | 299.2 |
| A | 0 | 226 | 13073 | 38.71 | 1518 | 1490 | 299.2 |
| B | 12 | 111 | 33125 | 114.08 | 1491 | 1455 | 277.6 |
| B | 3 | 112 | 30343 | 104.06 | 1491 | 1455 | 277.6 |
| B | 11 | 111 | 30097 | 103.17 | 1491 | 1455 | 277.6 |
| C | 9 | 54 | 1119563 | 3496.95 | 1409 | 1422 | 319.7 |
| C | 14 | 238 | 229292 | 712.66 | 1409 | 1422 | 319.7 |
| C | 3 | 233 | 15520 | 44.09 | 1409 | 1422 | 319.7 |
| D | 8 | 195 | 2120235 | 6169.47 | 1443 | 1404 | 343.4 |
| D | 1 | 52 | 415941 | 1207.02 | 1443 | 1404 | 343.4 |
| D | 7 | 238 | 360368 | 1045.21 | 1443 | 1404 | 343.4 |
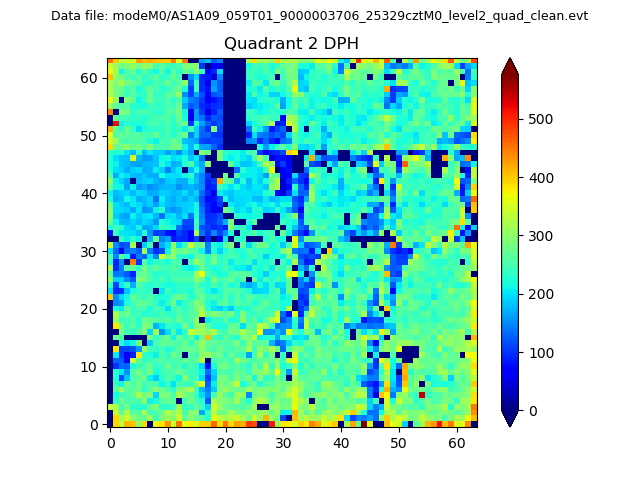
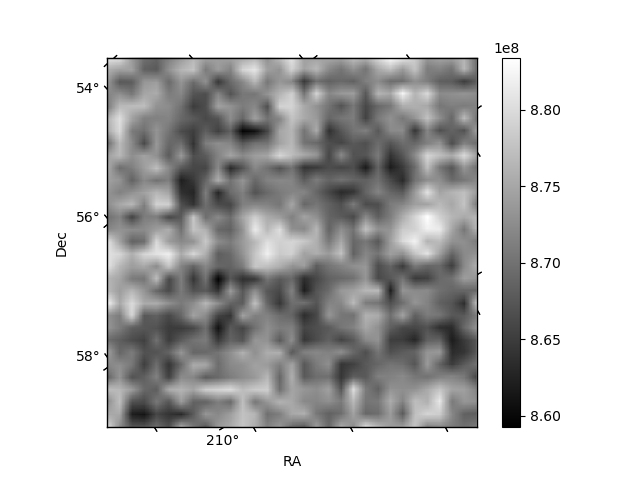
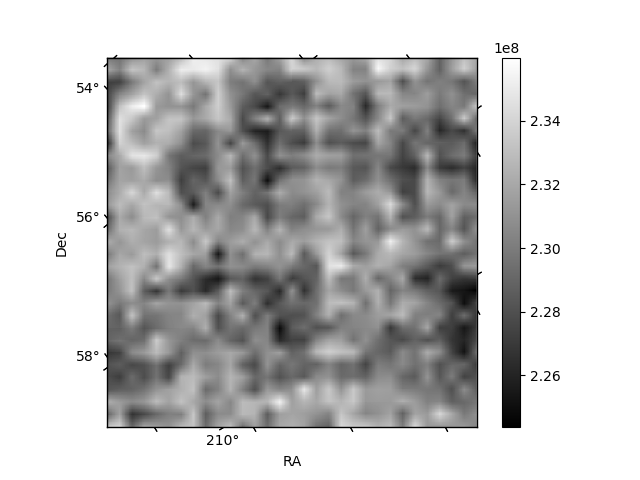
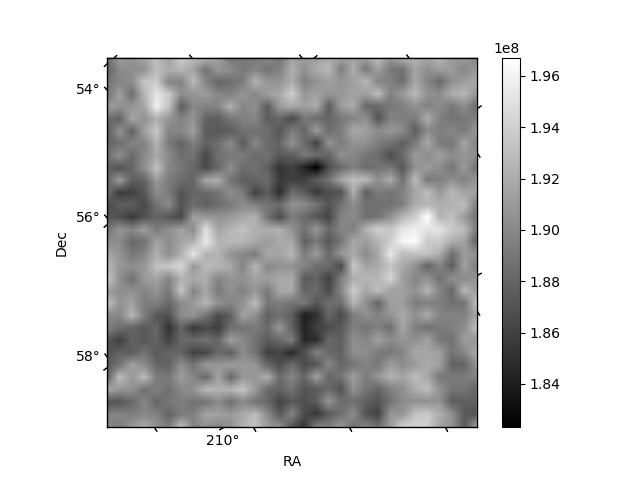
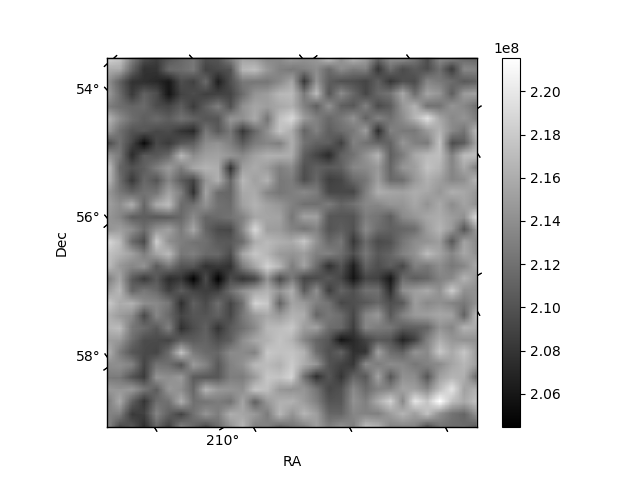
Histogram calculated using DETX and DETY for each event in the final _common_clean file
| Quadrant A | 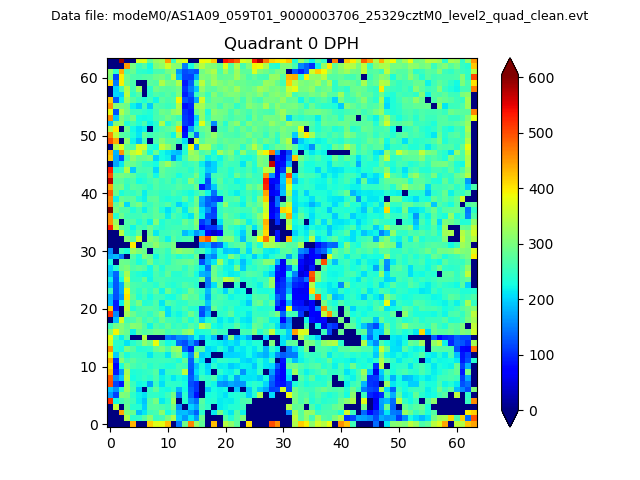 |
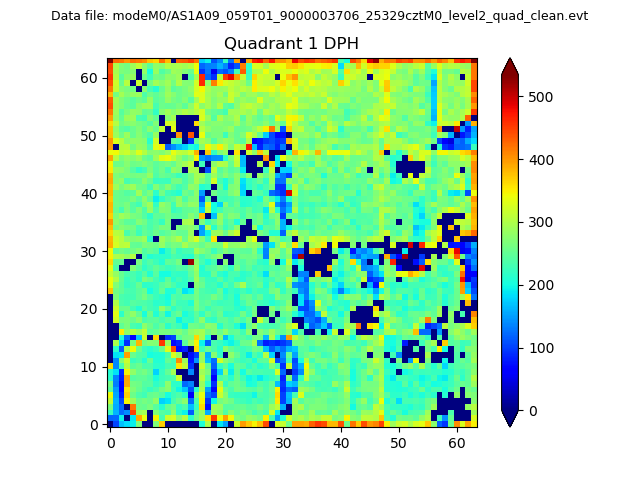 |
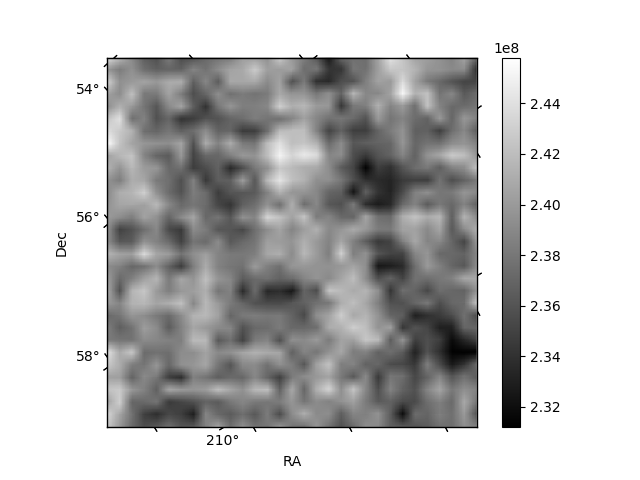
Quadrant B |
|---|---|---|---|
| Quadrant D | 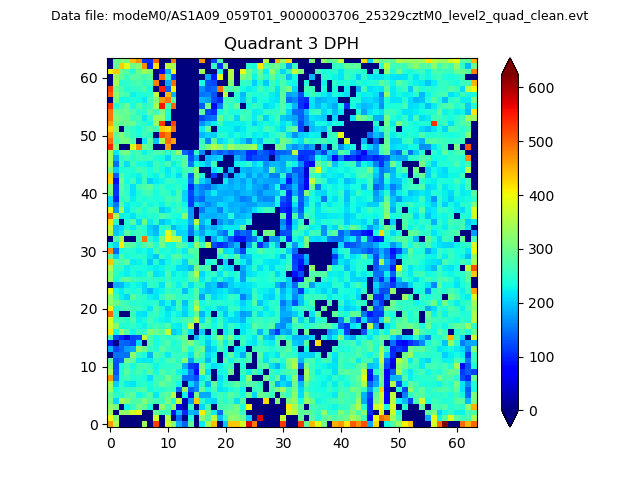 |
 |
Quadrant C |
| Plot type | Count rate plots | Images |
|---|---|---|
| Comparison with Poisson distribution Blue bars denote a histogram of data divided into 1 sec bins. Red curve is a Poisson curve with rate = median count rate of data. |
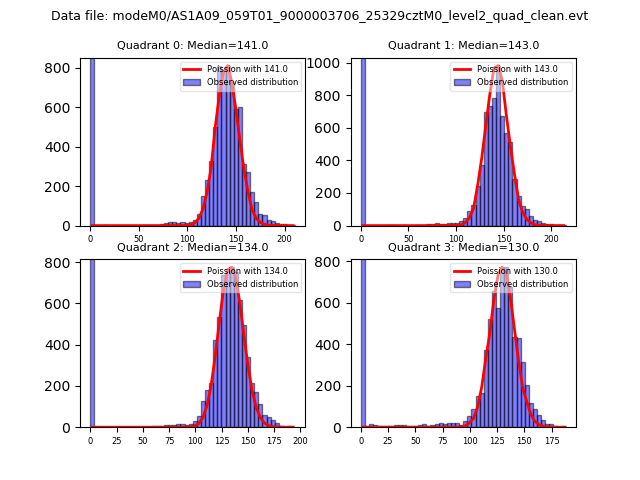 |
 |
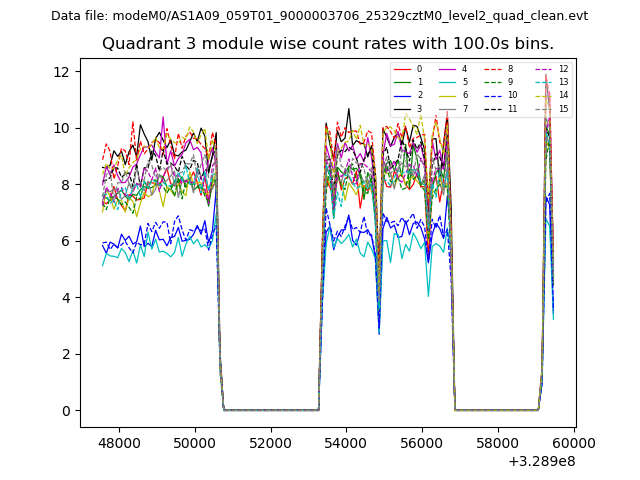
| Quadrant-wise count rates Data is divided into 100 sec bins |
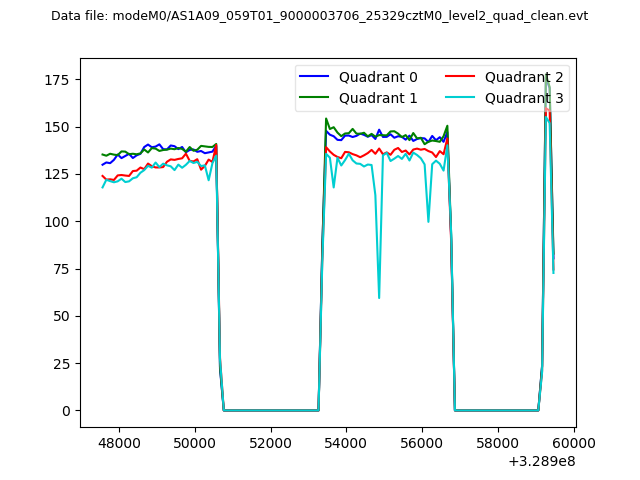 |
|
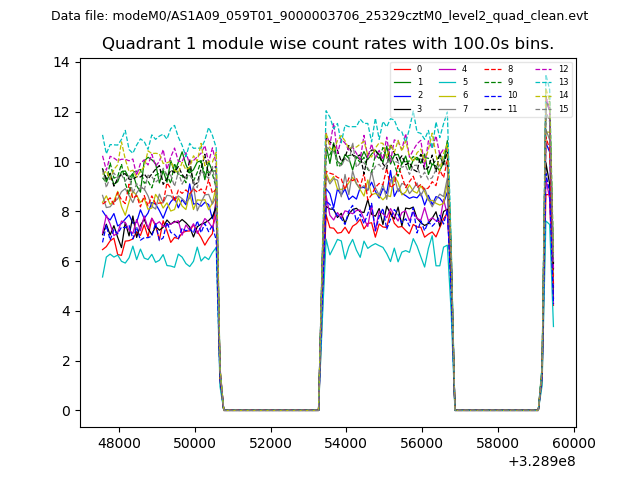
| Module-wise count rates for Quadrant A Data is divided into 100 sec bins |
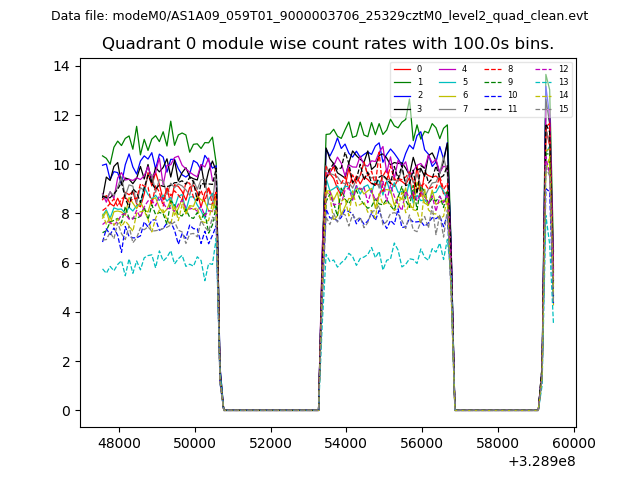 |
 |
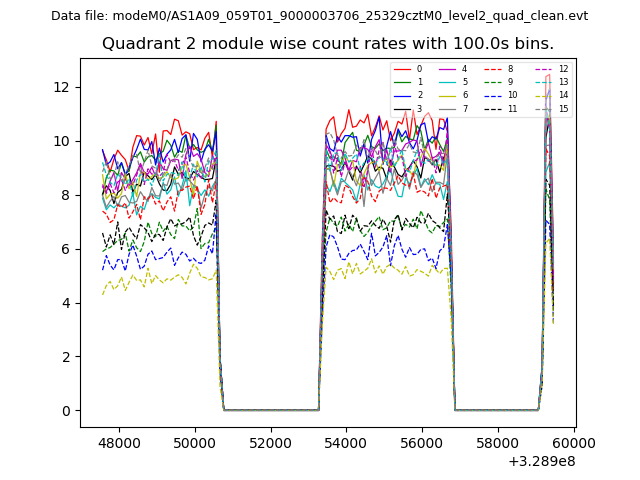
| Module-wise count rates for Quadrant B Data is divided into 100 sec bins |
 |
 |
| Module-wise count rates for Quadrant C Data is divided into 100 sec bins |
 |
 |
| Module-wise count rates for Quadrant D Data is divided into 100 sec bins |
 |
 |
| Parameter | Plot |
|---|---|
| CZT HV Monitor | 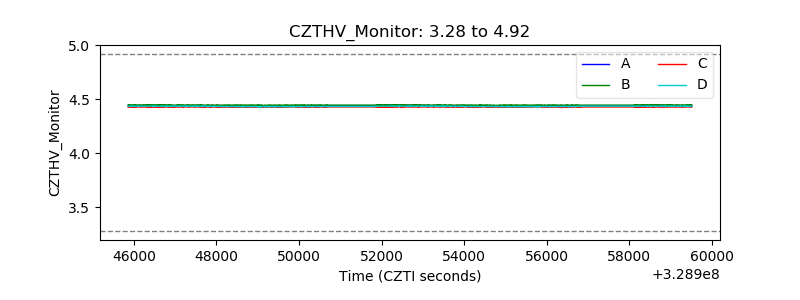 |
| D_VDD | 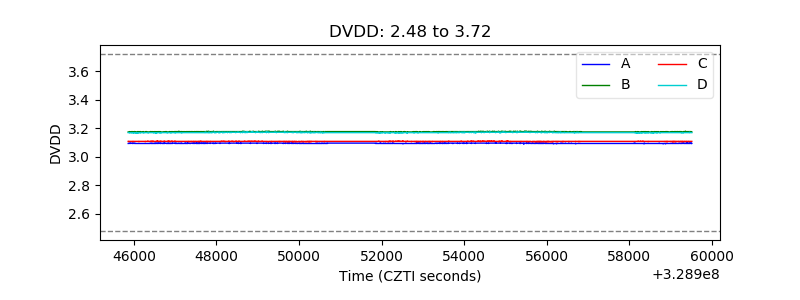 |
| Temperature 1 | 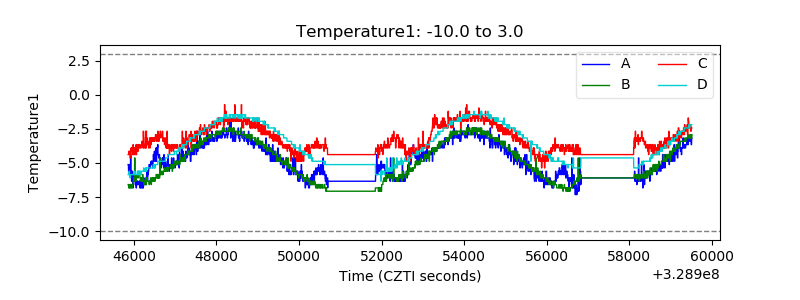 |
| Veto HV Monitor | 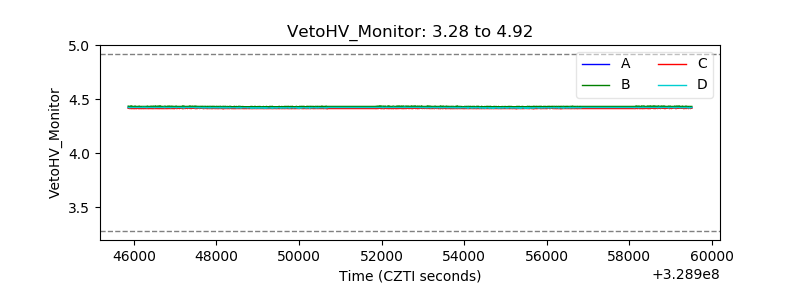 |
| Veto LLD | 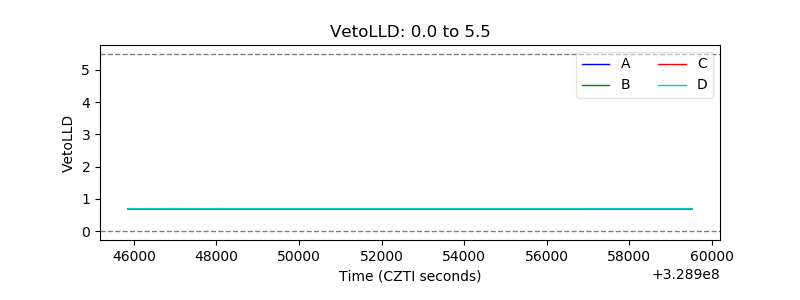 |
| Alpha Counter | 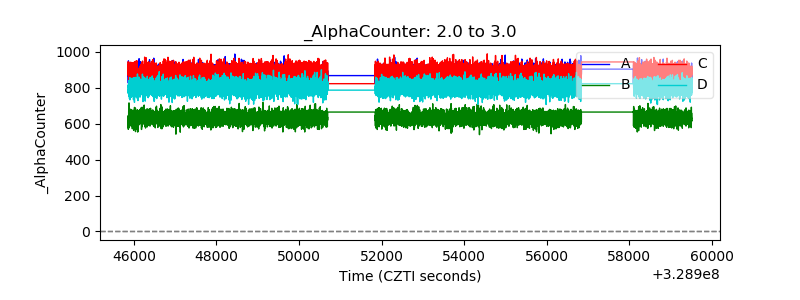 |
| _CPM_Rate | 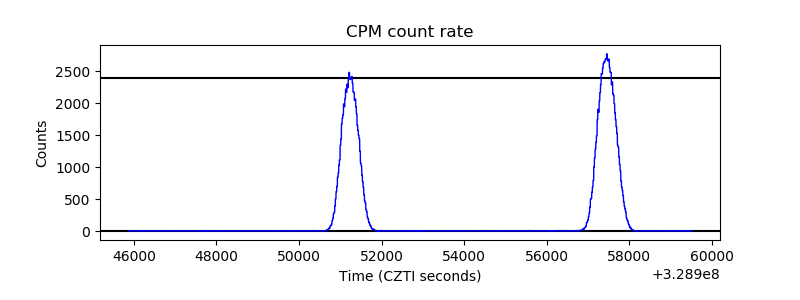 |
| CZT Counter | 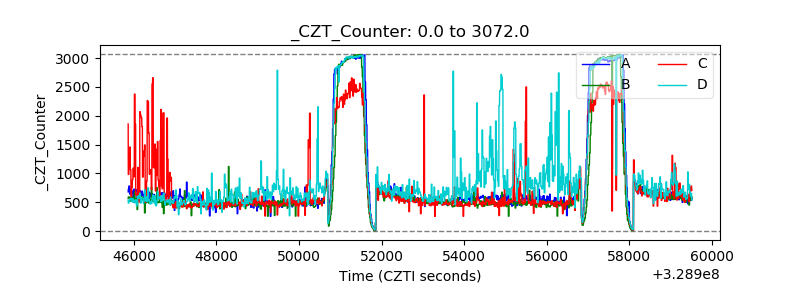 |
| +2.5 Volts monitor |  |
| +5 Volts monitor |  |
| _ROLL_ROT | 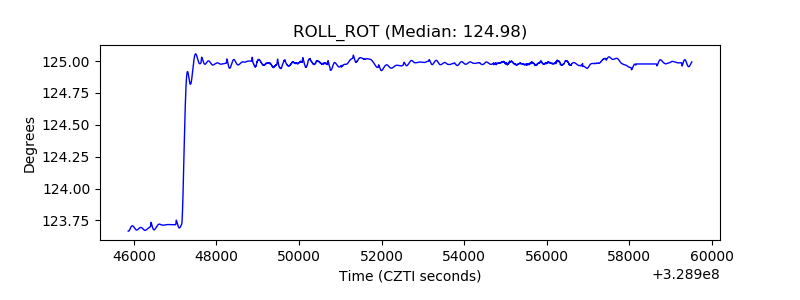 |
| _Roll_DEC | 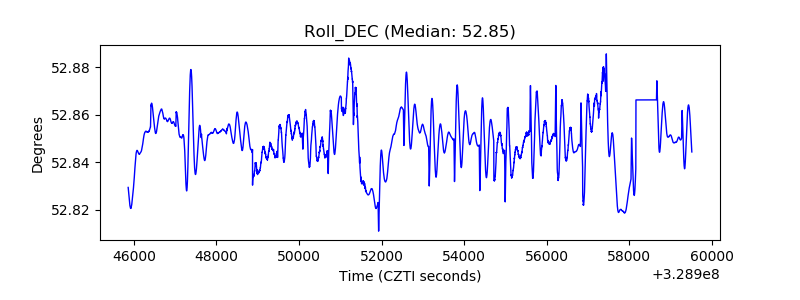 |
| _Roll_RA | 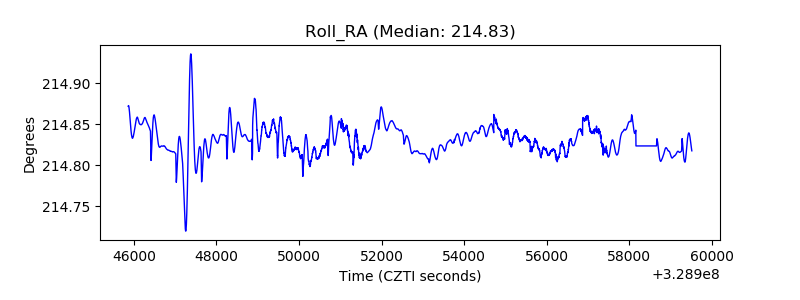 |
| Veto Counter | 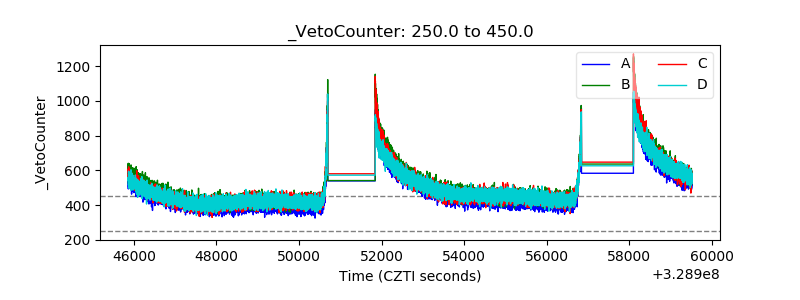 |