| Param | Original file | Final file |
|---|---|---|
| Filename | modeM0/AS1A09_059T01_9000003706_25330cztM0_level2.evt | modeM0/AS1A09_059T01_9000003706_25330cztM0_level2_quad_clean.evt |
| Size (bytes) | 544,057,920 | 105,721,920 |
| Size | 518.9 MB | 100.8 MB |
| Events in quadrant A | 3,580,087 | 720,952 |
| Events in quadrant B | 3,398,471 | 723,153 |
| Events in quadrant C | 3,732,091 | 672,085 |
| Events in quadrant D | 5,351,341 | 657,744 |
| Mode M0 | |||
|---|---|---|---|
| Quadrant | BADHDUFLAG | Total packets | Discarded packets |
| A | 0 | 14685 | 0 |
| B | 0 | 13898 | 0 |
| C | 0 | 15001 | 0 |
| D | 0 | 20577 | 0 |
| Mode M9 | |||
|---|---|---|---|
| Quadrant | BADHDUFLAG | Total packets | Discarded packets |
| A | 0 | 13 | 0 |
| B | 0 | 13 | 0 |
| C | 0 | 13 | 0 |
| D | 0 | 13 | 0 |
| Quadrant | Total seconds | Saturated seconds | Saturation percentage |
|---|---|---|---|
| A | 6128 | 81 | 1.321802% |
| B | 6127 | 86 | 1.403623% |
| C | 6127 | 157 | 2.562429% |
| D | 6127 | 126 | 2.056471% |
Noise dominated data is calculated using 1-second bins in cleaned event files. If a bin has >2000 counts, and if more than 50% of those come from <1% of pixels, then it is considered to be noise-dominated and hence unusable.
| Quadrant | # 1 sec bins | Bins with >0 counts | Bins with >2000 counts | High rate bins dominated by noise | Noise dominated (total time) | Noise dominated (detector-on time) | Marked lightcurve |
|---|---|---|---|---|---|---|---|
| A | 7478 | 6129 | 0 | 0 | 0.00% | 0.00% | 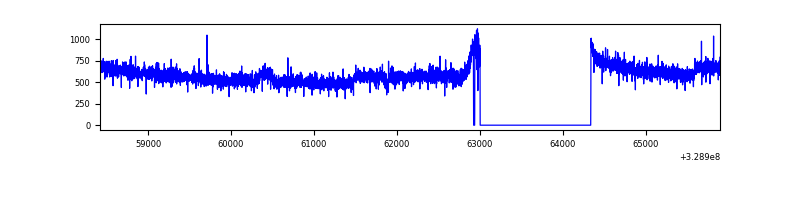 |
| B | 7477 | 6128 | 1 | 1 | 0.01% | 0.02% | 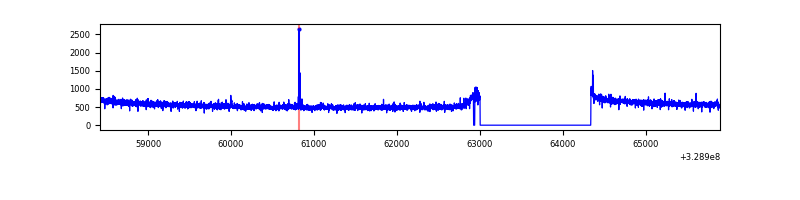 |
| C | 7477 | 6128 | 20 | 20 | 0.27% | 0.33% | 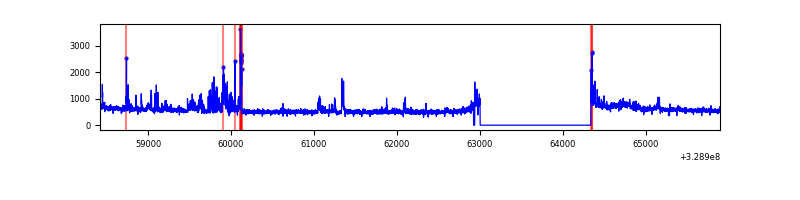 |
| D | 7477 | 6129 | 60 | 60 | 0.80% | 0.98% | 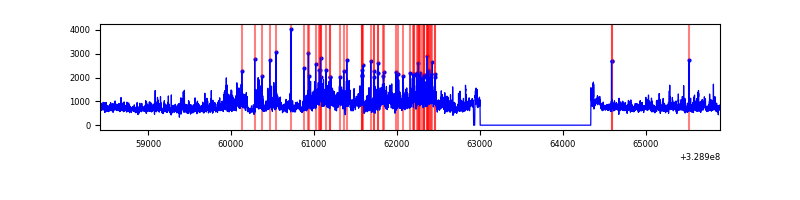 |
Top three noisy pixels from each quadrant. If the there are fewer than three noisy pixels in the level2.evt file, extra rows are filled as -1
| Pixel properties | Quadrant properties | ||||||
|---|---|---|---|---|---|---|---|
| Quadrant | DetID | PixID | Counts | Sigma | Mean | Median | Sigma |
| A | 15 | 173 | 153674 | 878.54 | 888 | 876 | 173.9 |
| A | 13 | 254 | 9880 | 51.77 | 888 | 876 | 173.9 |
| A | 0 | 226 | 7637 | 38.87 | 888 | 876 | 173.9 |
| B | 12 | 111 | 18174 | 109.29 | 863 | 847 | 158.5 |
| B | 0 | 190 | 17553 | 105.38 | 863 | 847 | 158.5 |
| B | 11 | 111 | 16679 | 99.86 | 863 | 847 | 158.5 |
| C | 9 | 54 | 378400 | 2010.78 | 823 | 830 | 187.8 |
| C | 14 | 238 | 135793 | 718.76 | 823 | 830 | 187.8 |
| C | 13 | 61 | 5506 | 24.9 | 823 | 830 | 187.8 |
| D | 8 | 195 | 1504452 | 7536.36 | 850 | 830 | 199.5 |
| D | 1 | 52 | 357010 | 1785.22 | 850 | 830 | 199.5 |
| D | 12 | 235 | 122582 | 610.24 | 850 | 830 | 199.5 |
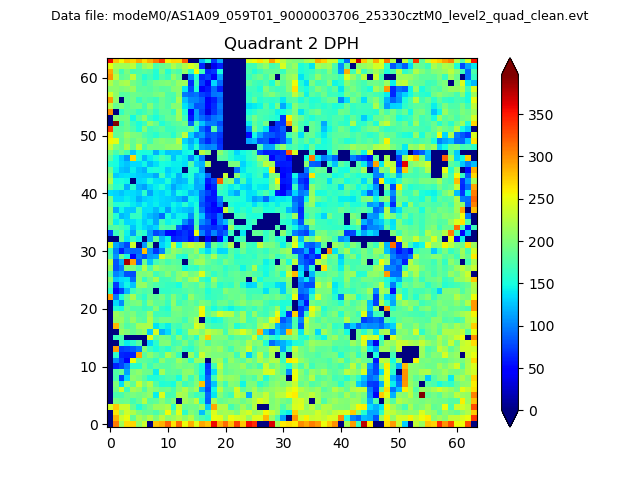
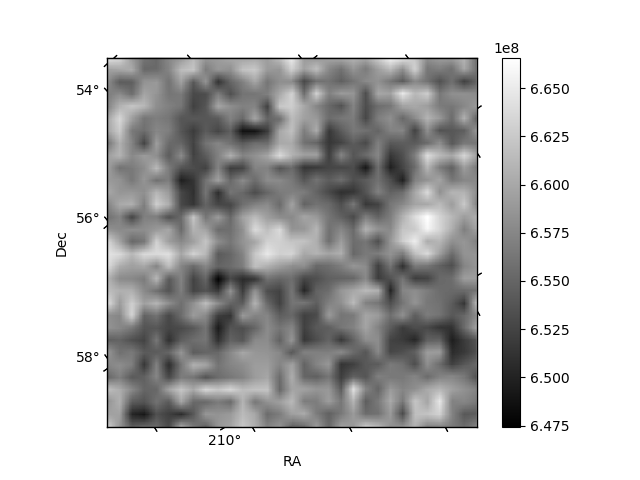
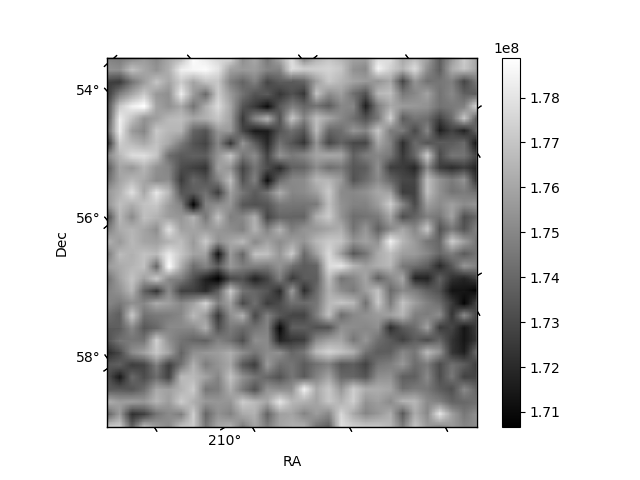
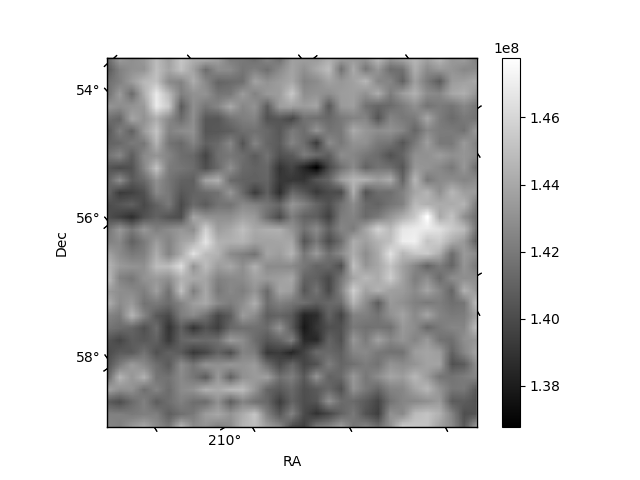
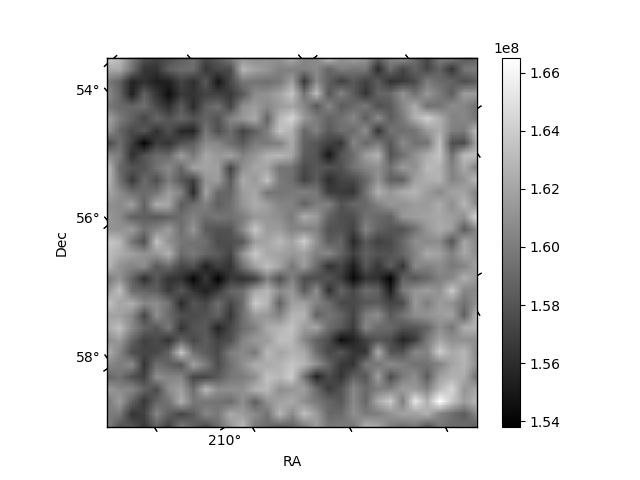
Histogram calculated using DETX and DETY for each event in the final _common_clean file
| Quadrant A | 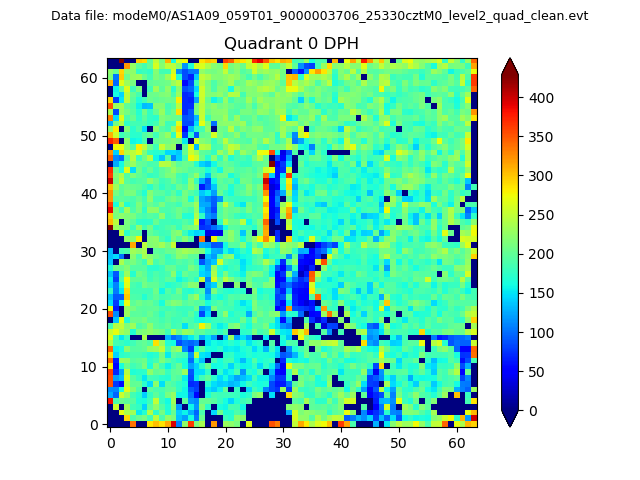 |
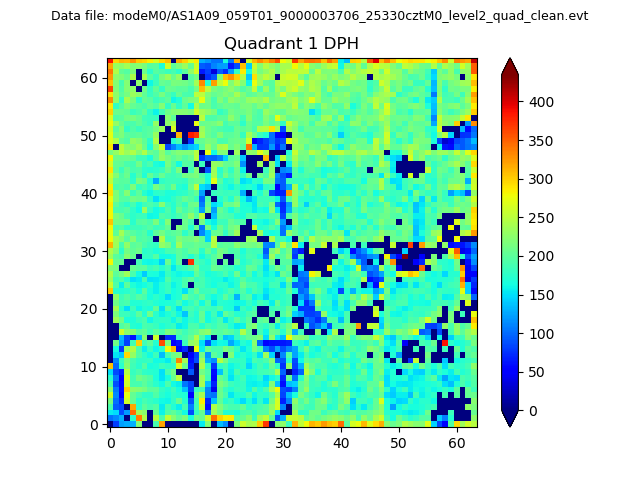 |
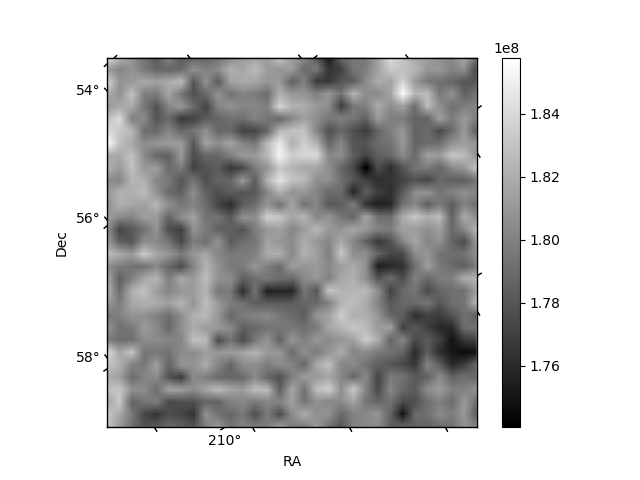
Quadrant B |
|---|---|---|---|
| Quadrant D | 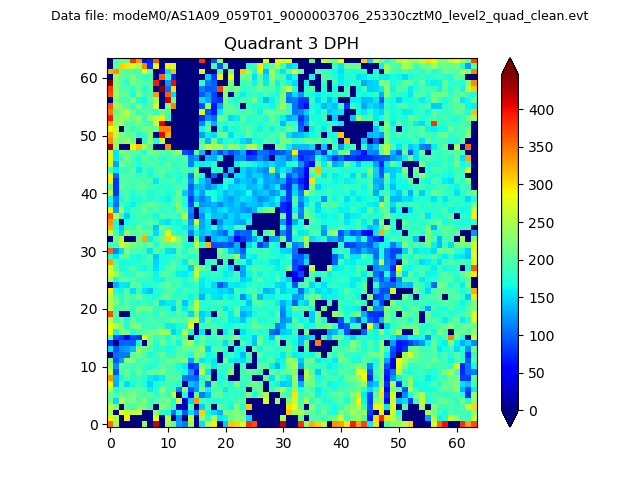 |
 |
Quadrant C |
| Plot type | Count rate plots | Images |
|---|---|---|
| Comparison with Poisson distribution Blue bars denote a histogram of data divided into 1 sec bins. Red curve is a Poisson curve with rate = median count rate of data. |
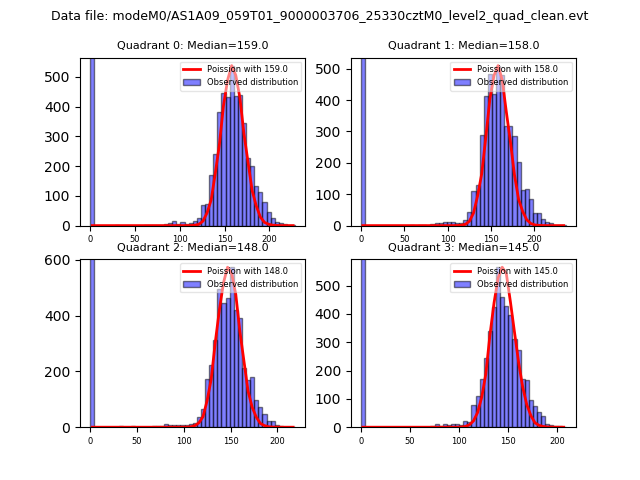 |
 |
| Quadrant-wise count rates Data is divided into 100 sec bins |
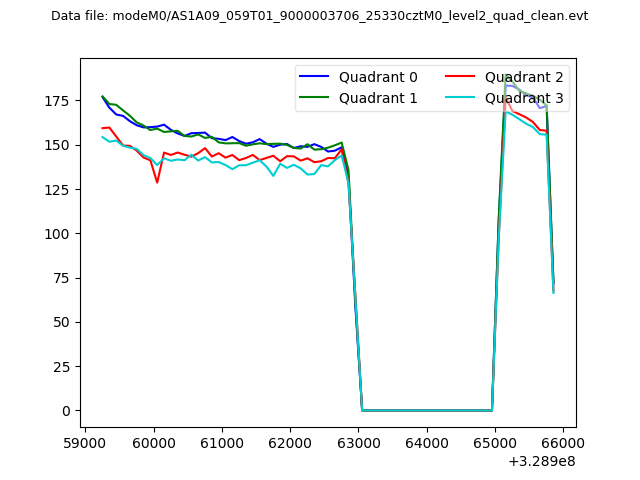 |
|
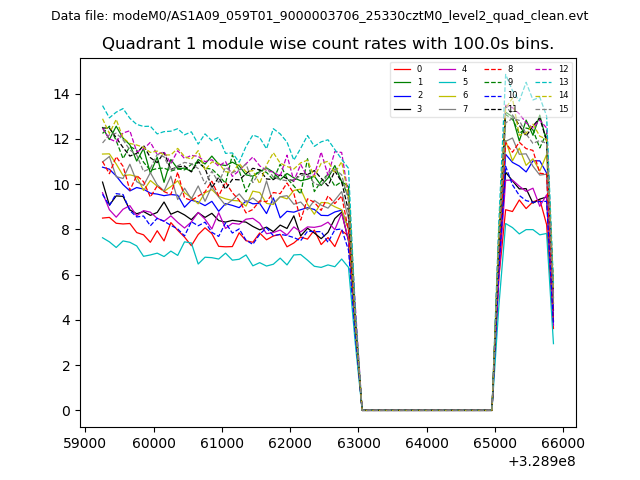
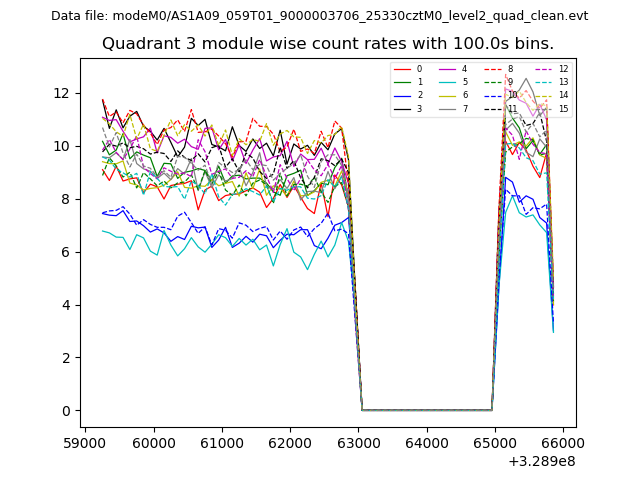
| Module-wise count rates for Quadrant A Data is divided into 100 sec bins |
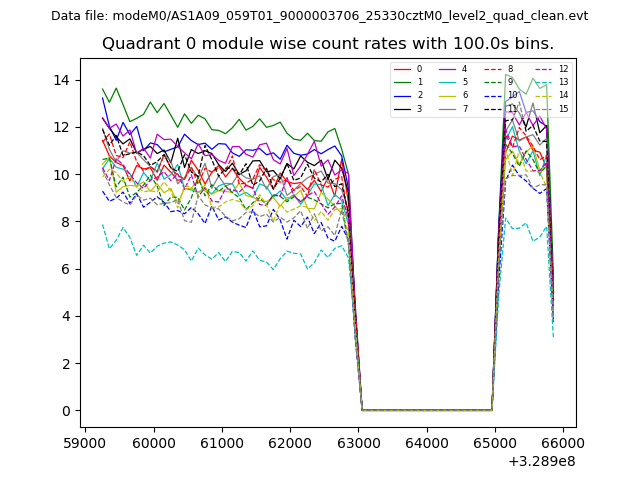 |
 |
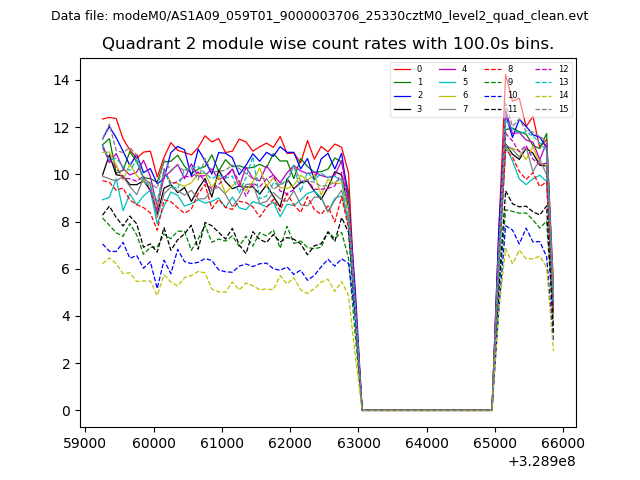
| Module-wise count rates for Quadrant B Data is divided into 100 sec bins |
 |
 |
| Module-wise count rates for Quadrant C Data is divided into 100 sec bins |
 |
 |
| Module-wise count rates for Quadrant D Data is divided into 100 sec bins |
 |
 |
| Parameter | Plot |
|---|---|
| CZT HV Monitor | 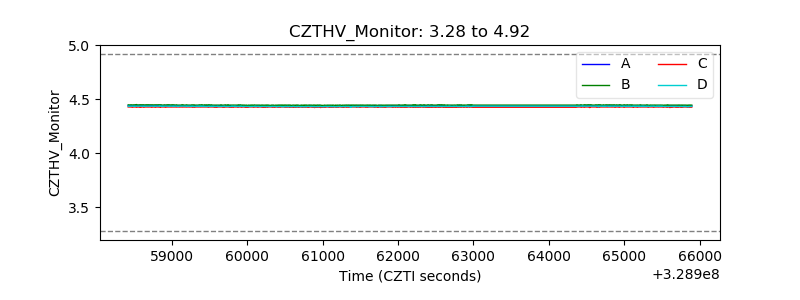 |
| D_VDD | 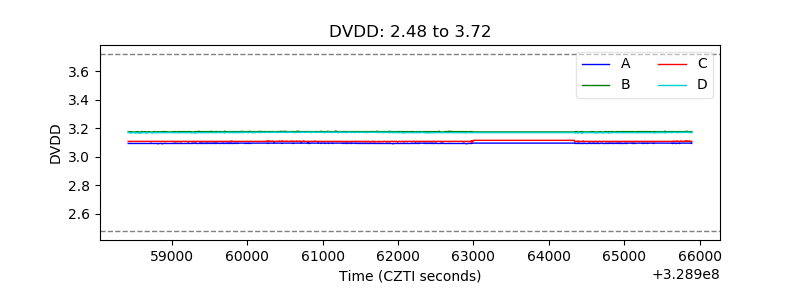 |
| Temperature 1 | 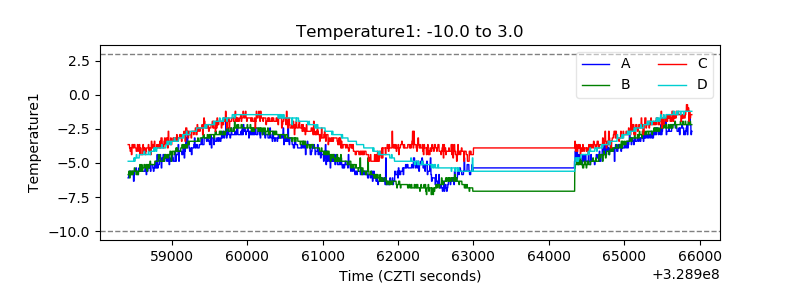 |
| Veto HV Monitor |  |
| Veto LLD | 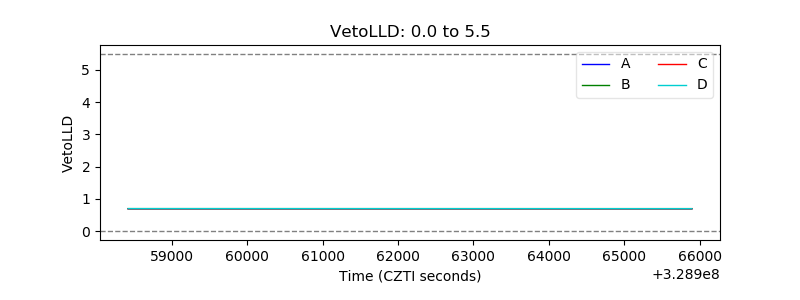 |
| Alpha Counter | 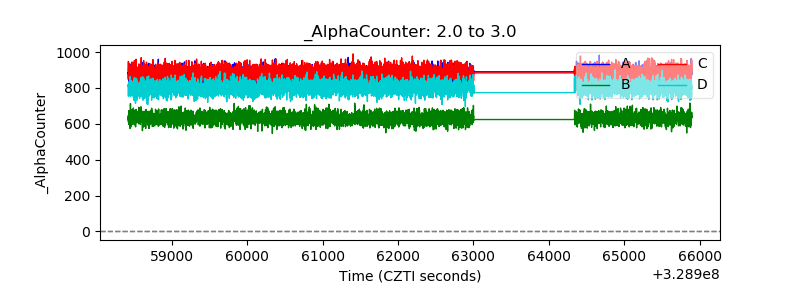 |
| _CPM_Rate |  |
| CZT Counter | 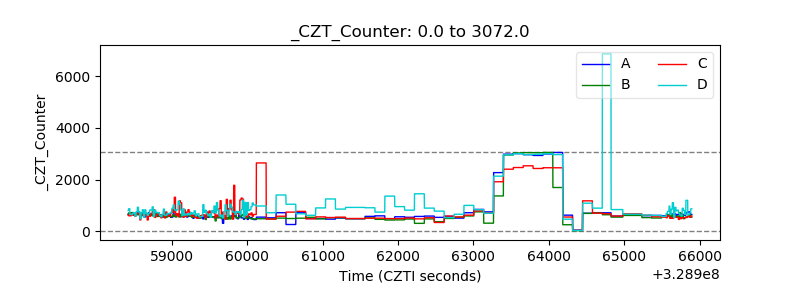 |
| +2.5 Volts monitor | 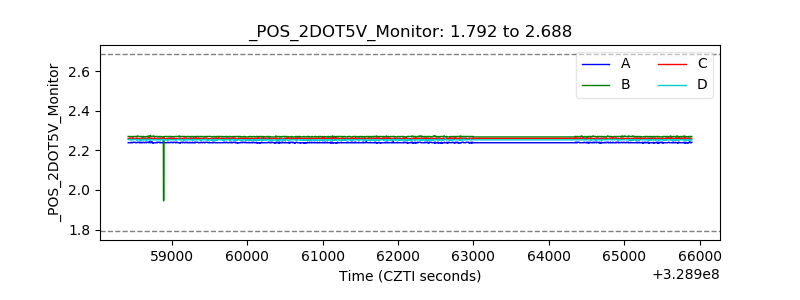 |
| +5 Volts monitor |  |
| _ROLL_ROT | 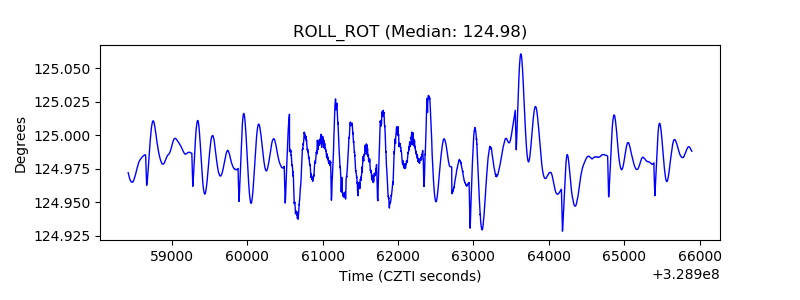 |
| _Roll_DEC | 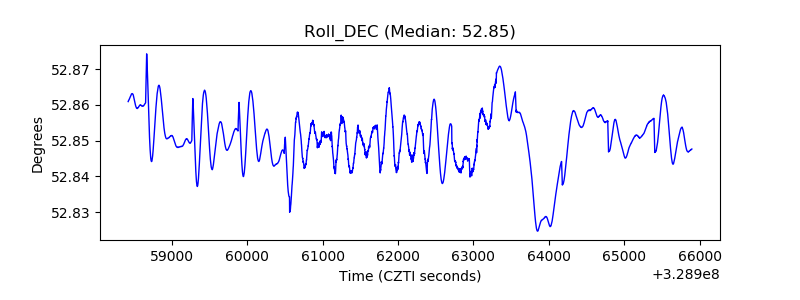 |
| _Roll_RA | 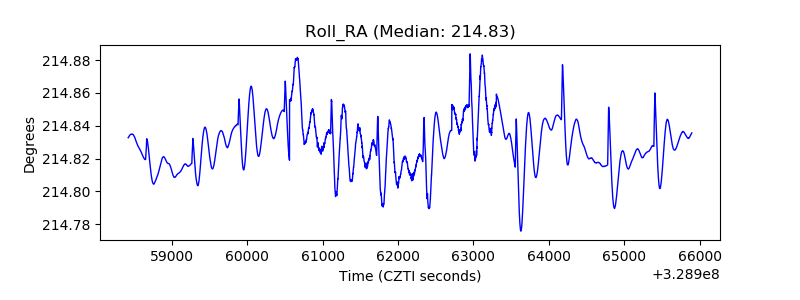 |
| Veto Counter | 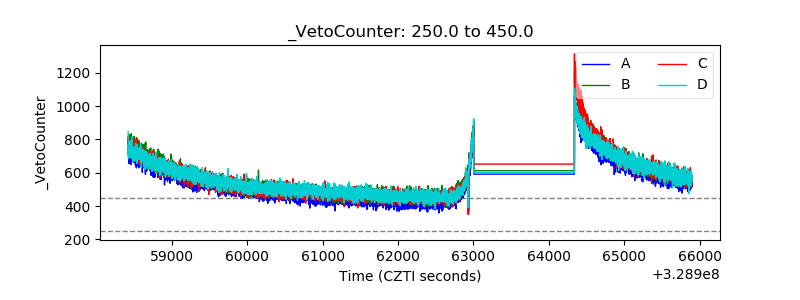 |