| Param | Original file | Final file |
|---|---|---|
| Filename | modeM0/AS1A09_059T01_9000003706_25331cztM0_level2.evt | modeM0/AS1A09_059T01_9000003706_25331cztM0_level2_quad_clean.evt |
| Size (bytes) | 593,565,120 | 119,698,560 |
| Size | 566.1 MB | 114.2 MB |
| Events in quadrant A | 3,811,904 | 835,657 |
| Events in quadrant B | 3,503,330 | 836,036 |
| Events in quadrant C | 3,573,619 | 785,816 |
| Events in quadrant D | 6,660,525 | 727,522 |
| Mode M0 | |||
|---|---|---|---|
| Quadrant | BADHDUFLAG | Total packets | Discarded packets |
| A | 0 | 15844 | 0 |
| B | 0 | 14402 | 0 |
| C | 0 | 14464 | 0 |
| D | 0 | 24486 | 0 |
| Mode M9 | |||
|---|---|---|---|
| Quadrant | BADHDUFLAG | Total packets | Discarded packets |
| A | 0 | 14 | 0 |
| B | 0 | 14 | 0 |
| C | 0 | 14 | 0 |
| D | 0 | 14 | 0 |
| Quadrant | Total seconds | Saturated seconds | Saturation percentage |
|---|---|---|---|
| A | 6313 | 126 | 1.995882% |
| B | 6313 | 123 | 1.948361% |
| C | 6313 | 140 | 2.217646% |
| D | 6313 | 842 | 13.337557% |
Noise dominated data is calculated using 1-second bins in cleaned event files. If a bin has >2000 counts, and if more than 50% of those come from <1% of pixels, then it is considered to be noise-dominated and hence unusable.
| Quadrant | # 1 sec bins | Bins with >0 counts | Bins with >2000 counts | High rate bins dominated by noise | Noise dominated (total time) | Noise dominated (detector-on time) | Marked lightcurve |
|---|---|---|---|---|---|---|---|
| A | 7663 | 6313 | 0 | 0 | 0.00% | 0.00% | 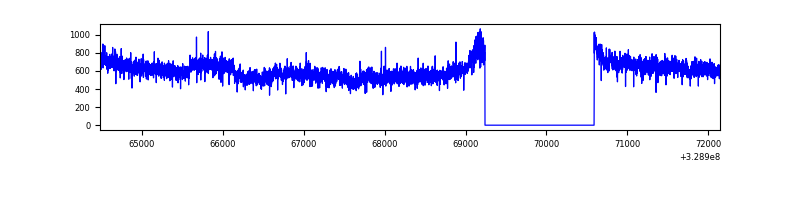 |
| B | 7663 | 6313 | 0 | 0 | 0.00% | 0.00% | 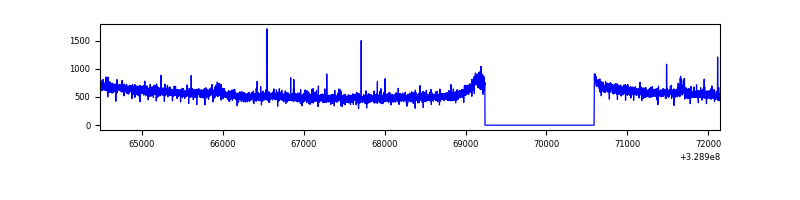 |
| C | 7663 | 6313 | 0 | 0 | 0.00% | 0.00% | 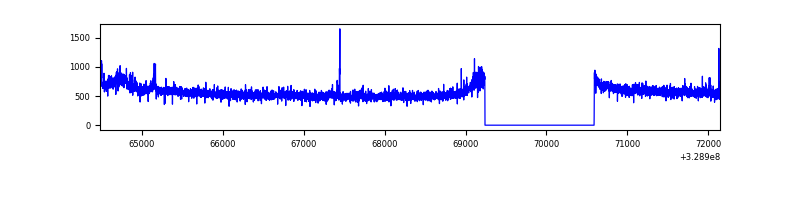 |
| D | 7663 | 6313 | 675 | 675 | 8.81% | 10.69% | 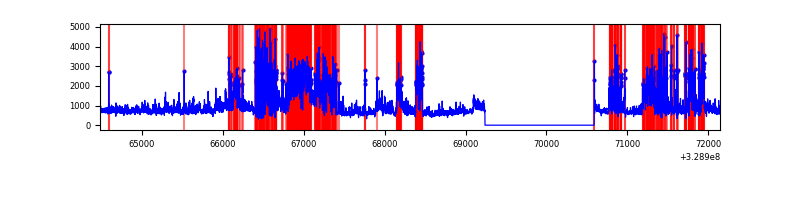 |
Top three noisy pixels from each quadrant. If the there are fewer than three noisy pixels in the level2.evt file, extra rows are filled as -1
| Pixel properties | Quadrant properties | ||||||
|---|---|---|---|---|---|---|---|
| Quadrant | DetID | PixID | Counts | Sigma | Mean | Median | Sigma |
| A | 15 | 173 | 290069 | 1611.62 | 914 | 899 | 179.4 |
| A | 13 | 254 | 10301 | 52.4 | 914 | 899 | 179.4 |
| A | 0 | 226 | 8111 | 40.19 | 914 | 899 | 179.4 |
| B | 3 | 112 | 19157 | 111.88 | 886 | 868 | 163.5 |
| B | 12 | 111 | 18698 | 109.07 | 886 | 868 | 163.5 |
| B | 11 | 111 | 16894 | 98.04 | 886 | 868 | 163.5 |
| C | 14 | 238 | 138550 | 701.99 | 859 | 867 | 196.1 |
| C | 9 | 54 | 63208 | 317.85 | 859 | 867 | 196.1 |
| C | 0 | 207 | 13546 | 64.64 | 859 | 867 | 196.1 |
| D | 1 | 52 | 2047210 | 10262.66 | 850 | 830 | 199.4 |
| D | 8 | 195 | 852024 | 4268.76 | 850 | 830 | 199.4 |
| D | 12 | 235 | 249245 | 1245.81 | 850 | 830 | 199.4 |
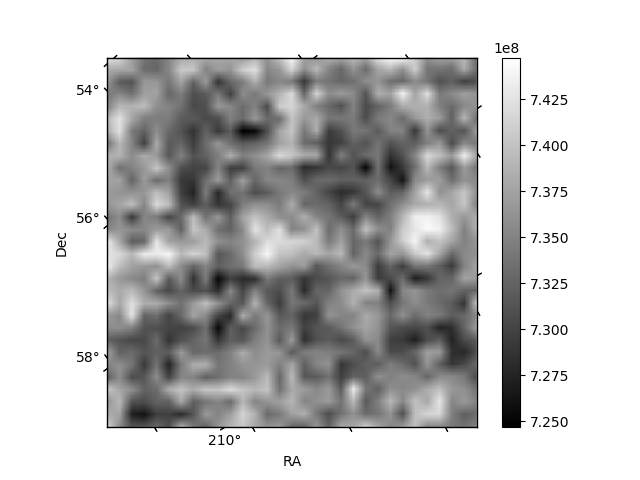
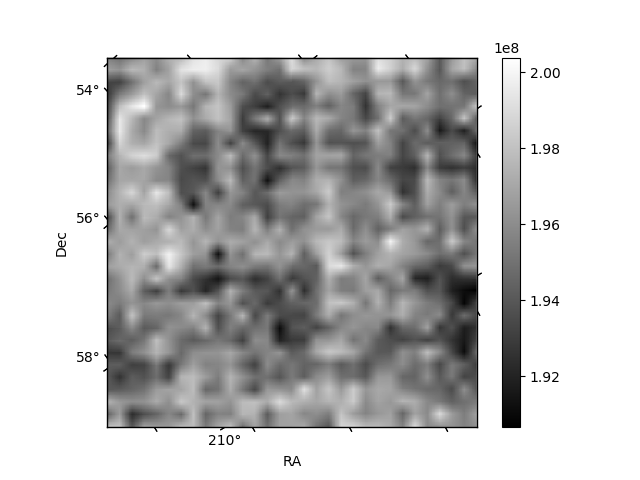
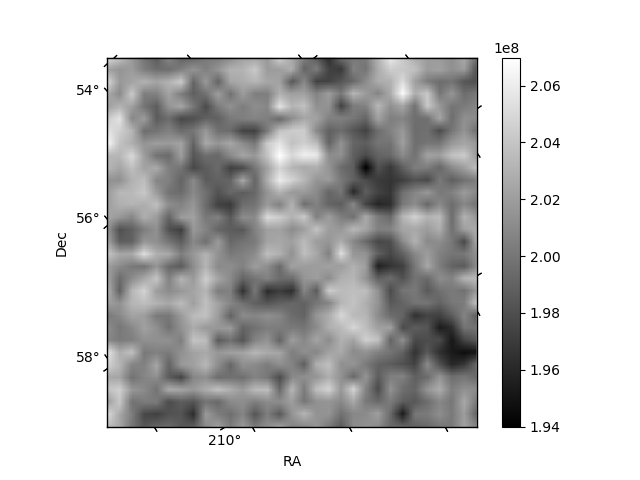
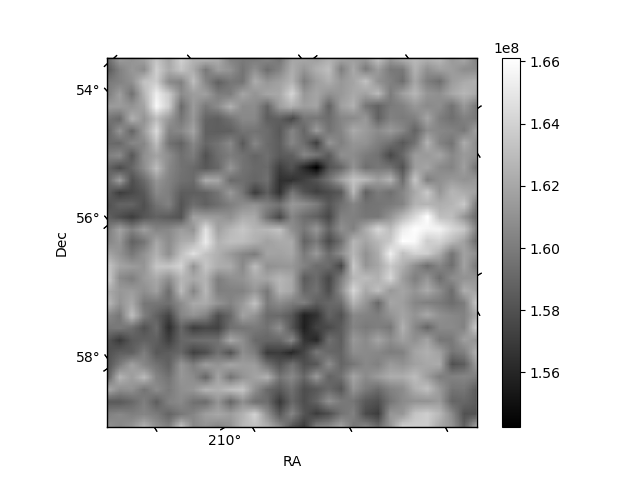
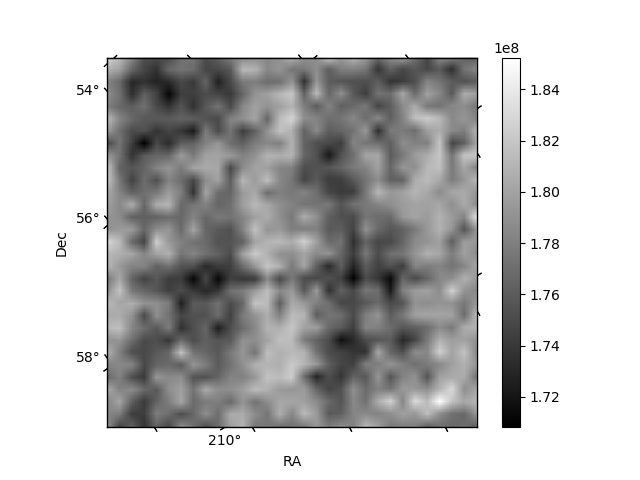
Histogram calculated using DETX and DETY for each event in the final _common_clean file
| Quadrant A | 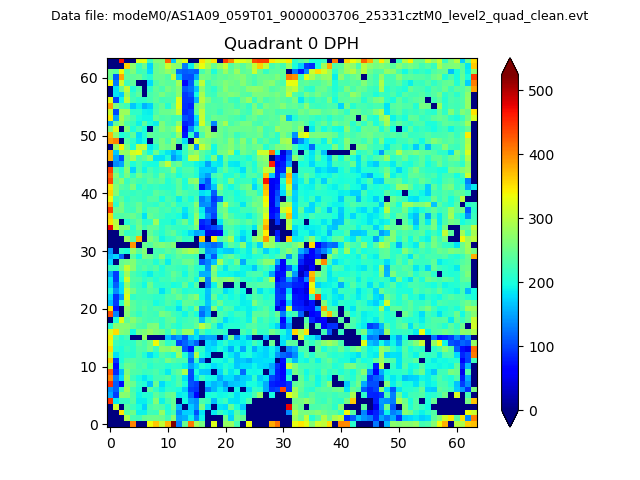 |
 |
Quadrant B |
|---|---|---|---|
| Quadrant D | 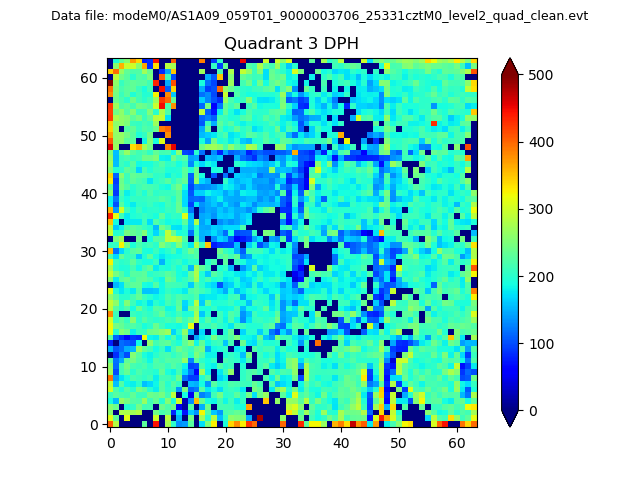 |
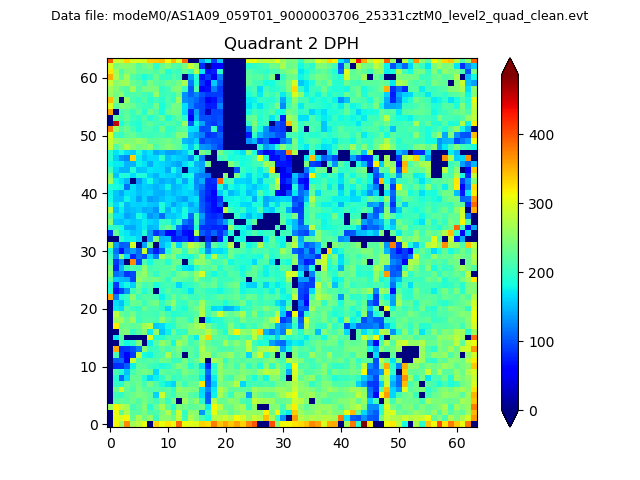 |
Quadrant C |
| Plot type | Count rate plots | Images |
|---|---|---|
| Comparison with Poisson distribution Blue bars denote a histogram of data divided into 1 sec bins. Red curve is a Poisson curve with rate = median count rate of data. |
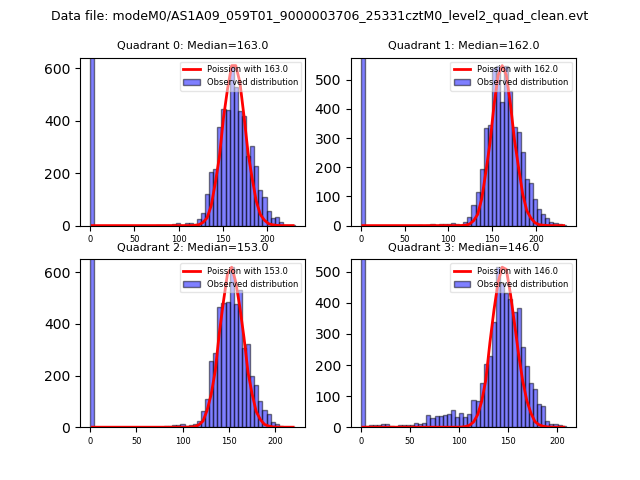 |
 |
| Quadrant-wise count rates Data is divided into 100 sec bins |
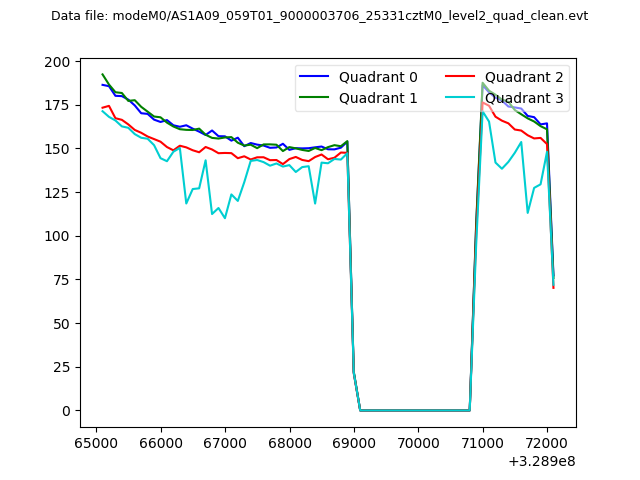 |
|
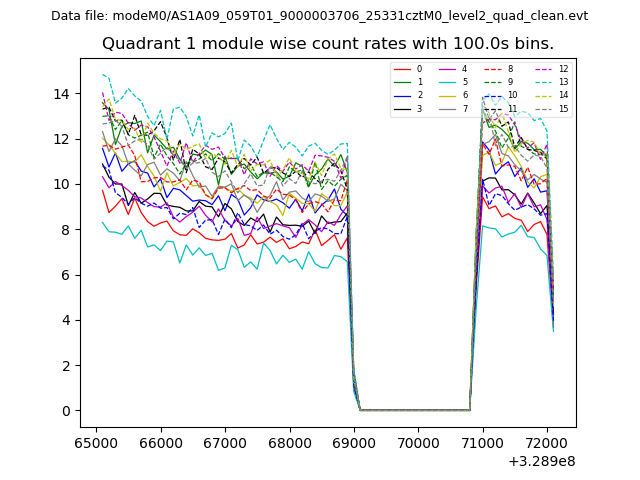
| Module-wise count rates for Quadrant A Data is divided into 100 sec bins |
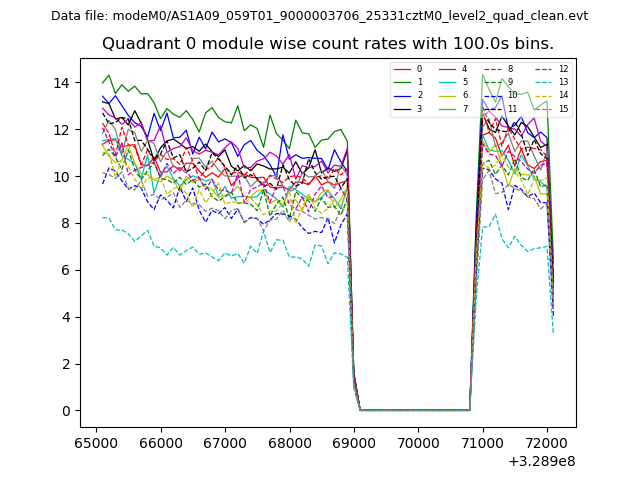 |
 |
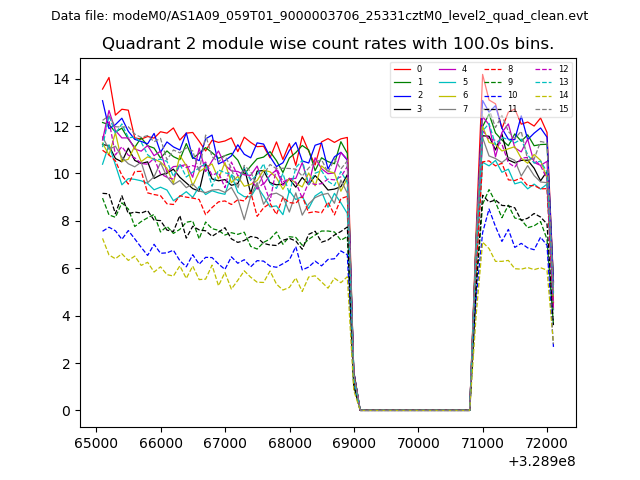
| Module-wise count rates for Quadrant B Data is divided into 100 sec bins |
 |
 |
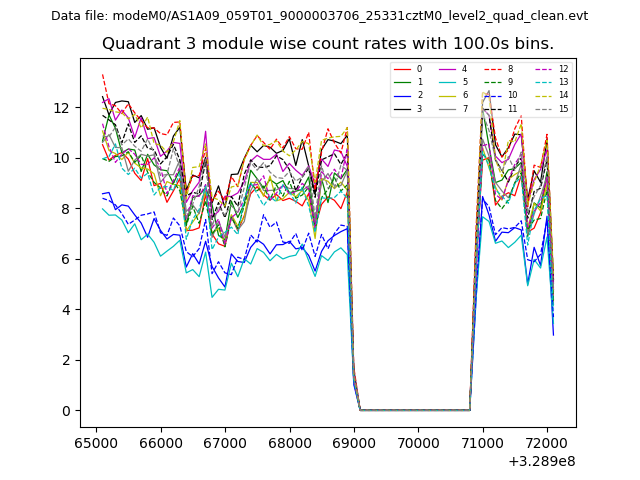
| Module-wise count rates for Quadrant C Data is divided into 100 sec bins |
 |
 |
| Module-wise count rates for Quadrant D Data is divided into 100 sec bins |
 |
 |
| Parameter | Plot |
|---|---|
| CZT HV Monitor | 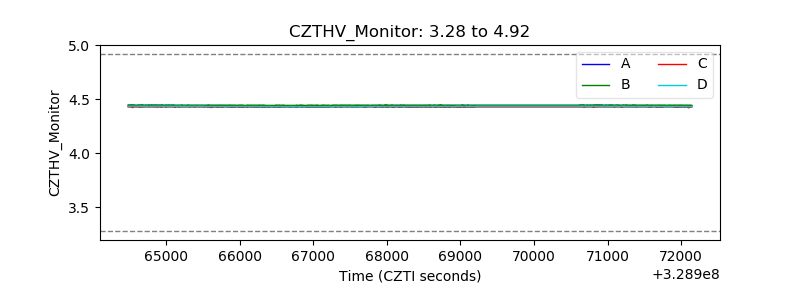 |
| D_VDD | 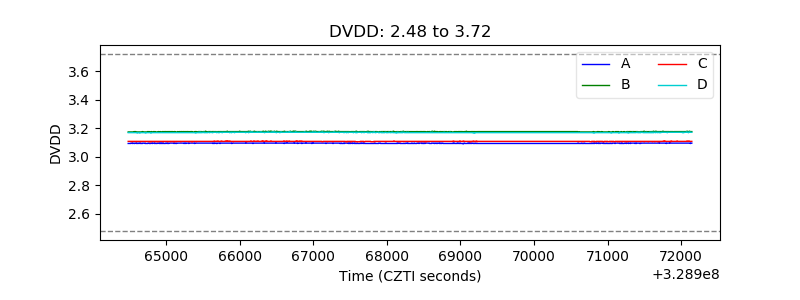 |
| Temperature 1 | 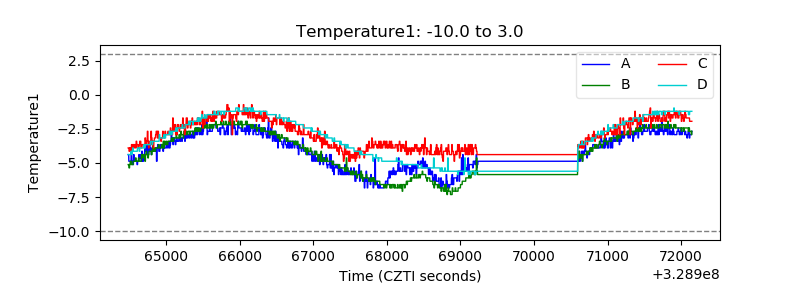 |
| Veto HV Monitor | 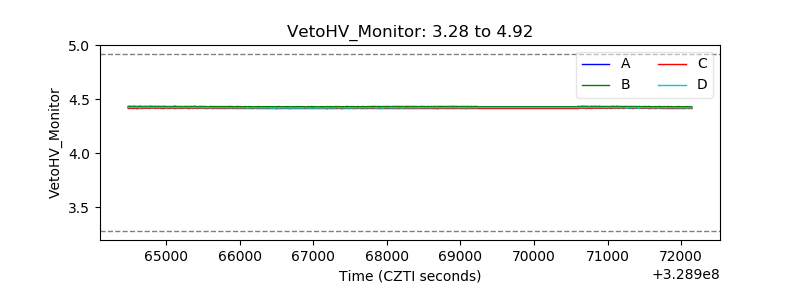 |
| Veto LLD | 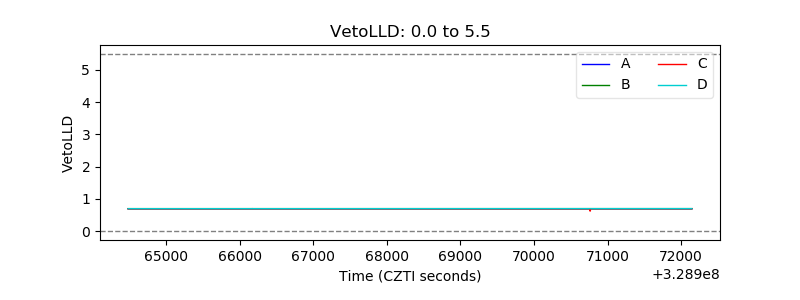 |
| Alpha Counter | 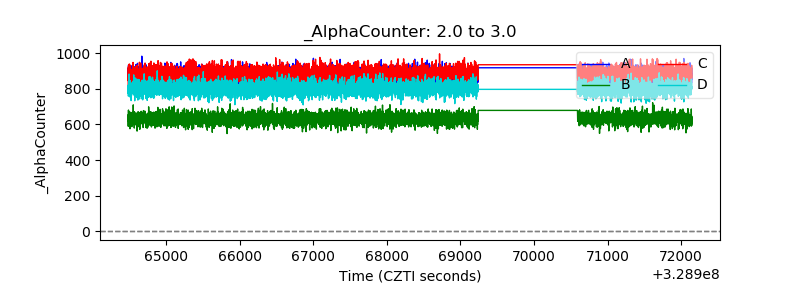 |
| _CPM_Rate |  |
| CZT Counter | 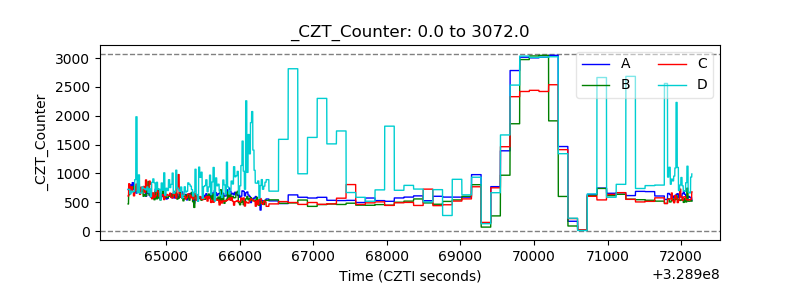 |
| +2.5 Volts monitor |  |
| +5 Volts monitor | 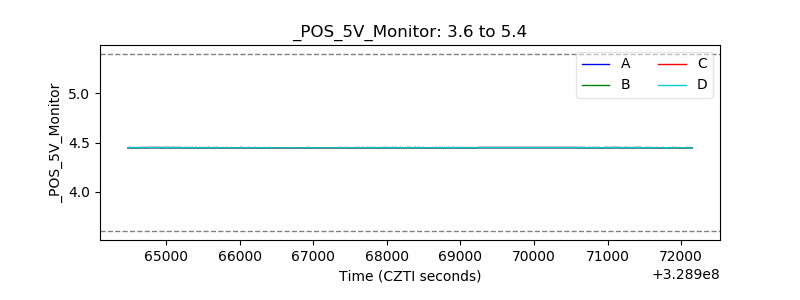 |
| _ROLL_ROT |  |
| _Roll_DEC |  |
| _Roll_RA | 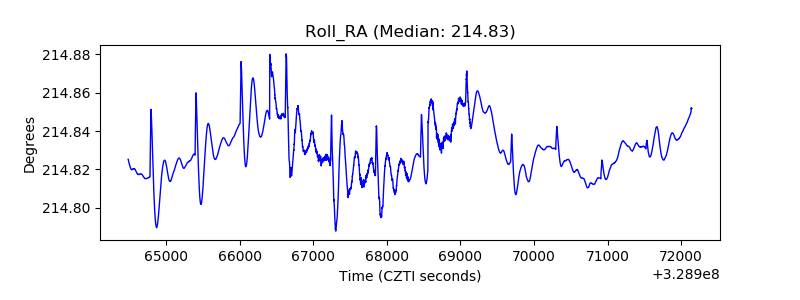 |
| Veto Counter | 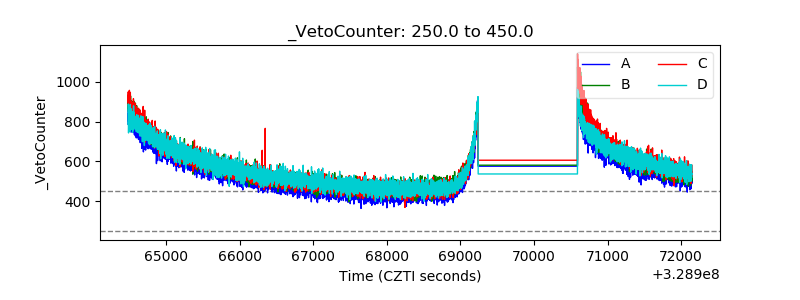 |