| Param | Original file | Final file |
|---|---|---|
| Filename | modeM0/AS1A09_059T01_9000003706_25332cztM0_level2.evt | modeM0/AS1A09_059T01_9000003706_25332cztM0_level2_quad_clean.evt |
| Size (bytes) | 553,487,040 | 108,846,720 |
| Size | 527.8 MB | 103.8 MB |
| Events in quadrant A | 3,191,805 | 765,191 |
| Events in quadrant B | 2,997,859 | 759,618 |
| Events in quadrant C | 3,889,150 | 720,632 |
| Events in quadrant D | 6,302,170 | 657,216 |
| Mode M0 | |||
|---|---|---|---|
| Quadrant | BADHDUFLAG | Total packets | Discarded packets |
| A | 0 | 13011 | 0 |
| B | 0 | 12262 | 0 |
| C | 0 | 14914 | 0 |
| D | 0 | 22786 | 0 |
| Mode M9 | |||
|---|---|---|---|
| Quadrant | BADHDUFLAG | Total packets | Discarded packets |
| A | 0 | 13 | 0 |
| B | 0 | 13 | 0 |
| C | 0 | 13 | 0 |
| D | 0 | 13 | 0 |
| Quadrant | Total seconds | Saturated seconds | Saturation percentage |
|---|---|---|---|
| A | 5631 | 123 | 2.184337% |
| B | 5631 | 131 | 2.326407% |
| C | 5632 | 439 | 7.794744% |
| D | 5632 | 1004 | 17.826705% |
Noise dominated data is calculated using 1-second bins in cleaned event files. If a bin has >2000 counts, and if more than 50% of those come from <1% of pixels, then it is considered to be noise-dominated and hence unusable.
| Quadrant | # 1 sec bins | Bins with >0 counts | Bins with >2000 counts | High rate bins dominated by noise | Noise dominated (total time) | Noise dominated (detector-on time) | Marked lightcurve |
|---|---|---|---|---|---|---|---|
| A | 6901 | 5631 | 0 | 0 | 0.00% | 0.00% | 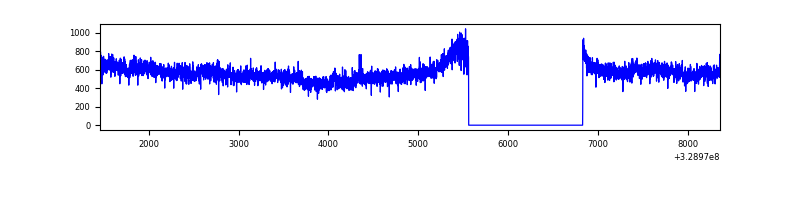 |
| B | 6901 | 5632 | 0 | 0 | 0.00% | 0.00% | 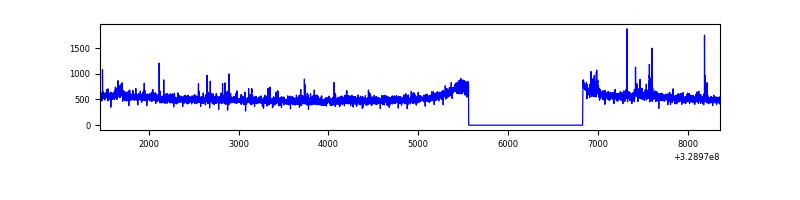 |
| C | 6902 | 5632 | 249 | 249 | 3.61% | 4.42% | 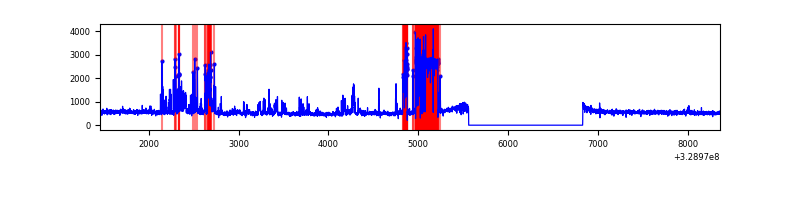 |
| D | 6902 | 5632 | 751 | 751 | 10.88% | 13.33% | 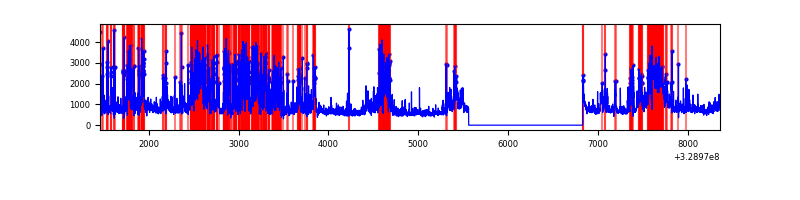 |
Top three noisy pixels from each quadrant. If the there are fewer than three noisy pixels in the level2.evt file, extra rows are filled as -1
| Pixel properties | Quadrant properties | ||||||
|---|---|---|---|---|---|---|---|
| Quadrant | DetID | PixID | Counts | Sigma | Mean | Median | Sigma |
| A | 15 | 173 | 279479 | 1834.99 | 755 | 742 | 151.9 |
| A | 13 | 254 | 8891 | 53.65 | 755 | 742 | 151.9 |
| A | 0 | 226 | 6660 | 38.96 | 755 | 742 | 151.9 |
| B | 3 | 112 | 62192 | 450.2 | 739 | 722 | 136.5 |
| B | 12 | 111 | 16111 | 112.71 | 739 | 722 | 136.5 |
| B | 0 | 190 | 14702 | 102.39 | 739 | 722 | 136.5 |
| C | 9 | 54 | 675603 | 4170.27 | 701 | 707 | 161.8 |
| C | 0 | 207 | 357968 | 2207.56 | 701 | 707 | 161.8 |
| C | 14 | 238 | 112191 | 688.87 | 701 | 707 | 161.8 |
| D | 1 | 52 | 1915578 | 11459.36 | 696 | 677 | 167.1 |
| D | 12 | 235 | 729957 | 4364.24 | 696 | 677 | 167.1 |
| D | 8 | 195 | 505675 | 3022.07 | 696 | 677 | 167.1 |
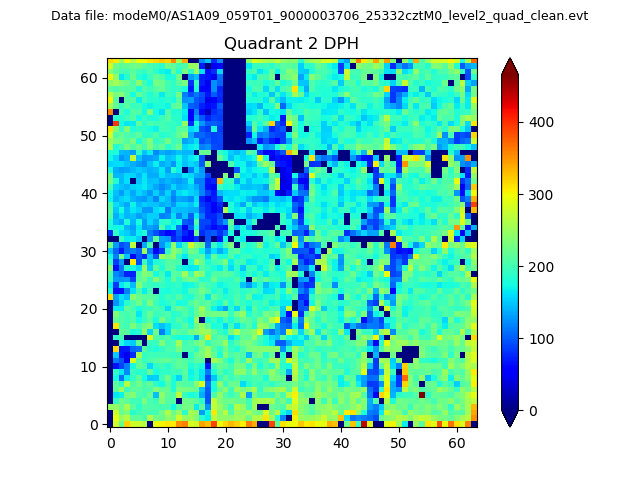
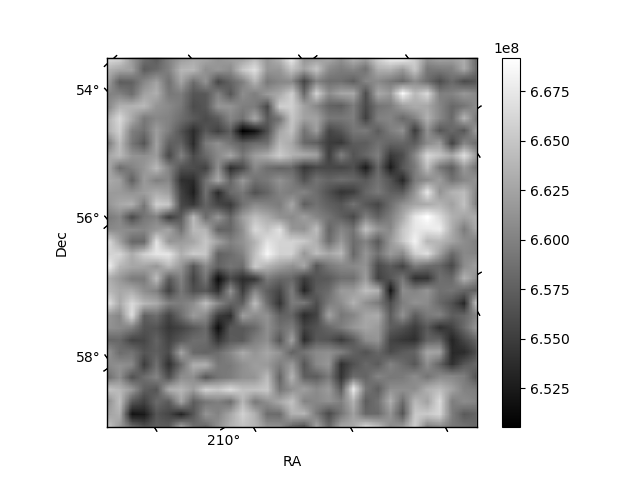
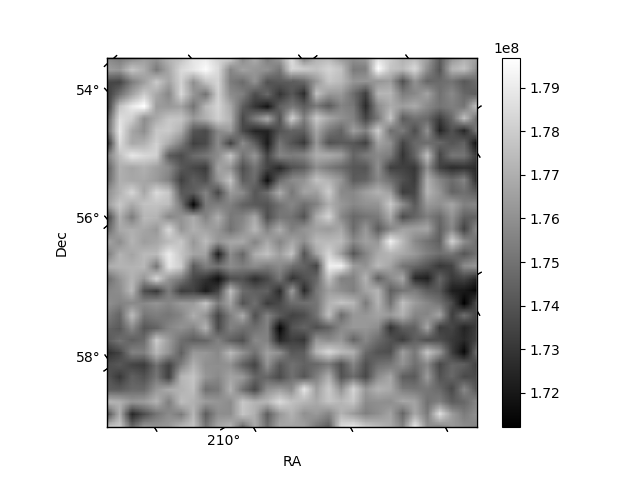
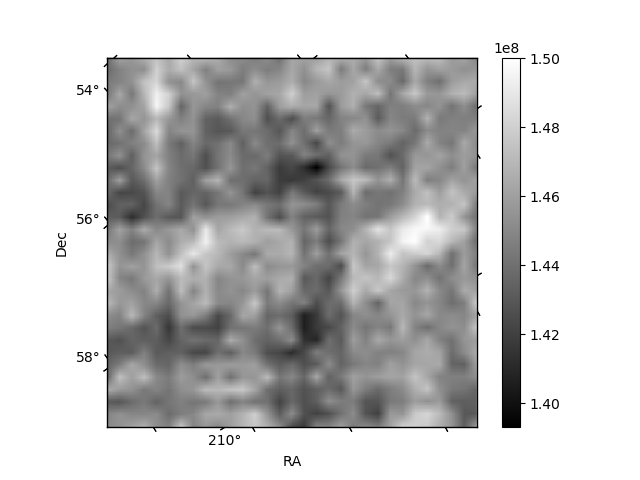
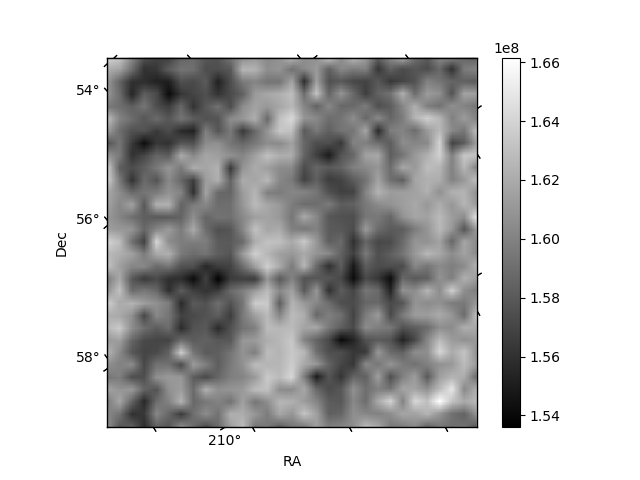
Histogram calculated using DETX and DETY for each event in the final _common_clean file
| Quadrant A | 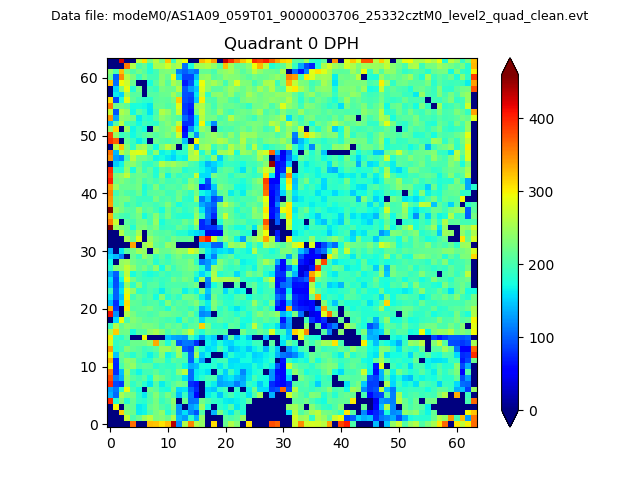 |
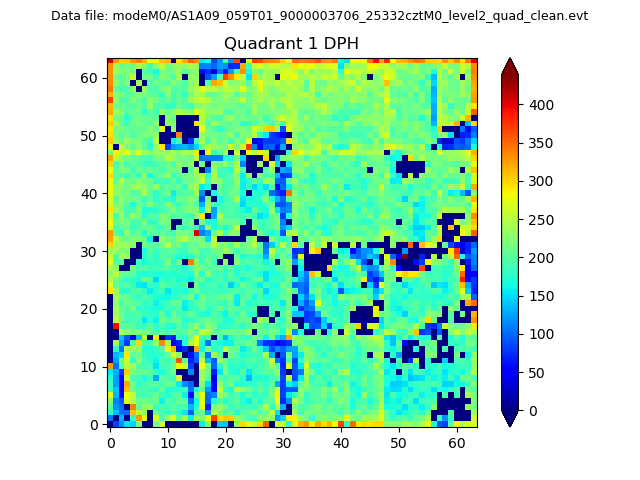 |
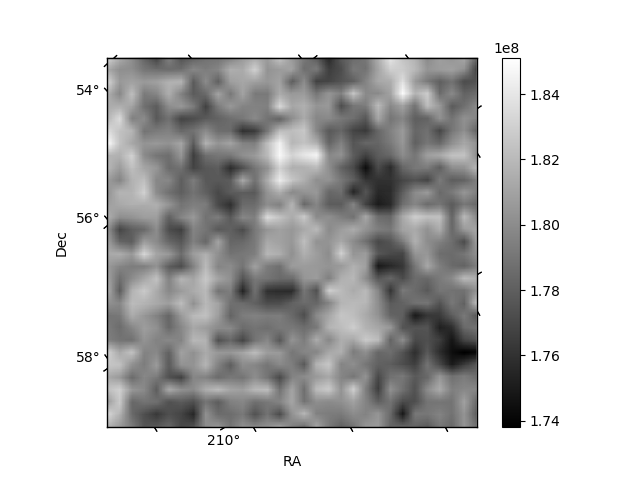
Quadrant B |
|---|---|---|---|
| Quadrant D | 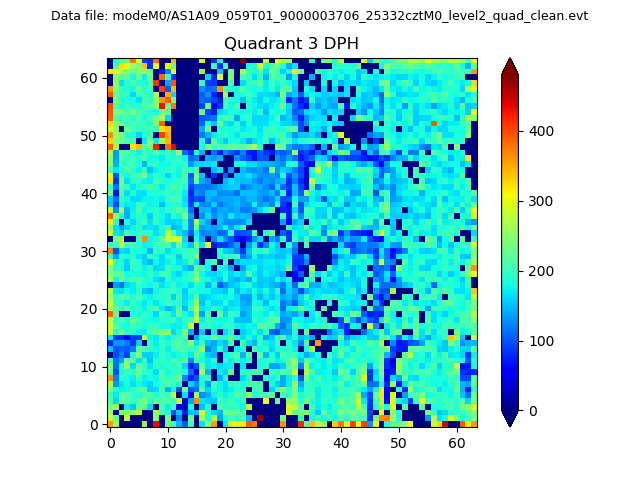 |
 |
Quadrant C |
| Plot type | Count rate plots | Images |
|---|---|---|
| Comparison with Poisson distribution Blue bars denote a histogram of data divided into 1 sec bins. Red curve is a Poisson curve with rate = median count rate of data. |
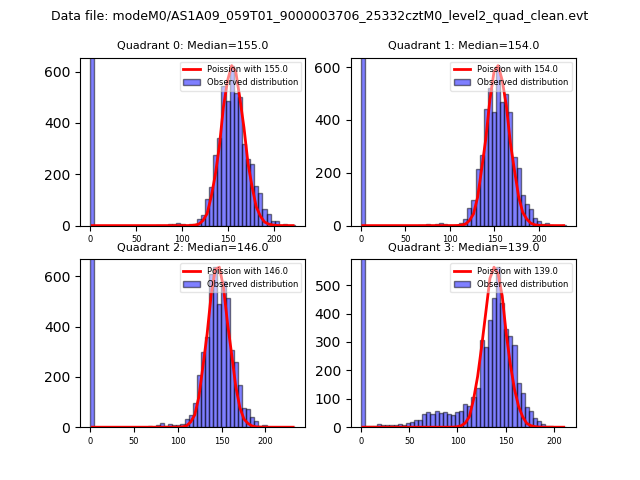 |
 |
| Quadrant-wise count rates Data is divided into 100 sec bins |
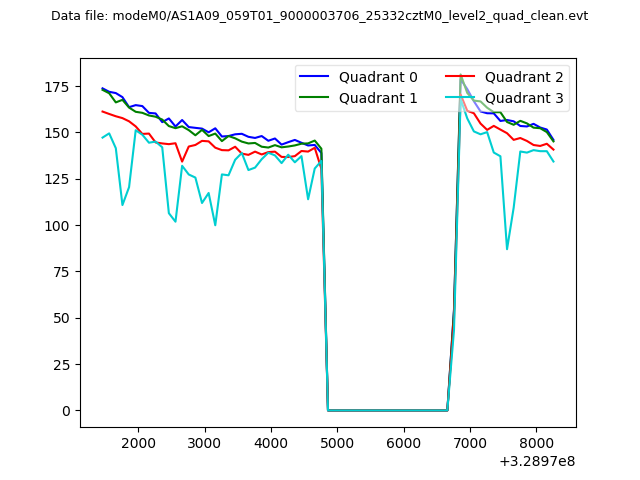 |
|
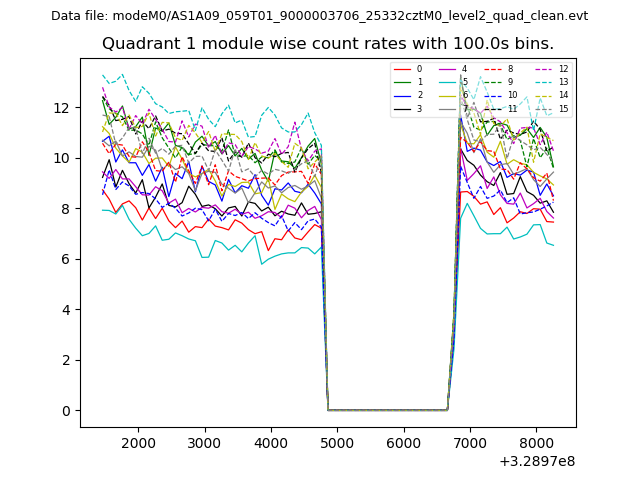
| Module-wise count rates for Quadrant A Data is divided into 100 sec bins |
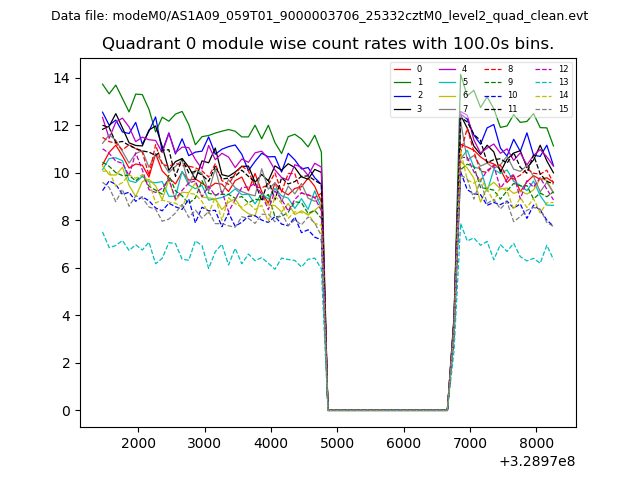 |
 |
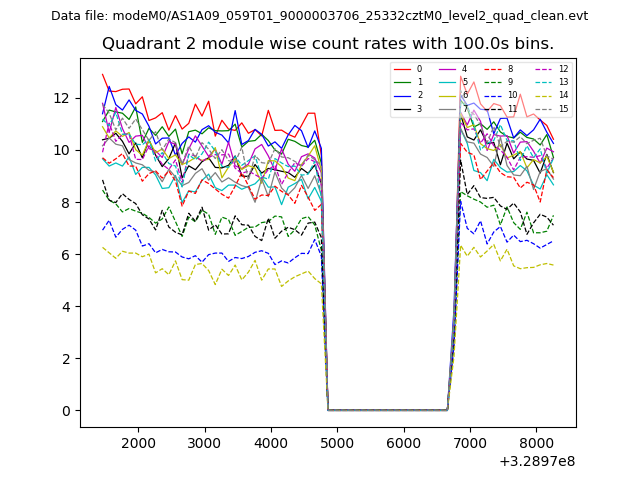
| Module-wise count rates for Quadrant B Data is divided into 100 sec bins |
 |
 |
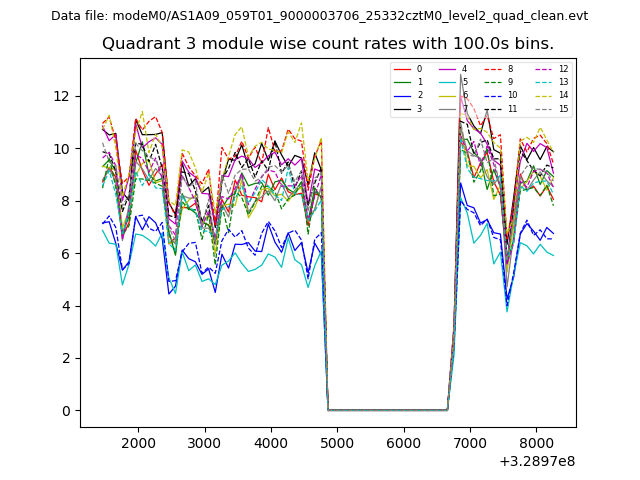
| Module-wise count rates for Quadrant C Data is divided into 100 sec bins |
 |
 |
| Module-wise count rates for Quadrant D Data is divided into 100 sec bins |
 |
 |
| Parameter | Plot |
|---|---|
| CZT HV Monitor | 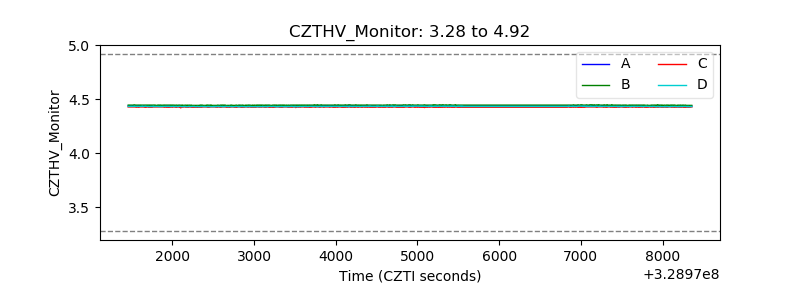 |
| D_VDD | 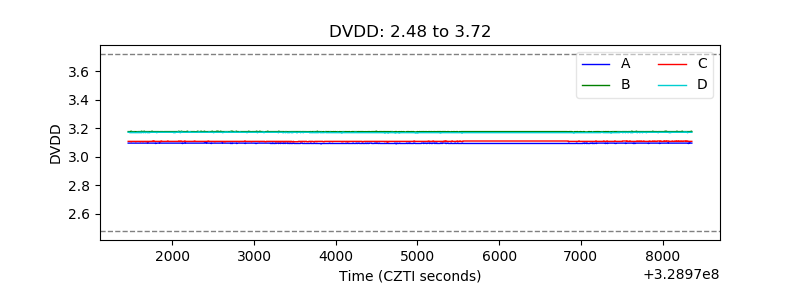 |
| Temperature 1 | 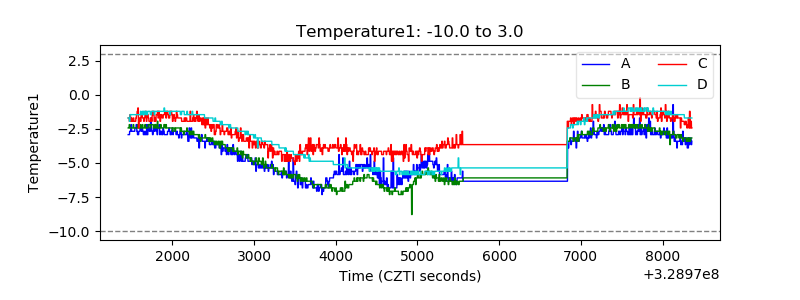 |
| Veto HV Monitor | 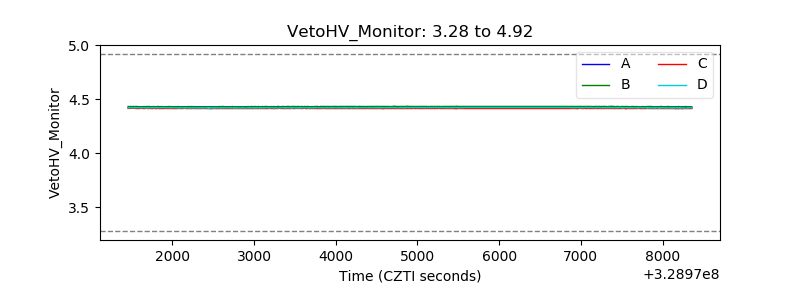 |
| Veto LLD | 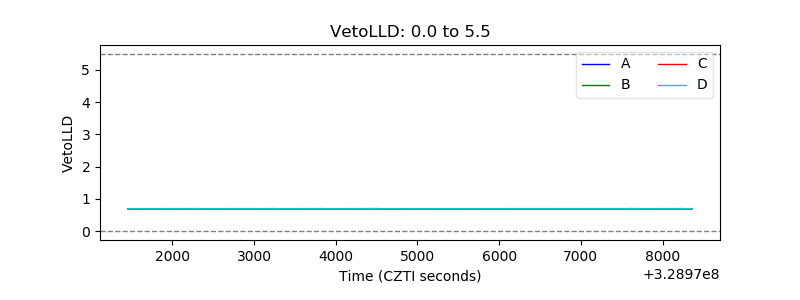 |
| Alpha Counter | 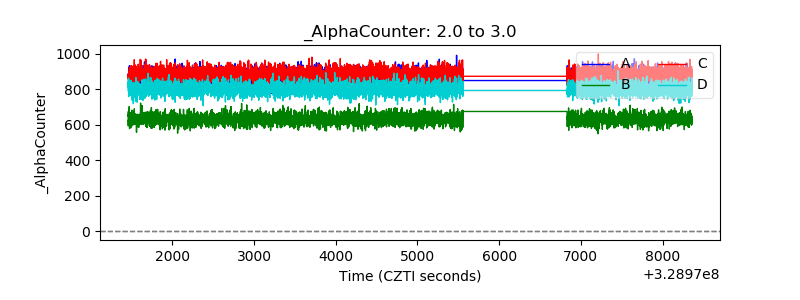 |
| _CPM_Rate | 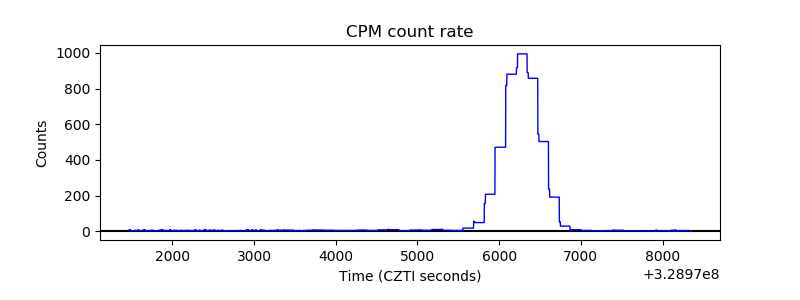 |
| CZT Counter | 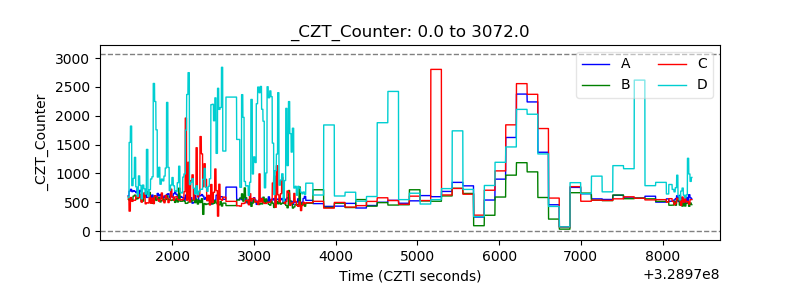 |
| +2.5 Volts monitor | 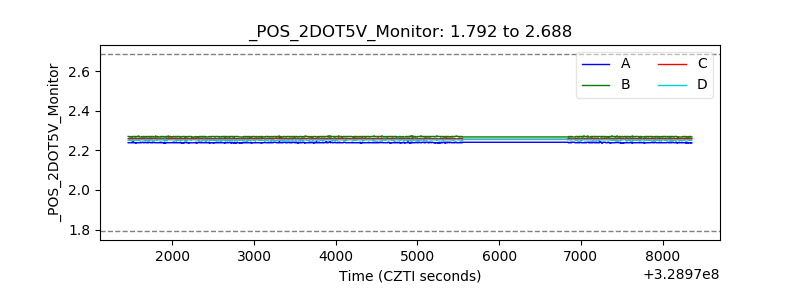 |
| +5 Volts monitor | 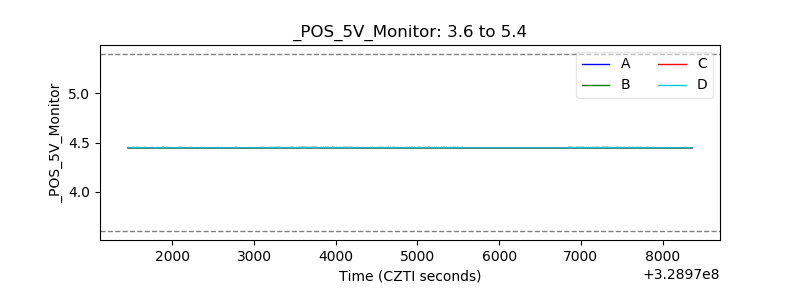 |
| _ROLL_ROT | 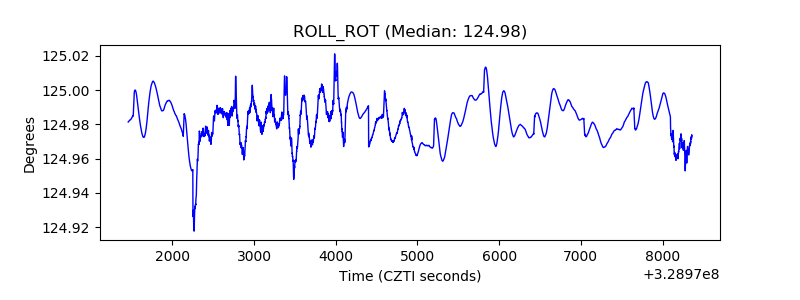 |
| _Roll_DEC | 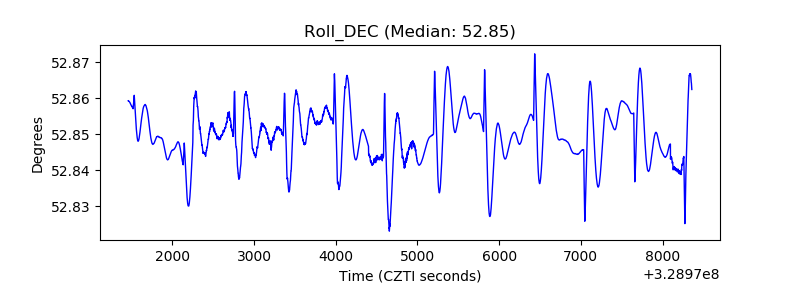 |
| _Roll_RA | 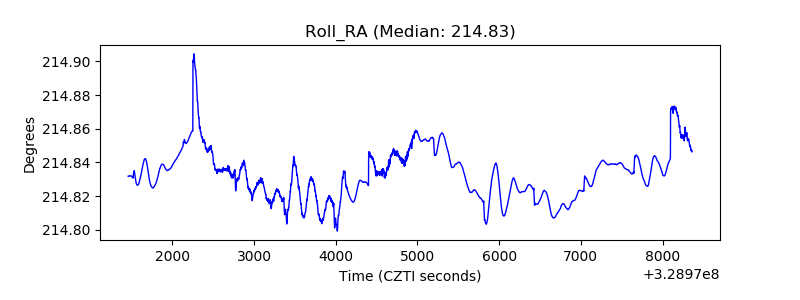 |
| Veto Counter | 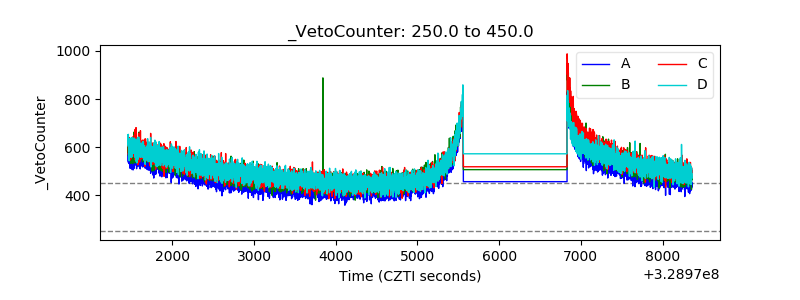 |