| Param | Original file | Final file |
|---|---|---|
| Filename | modeM0/AS1A09_059T01_9000003706_25333cztM0_level2.evt | modeM0/AS1A09_059T01_9000003706_25333cztM0_level2_quad_clean.evt |
| Size (bytes) | 508,014,720 | 100,736,640 |
| Size | 484.5 MB | 96.1 MB |
| Events in quadrant A | 3,560,264 | 676,769 |
| Events in quadrant B | 3,002,619 | 679,496 |
| Events in quadrant C | 3,040,564 | 650,831 |
| Events in quadrant D | 5,371,345 | 620,720 |
| Mode M0 | |||
|---|---|---|---|
| Quadrant | BADHDUFLAG | Total packets | Discarded packets |
| A | 0 | 14719 | 0 |
| B | 0 | 12651 | 0 |
| C | 0 | 12580 | 0 |
| D | 0 | 20353 | 0 |
| Mode M9 | |||
|---|---|---|---|
| Quadrant | BADHDUFLAG | Total packets | Discarded packets |
| A | 0 | 10 | 0 |
| B | 0 | 10 | 0 |
| C | 0 | 10 | 0 |
| D | 0 | 10 | 0 |
| Quadrant | Total seconds | Saturated seconds | Saturation percentage |
|---|---|---|---|
| A | 6061 | 60 | 0.989936% |
| B | 6062 | 45 | 0.742329% |
| C | 6062 | 99 | 1.633124% |
| D | 6062 | 290 | 4.783900% |
Noise dominated data is calculated using 1-second bins in cleaned event files. If a bin has >2000 counts, and if more than 50% of those come from <1% of pixels, then it is considered to be noise-dominated and hence unusable.
| Quadrant | # 1 sec bins | Bins with >0 counts | Bins with >2000 counts | High rate bins dominated by noise | Noise dominated (total time) | Noise dominated (detector-on time) | Marked lightcurve |
|---|---|---|---|---|---|---|---|
| A | 7076 | 6062 | 0 | 0 | 0.00% | 0.00% | 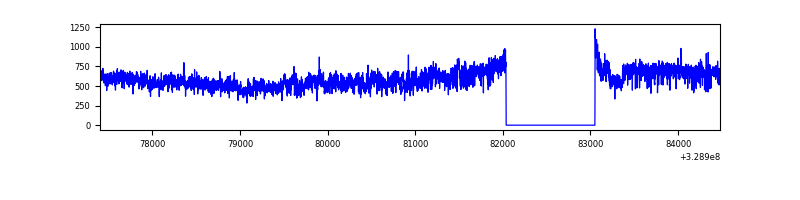 |
| B | 7077 | 6063 | 0 | 0 | 0.00% | 0.00% | 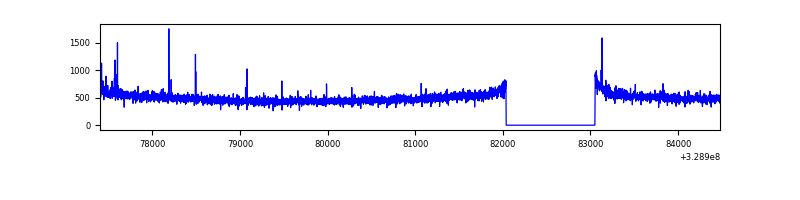 |
| C | 7077 | 6063 | 0 | 0 | 0.00% | 0.00% | 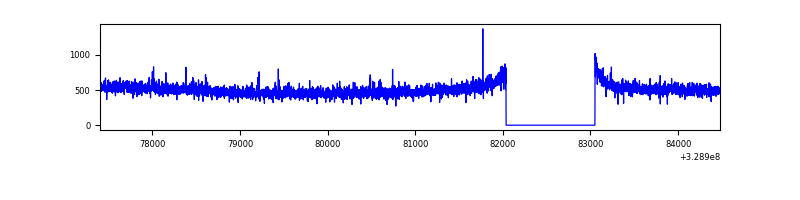 |
| D | 7077 | 6063 | 210 | 210 | 2.97% | 3.46% | 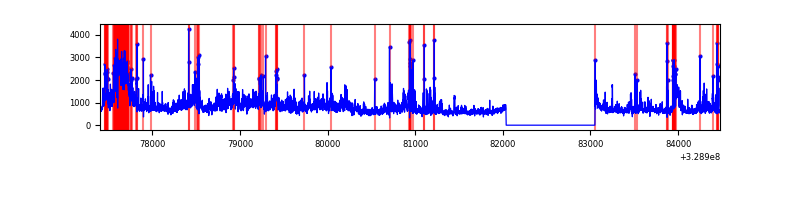 |
Top three noisy pixels from each quadrant. If the there are fewer than three noisy pixels in the level2.evt file, extra rows are filled as -1
| Pixel properties | Quadrant properties | ||||||
|---|---|---|---|---|---|---|---|
| Quadrant | DetID | PixID | Counts | Sigma | Mean | Median | Sigma |
| A | 15 | 173 | 601970 | 3900.34 | 767 | 751 | 154.1 |
| A | 13 | 254 | 9834 | 58.92 | 767 | 751 | 154.1 |
| A | 3 | 137 | 6649 | 38.26 | 767 | 751 | 154.1 |
| B | 3 | 112 | 19651 | 134.33 | 757 | 738 | 140.8 |
| B | 12 | 111 | 17028 | 115.7 | 757 | 738 | 140.8 |
| B | 0 | 190 | 15393 | 104.08 | 757 | 738 | 140.8 |
| C | 14 | 238 | 119344 | 683.86 | 741 | 744 | 173.4 |
| C | 0 | 207 | 22979 | 128.21 | 741 | 744 | 173.4 |
| C | 2 | 16 | 7461 | 38.73 | 741 | 744 | 173.4 |
| D | 12 | 235 | 905661 | 5098.33 | 740 | 719 | 177.5 |
| D | 8 | 195 | 822585 | 4630.29 | 740 | 719 | 177.5 |
| D | 1 | 52 | 469402 | 2640.5 | 740 | 719 | 177.5 |
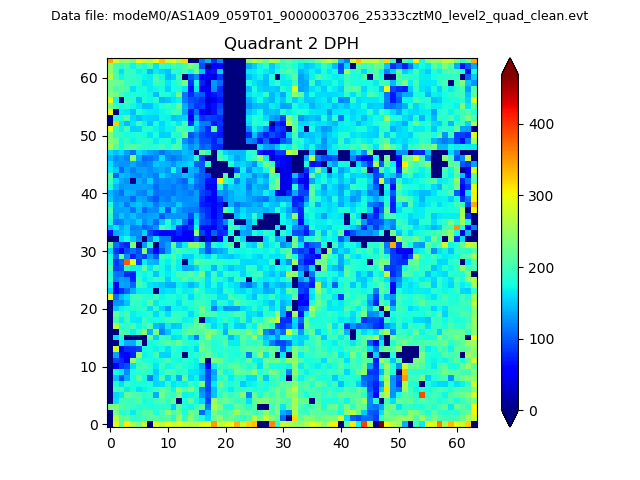
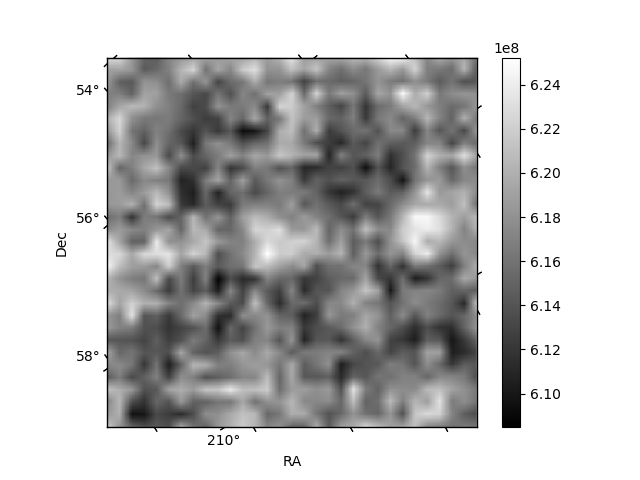
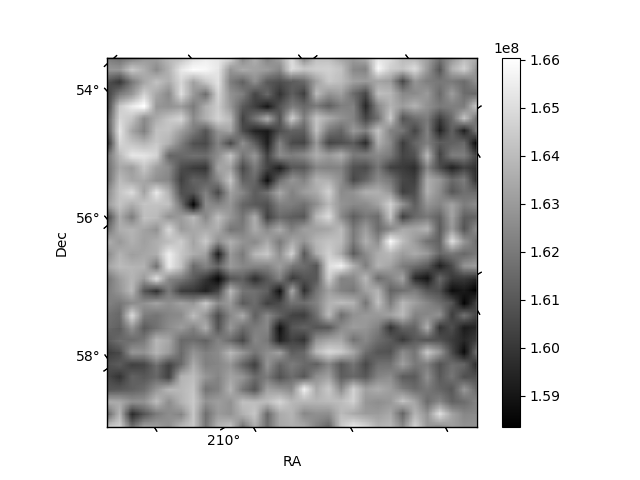
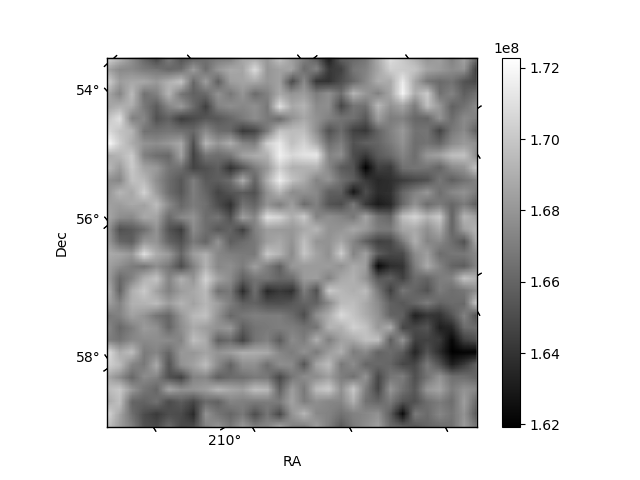
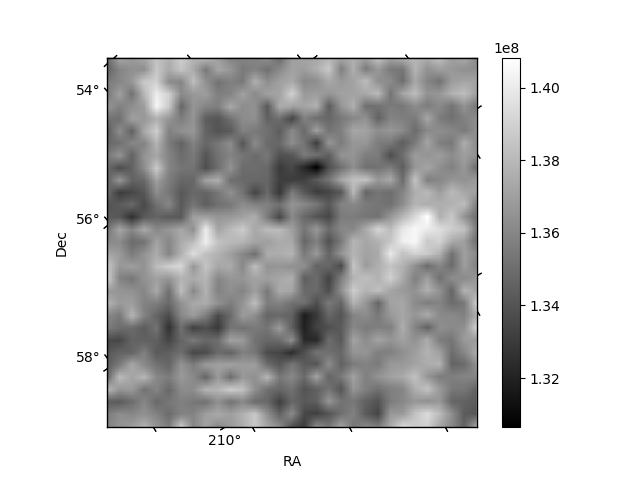
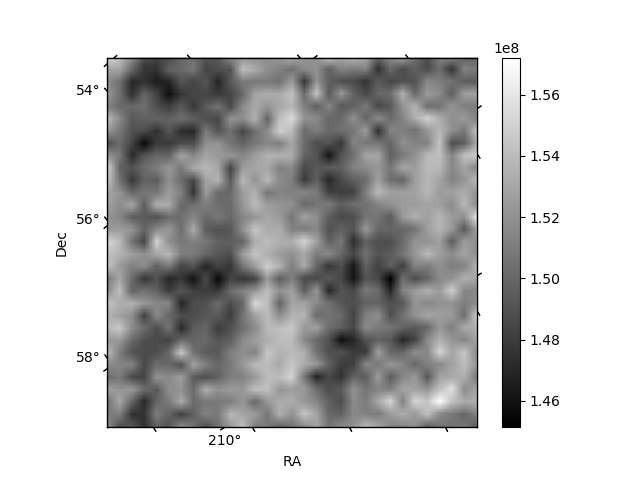
Histogram calculated using DETX and DETY for each event in the final _common_clean file
| Quadrant A | 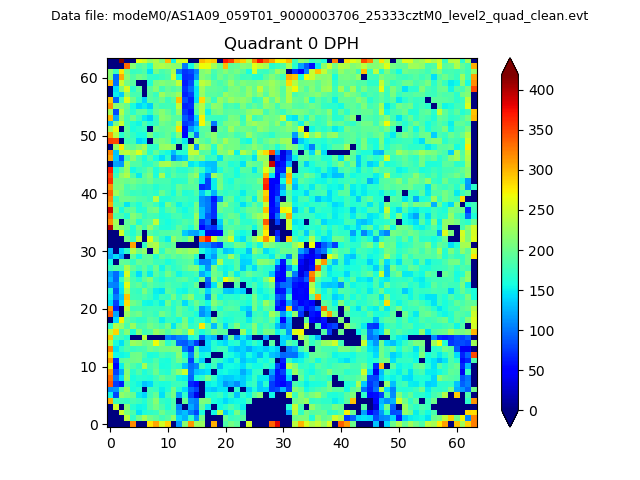 |
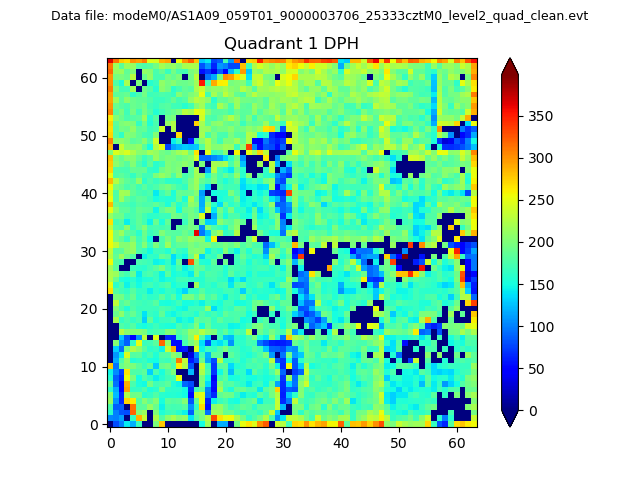 |
Quadrant B |
|---|---|---|---|
| Quadrant D | 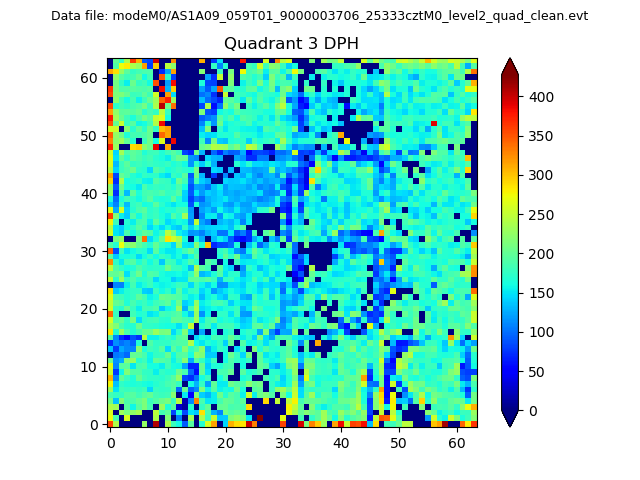 |
 |
Quadrant C |
| Plot type | Count rate plots | Images |
|---|---|---|
| Comparison with Poisson distribution Blue bars denote a histogram of data divided into 1 sec bins. Red curve is a Poisson curve with rate = median count rate of data. |
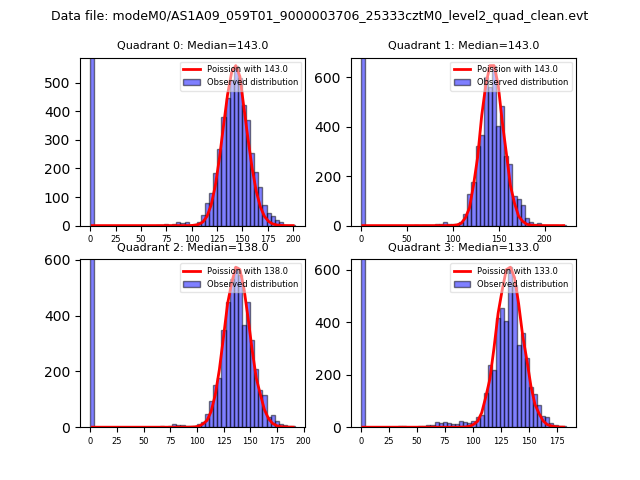 |
 |
| Quadrant-wise count rates Data is divided into 100 sec bins |
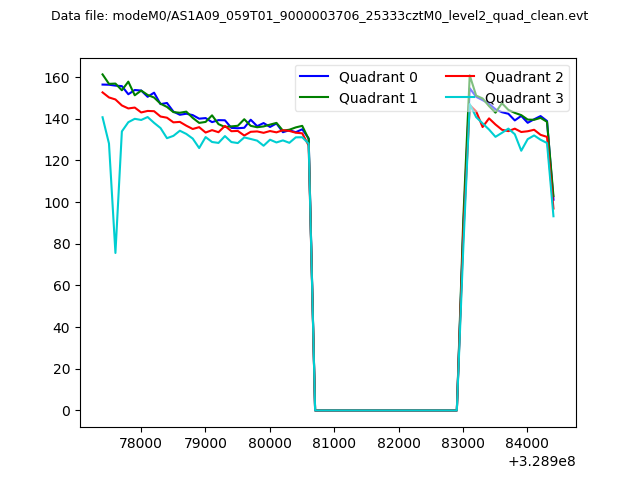 |
|
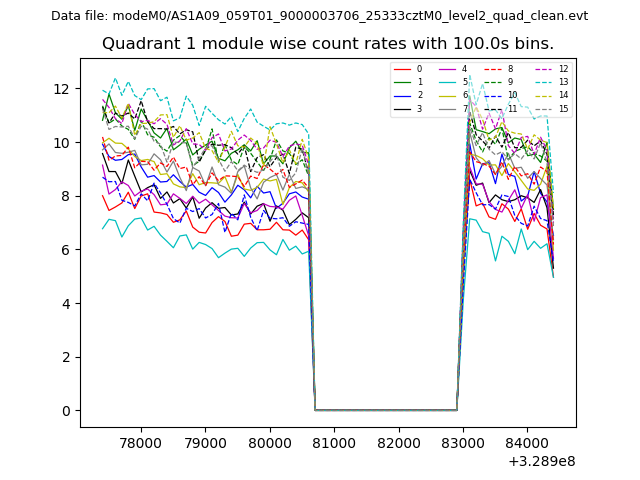
| Module-wise count rates for Quadrant A Data is divided into 100 sec bins |
 |
 |
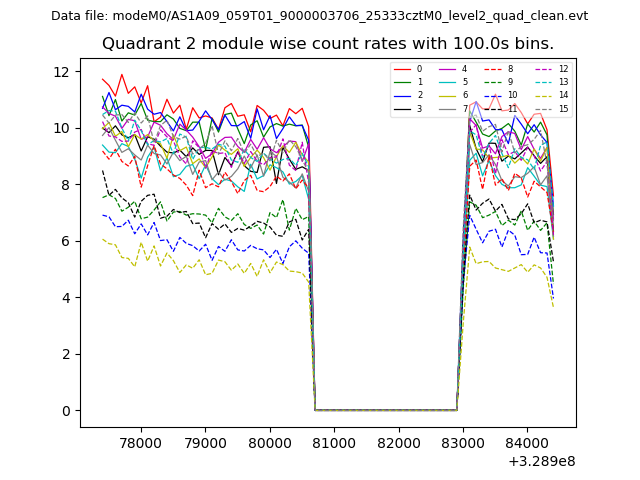
| Module-wise count rates for Quadrant B Data is divided into 100 sec bins |
 |
 |
| Module-wise count rates for Quadrant C Data is divided into 100 sec bins |
 |
 |
| Module-wise count rates for Quadrant D Data is divided into 100 sec bins |
 |
 |
| Parameter | Plot |
|---|---|
| CZT HV Monitor | 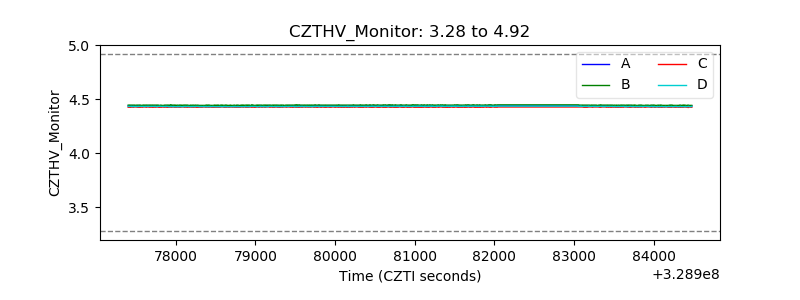 |
| D_VDD | 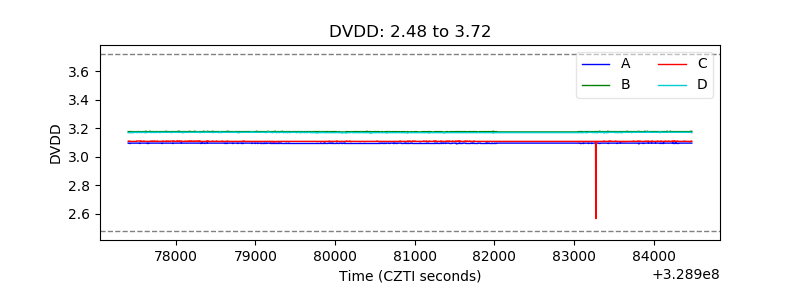 |
| Temperature 1 | 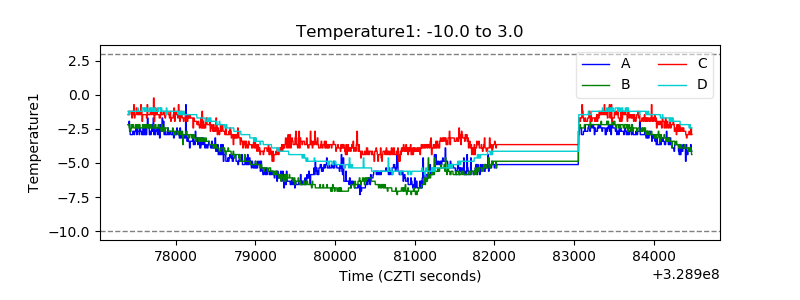 |
| Veto HV Monitor | 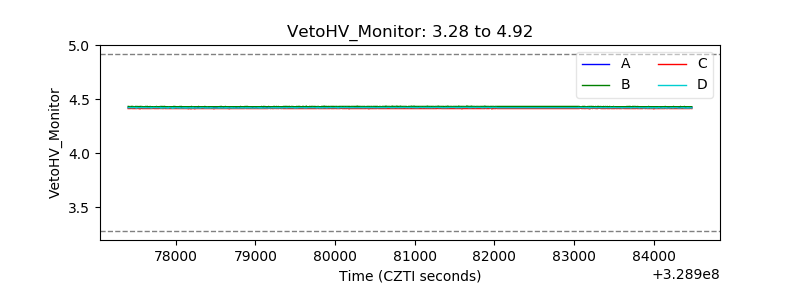 |
| Veto LLD | 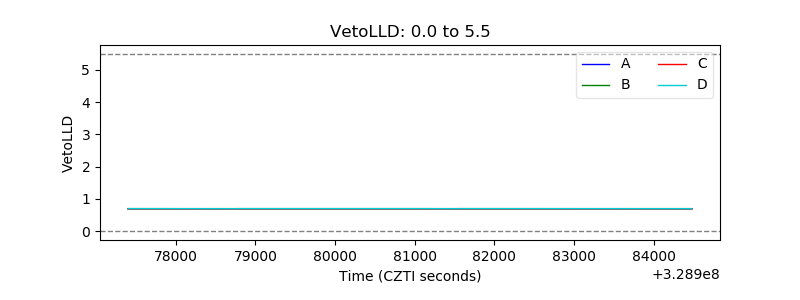 |
| Alpha Counter | 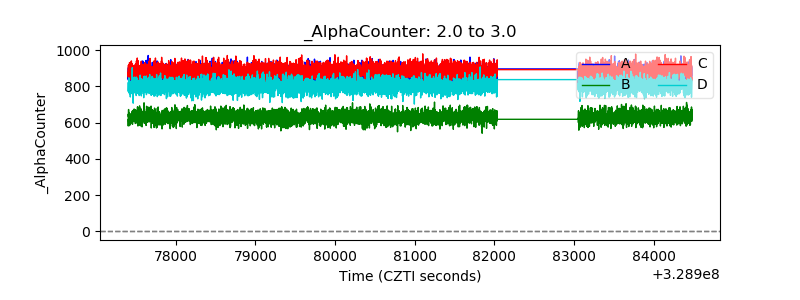 |
| _CPM_Rate | 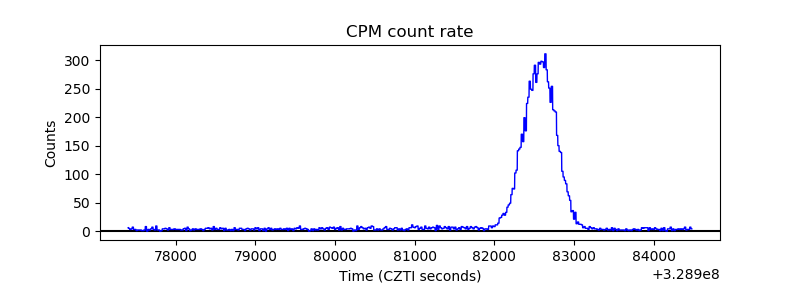 |
| CZT Counter | 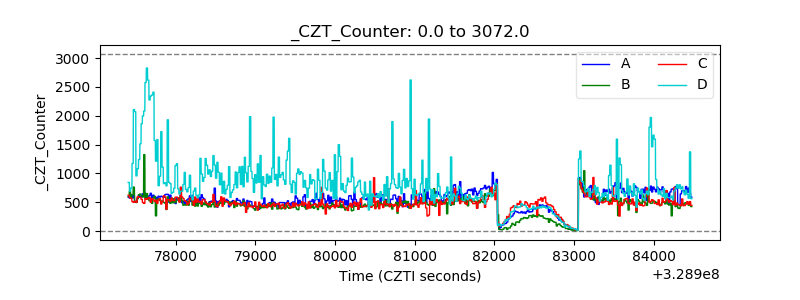 |
| +2.5 Volts monitor |  |
| +5 Volts monitor | 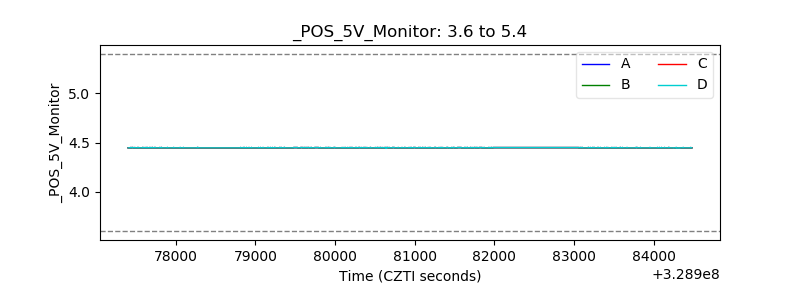 |
| _ROLL_ROT |  |
| _Roll_DEC | 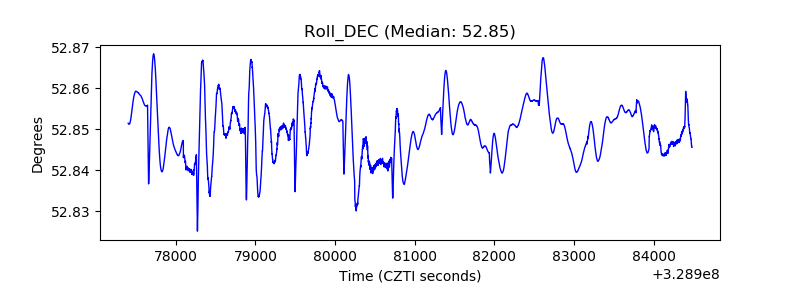 |
| _Roll_RA | 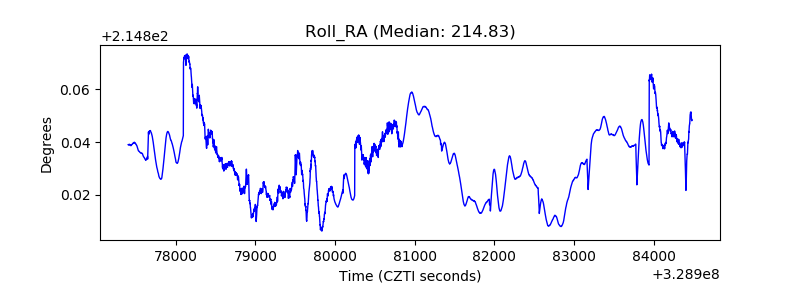 |
| Veto Counter | 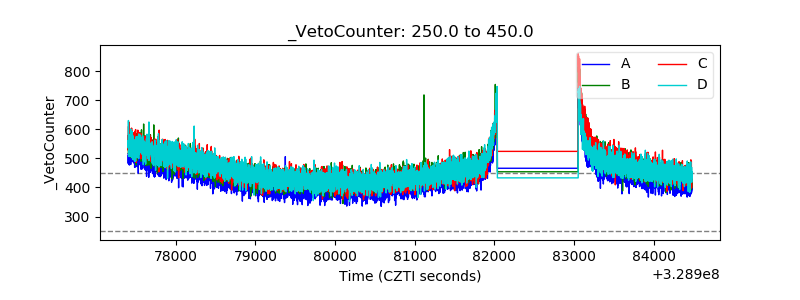 |