| Param | Original file | Final file |
|---|---|---|
| Filename | modeM0/AS1A09_059T01_9000003706_25334cztM0_level2.evt | modeM0/AS1A09_059T01_9000003706_25334cztM0_level2_quad_clean.evt |
| Size (bytes) | 539,447,040 | 98,953,920 |
| Size | 514.5 MB | 94.4 MB |
| Events in quadrant A | 3,912,613 | 650,955 |
| Events in quadrant B | 3,227,992 | 652,105 |
| Events in quadrant C | 3,278,349 | 625,188 |
| Events in quadrant D | 5,461,734 | 599,000 |
| Mode M0 | |||
|---|---|---|---|
| Quadrant | BADHDUFLAG | Total packets | Discarded packets |
| A | 0 | 16583 | 0 |
| B | 0 | 13873 | 0 |
| C | 0 | 13886 | 0 |
| D | 0 | 20816 | 0 |
| Mode M9 | |||
|---|---|---|---|
| Quadrant | BADHDUFLAG | Total packets | Discarded packets |
| A | 0 | 5 | 0 |
| B | 0 | 5 | 0 |
| C | 0 | 5 | 0 |
| D | 0 | 5 | 0 |
| Quadrant | Total seconds | Saturated seconds | Saturation percentage |
|---|---|---|---|
| A | 6729 | 65 | 0.965968% |
| B | 6730 | 74 | 1.099554% |
| C | 6730 | 107 | 1.589896% |
| D | 6730 | 319 | 4.739970% |
Noise dominated data is calculated using 1-second bins in cleaned event files. If a bin has >2000 counts, and if more than 50% of those come from <1% of pixels, then it is considered to be noise-dominated and hence unusable.
| Quadrant | # 1 sec bins | Bins with >0 counts | Bins with >2000 counts | High rate bins dominated by noise | Noise dominated (total time) | Noise dominated (detector-on time) | Marked lightcurve |
|---|---|---|---|---|---|---|---|
| A | 7309 | 6730 | 0 | 0 | 0.00% | 0.00% | 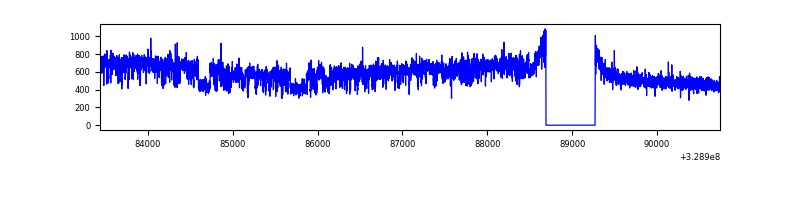 |
| B | 7310 | 6731 | 0 | 0 | 0.00% | 0.00% | 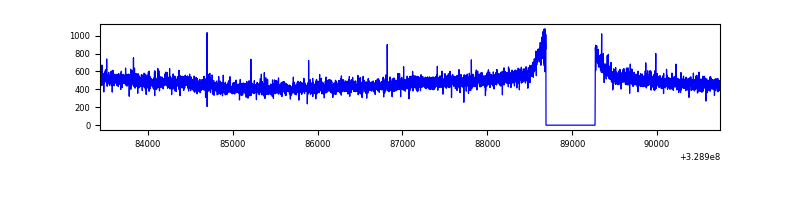 |
| C | 7310 | 6731 | 0 | 0 | 0.00% | 0.00% | 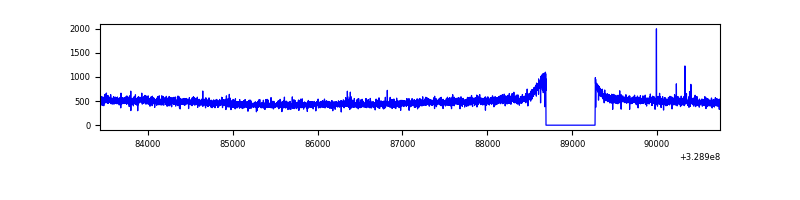 |
| D | 7310 | 6731 | 196 | 196 | 2.68% | 2.91% | 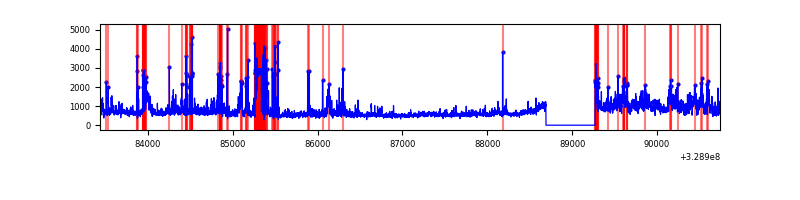 |
Top three noisy pixels from each quadrant. If the there are fewer than three noisy pixels in the level2.evt file, extra rows are filled as -1
| Pixel properties | Quadrant properties | ||||||
|---|---|---|---|---|---|---|---|
| Quadrant | DetID | PixID | Counts | Sigma | Mean | Median | Sigma |
| A | 15 | 173 | 697247 | 4174.04 | 832 | 815 | 166.8 |
| A | 13 | 254 | 11438 | 63.67 | 832 | 815 | 166.8 |
| A | 3 | 137 | 7605 | 40.7 | 832 | 815 | 166.8 |
| B | 12 | 111 | 19038 | 115.78 | 822 | 801 | 157.5 |
| B | 11 | 111 | 16745 | 101.22 | 822 | 801 | 157.5 |
| B | 14 | 111 | 14908 | 89.56 | 822 | 801 | 157.5 |
| C | 14 | 238 | 128411 | 680.11 | 803 | 805 | 187.6 |
| C | 2 | 16 | 11143 | 55.1 | 803 | 805 | 187.6 |
| C | 0 | 207 | 5547 | 25.27 | 803 | 805 | 187.6 |
| D | 12 | 235 | 1208763 | 6183.89 | 804 | 781 | 195.3 |
| D | 1 | 52 | 601862 | 3077.04 | 804 | 781 | 195.3 |
| D | 8 | 195 | 409244 | 2091.0 | 804 | 781 | 195.3 |
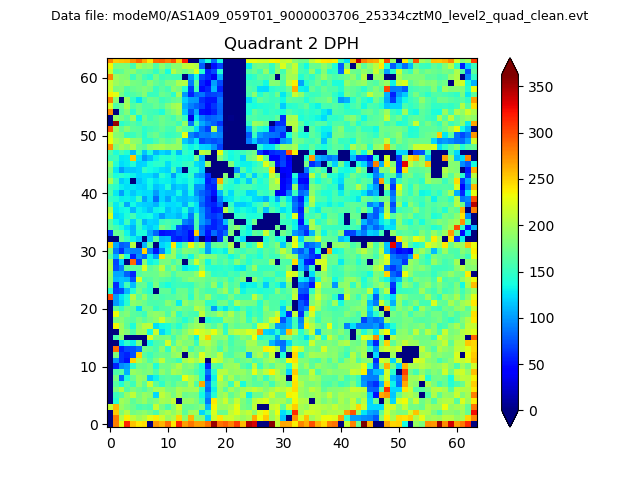
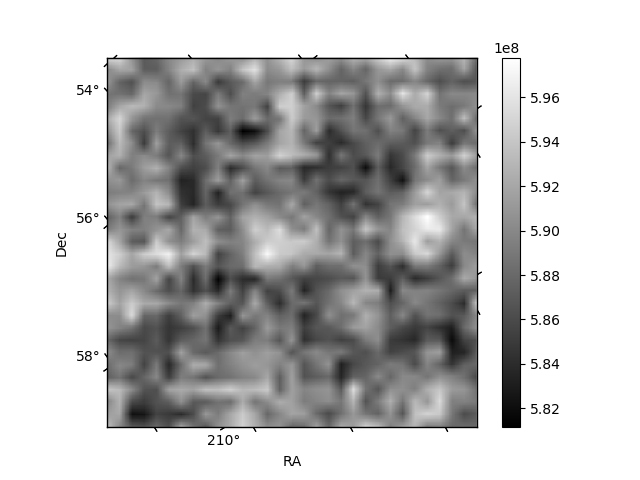
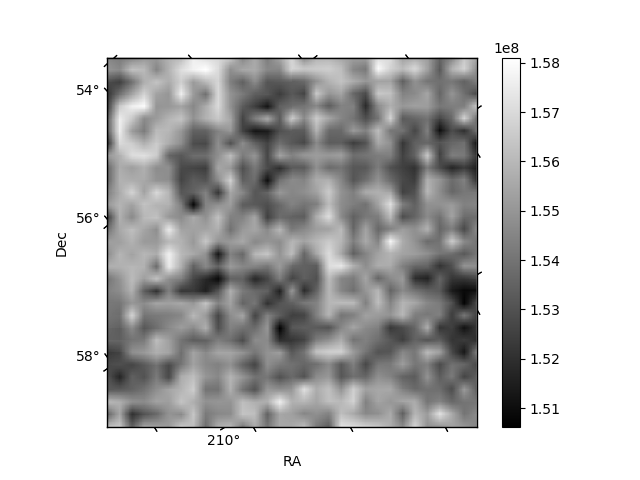
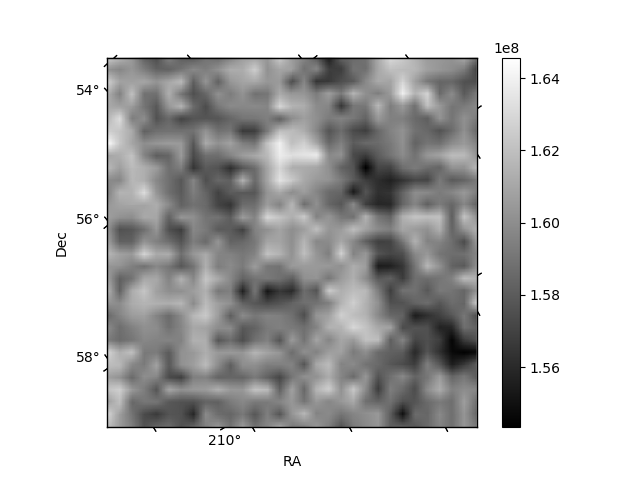
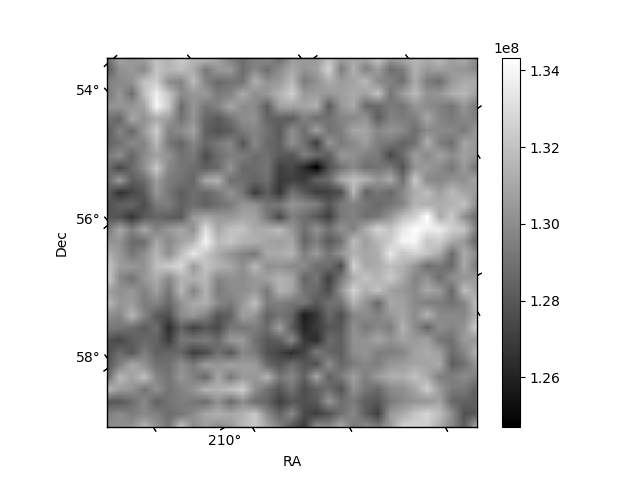
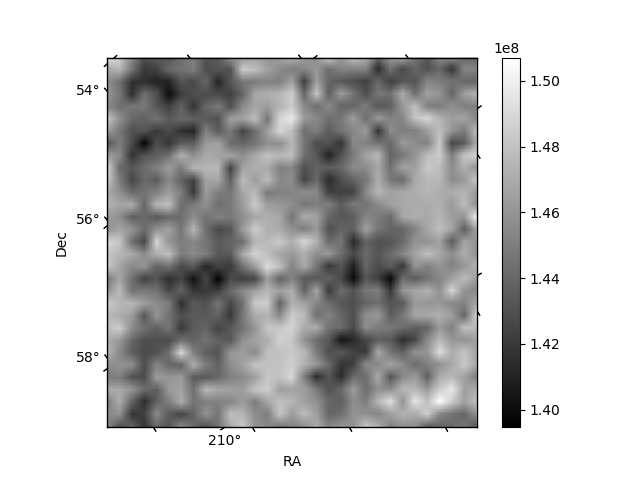
Histogram calculated using DETX and DETY for each event in the final _common_clean file
| Quadrant A | 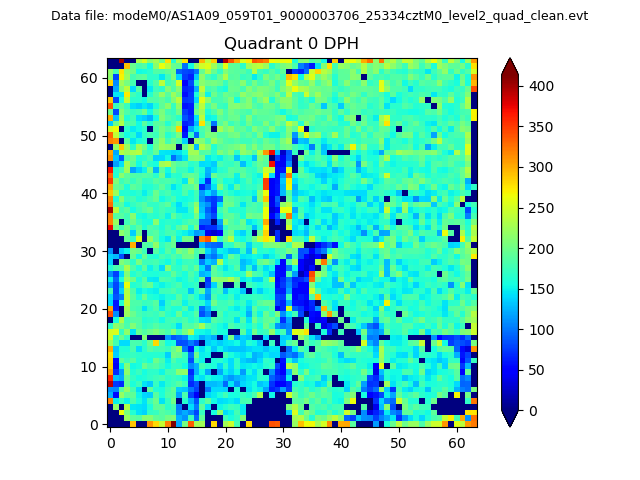 |
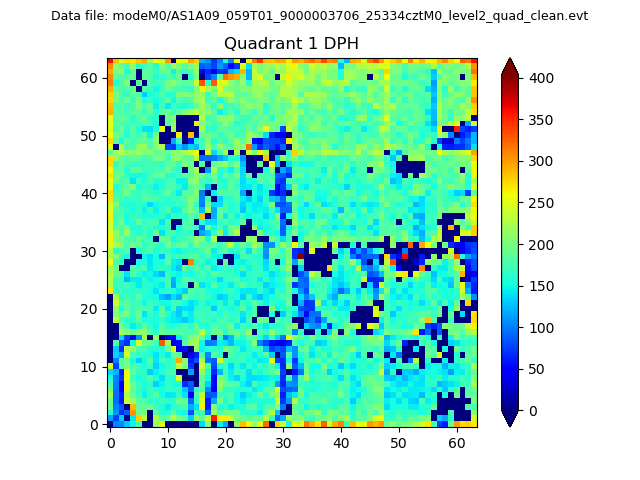 |
Quadrant B |
|---|---|---|---|
| Quadrant D | 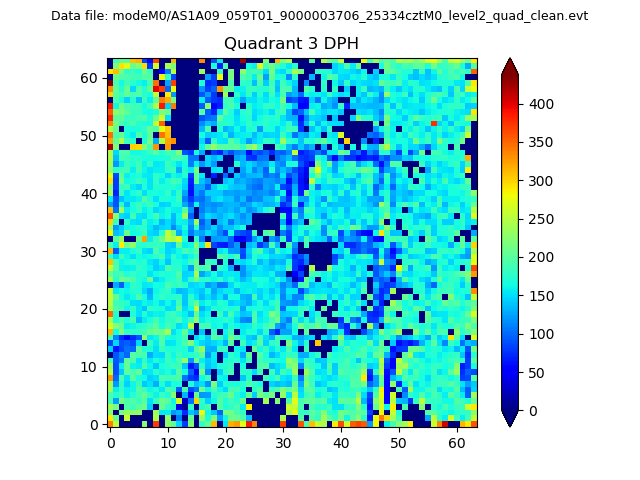 |
 |
Quadrant C |
| Plot type | Count rate plots | Images |
|---|---|---|
| Comparison with Poisson distribution Blue bars denote a histogram of data divided into 1 sec bins. Red curve is a Poisson curve with rate = median count rate of data. |
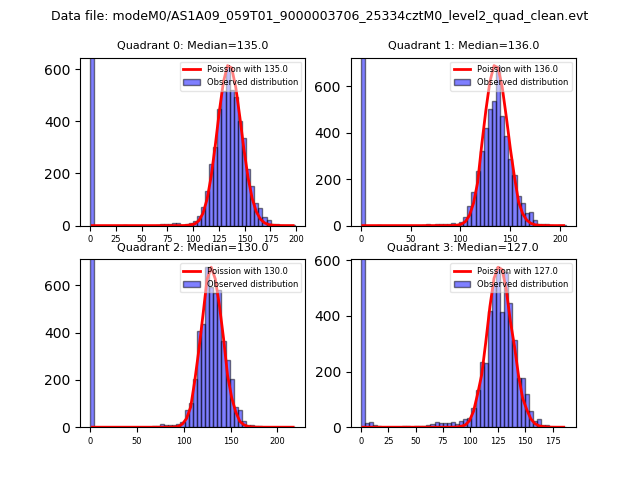 |
 |
| Quadrant-wise count rates Data is divided into 100 sec bins |
 |
|
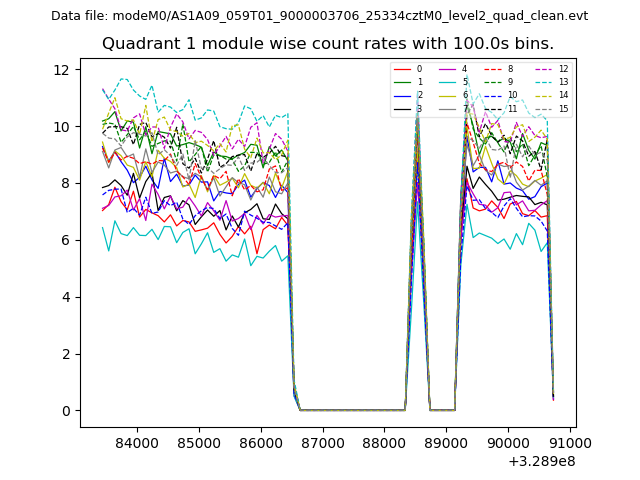
| Module-wise count rates for Quadrant A Data is divided into 100 sec bins |
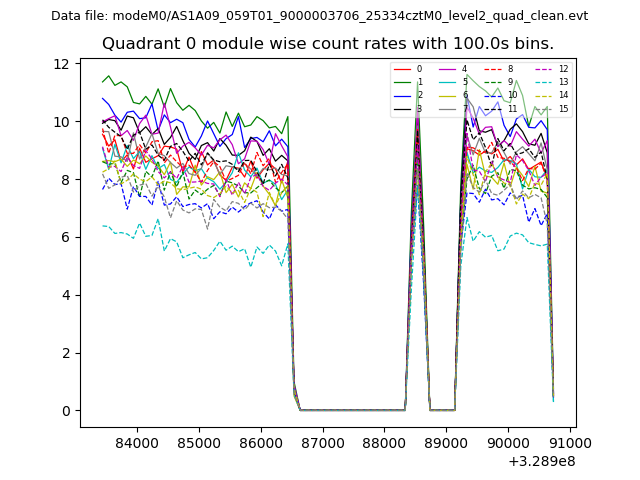 |
 |
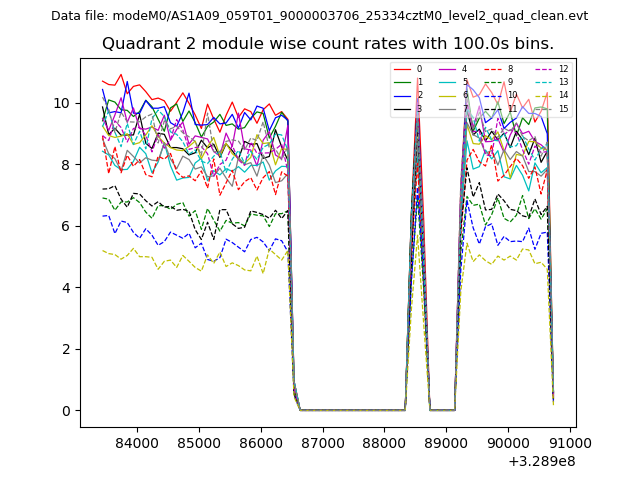
| Module-wise count rates for Quadrant B Data is divided into 100 sec bins |
 |
 |
| Module-wise count rates for Quadrant C Data is divided into 100 sec bins |
 |
 |
| Module-wise count rates for Quadrant D Data is divided into 100 sec bins |
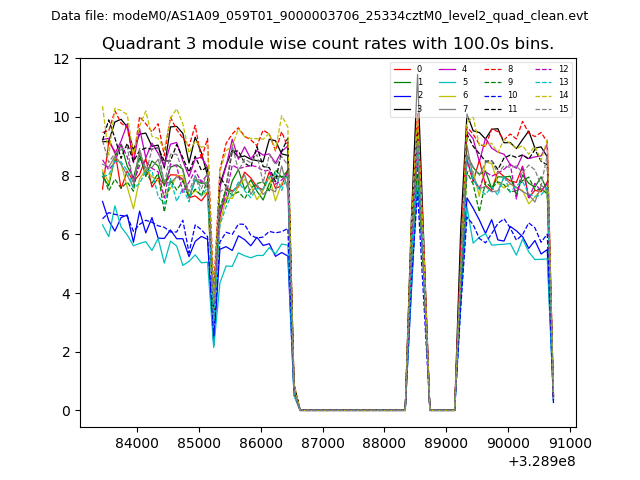 |
 |
| Parameter | Plot |
|---|---|
| CZT HV Monitor | 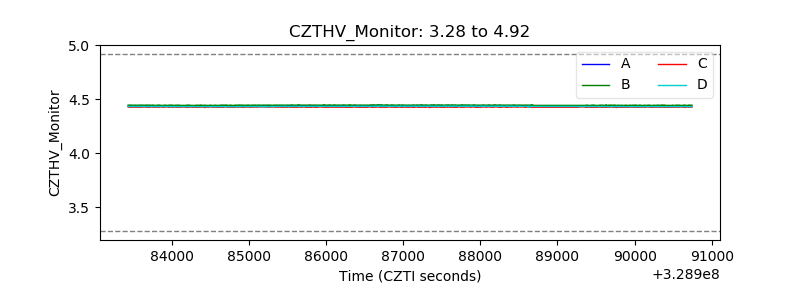 |
| D_VDD | 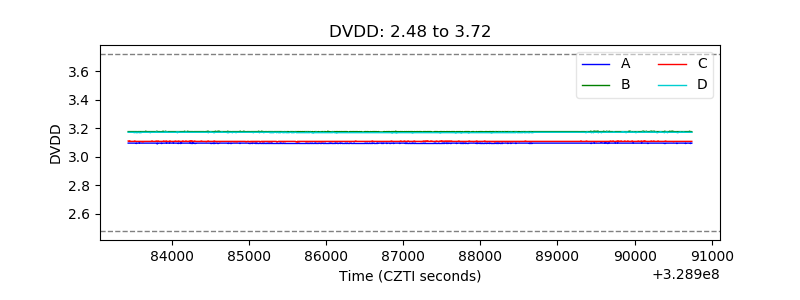 |
| Temperature 1 | 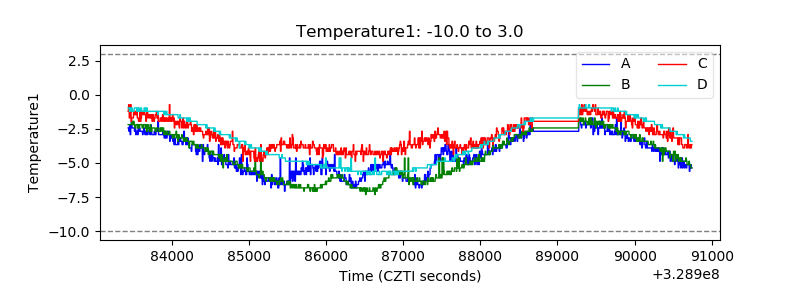 |
| Veto HV Monitor |  |
| Veto LLD |  |
| Alpha Counter | 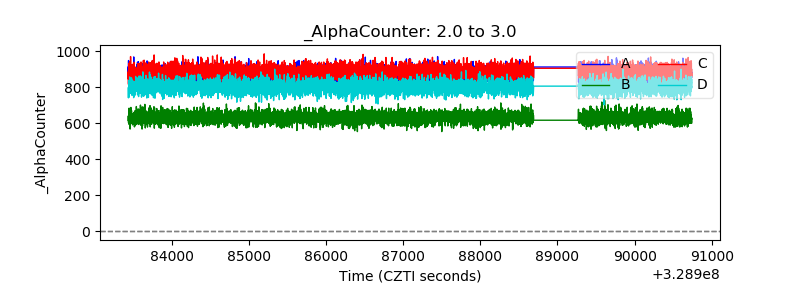 |
| _CPM_Rate | 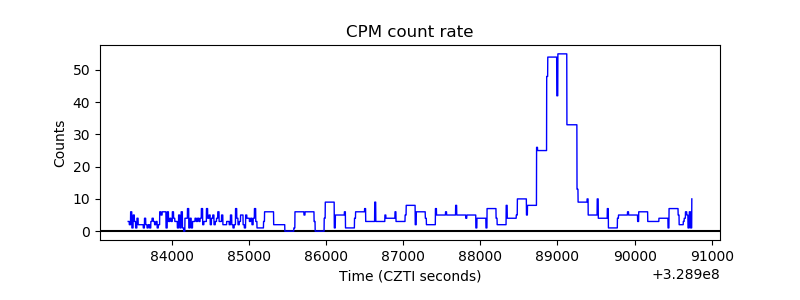 |
| CZT Counter | 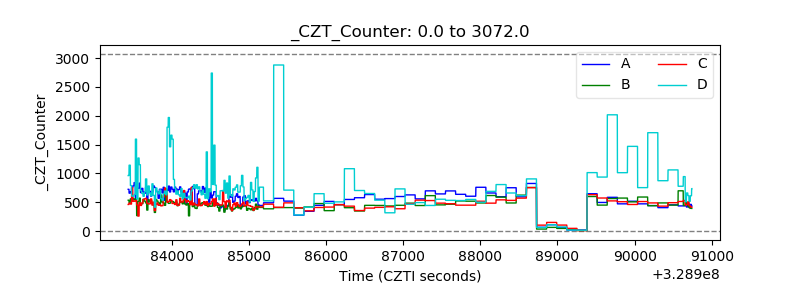 |
| +2.5 Volts monitor |  |
| +5 Volts monitor |  |
| _ROLL_ROT | 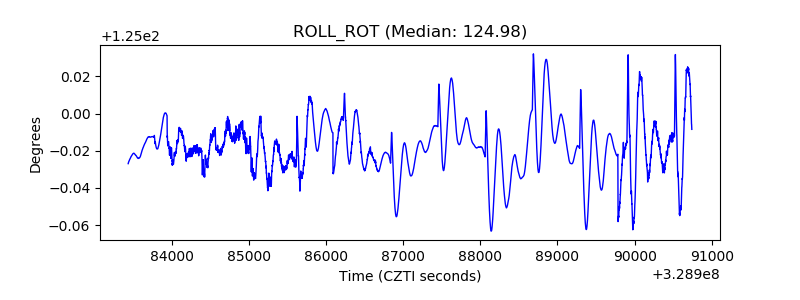 |
| _Roll_DEC | 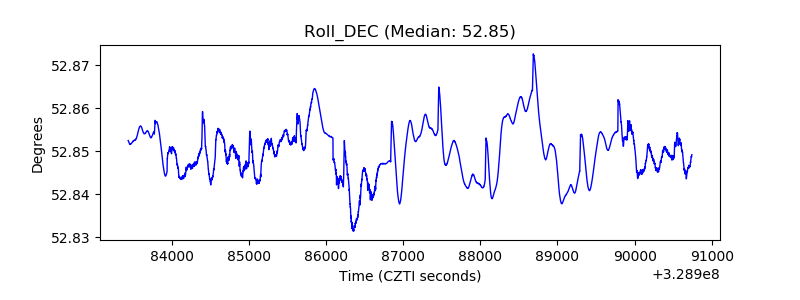 |
| _Roll_RA | 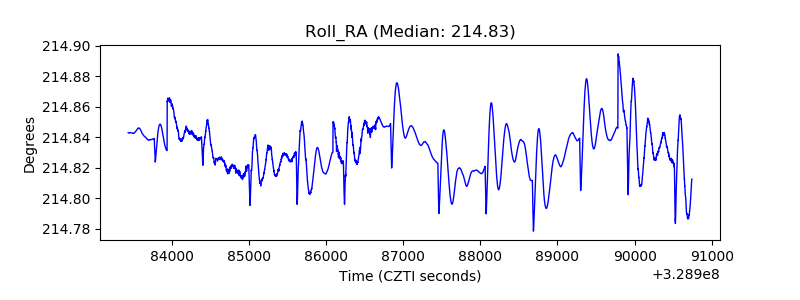 |
| Veto Counter | 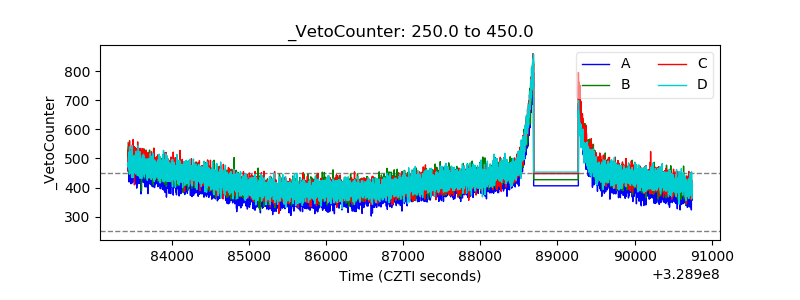 |