| Param | Original file | Final file |
|---|---|---|
| Filename | modeM0/AS1A09_059T01_9000003706_25335cztM0_level2.evt | modeM0/AS1A09_059T01_9000003706_25335cztM0_level2_quad_clean.evt |
| Size (bytes) | 587,900,160 | 112,256,640 |
| Size | 560.7 MB | 107.1 MB |
| Events in quadrant A | 3,564,532 | 744,927 |
| Events in quadrant B | 3,608,676 | 745,594 |
| Events in quadrant C | 3,672,642 | 713,097 |
| Events in quadrant D | 6,450,577 | 674,324 |
| Mode M0 | |||
|---|---|---|---|
| Quadrant | BADHDUFLAG | Total packets | Discarded packets |
| A | 0 | 15547 | 0 |
| B | 0 | 15654 | 0 |
| C | 0 | 15720 | 0 |
| D | 0 | 24168 | 0 |
| Mode M9 | |||
|---|---|---|---|
| Quadrant | BADHDUFLAG | Total packets | Discarded packets |
| A | 0 | 3 | 0 |
| B | 0 | 3 | 0 |
| C | 0 | 3 | 0 |
| D | 0 | 3 | 0 |
| Quadrant | Total seconds | Saturated seconds | Saturation percentage |
|---|---|---|---|
| A | 7504 | 34 | 0.453092% |
| B | 7504 | 61 | 0.812900% |
| C | 7504 | 98 | 1.305970% |
| D | 7505 | 571 | 7.608261% |
Noise dominated data is calculated using 1-second bins in cleaned event files. If a bin has >2000 counts, and if more than 50% of those come from <1% of pixels, then it is considered to be noise-dominated and hence unusable.
| Quadrant | # 1 sec bins | Bins with >0 counts | Bins with >2000 counts | High rate bins dominated by noise | Noise dominated (total time) | Noise dominated (detector-on time) | Marked lightcurve |
|---|---|---|---|---|---|---|---|
| A | 7759 | 7505 | 0 | 0 | 0.00% | 0.00% | 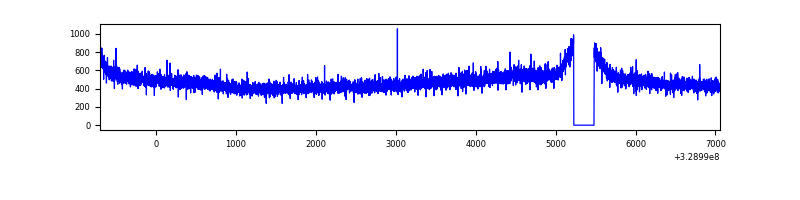 |
| B | 7759 | 7505 | 0 | 0 | 0.00% | 0.00% | 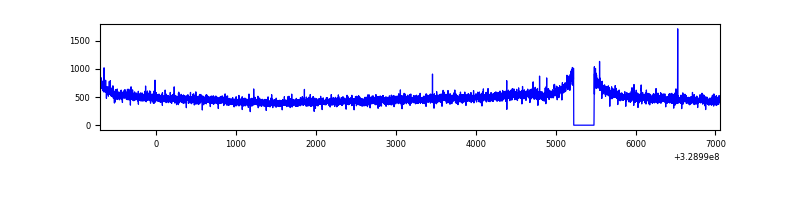 |
| C | 7759 | 7505 | 5 | 5 | 0.06% | 0.07% | 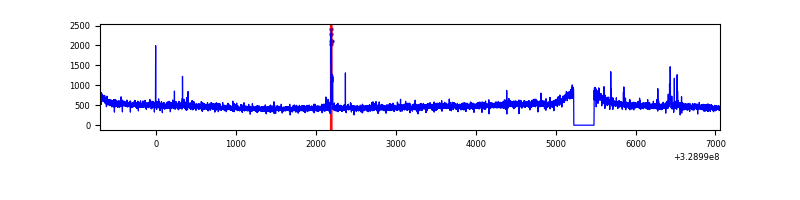 |
| D | 7760 | 7506 | 338 | 338 | 4.36% | 4.50% | 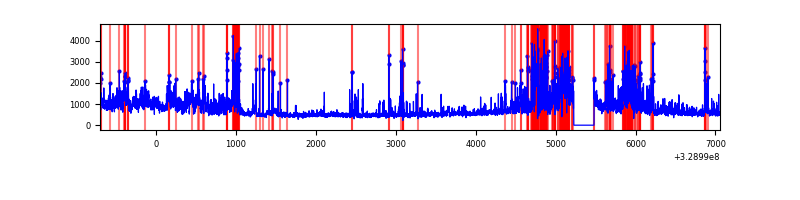 |
Top three noisy pixels from each quadrant. If the there are fewer than three noisy pixels in the level2.evt file, extra rows are filled as -1
| Pixel properties | Quadrant properties | ||||||
|---|---|---|---|---|---|---|---|
| Quadrant | DetID | PixID | Counts | Sigma | Mean | Median | Sigma |
| A | 13 | 254 | 11851 | 58.67 | 922 | 903 | 186.6 |
| A | 3 | 137 | 8618 | 41.34 | 922 | 903 | 186.6 |
| A | 0 | 226 | 7811 | 37.02 | 922 | 903 | 186.6 |
| B | 12 | 111 | 21067 | 114.99 | 913 | 889 | 175.5 |
| B | 11 | 111 | 18882 | 102.54 | 913 | 889 | 175.5 |
| B | 14 | 111 | 16696 | 90.08 | 913 | 889 | 175.5 |
| C | 14 | 238 | 141370 | 674.63 | 888 | 894 | 208.2 |
| C | 2 | 16 | 34516 | 161.47 | 888 | 894 | 208.2 |
| C | 9 | 54 | 27711 | 128.79 | 888 | 894 | 208.2 |
| D | 12 | 235 | 1242603 | 5805.83 | 877 | 851 | 213.9 |
| D | 1 | 52 | 910431 | 4252.75 | 877 | 851 | 213.9 |
| D | 8 | 195 | 481886 | 2249.09 | 877 | 851 | 213.9 |
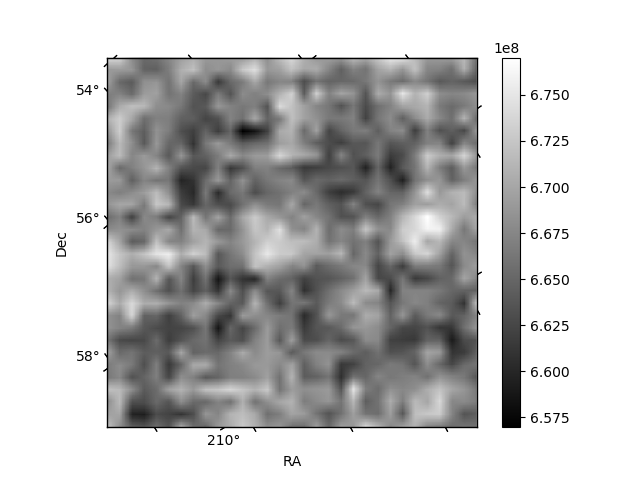
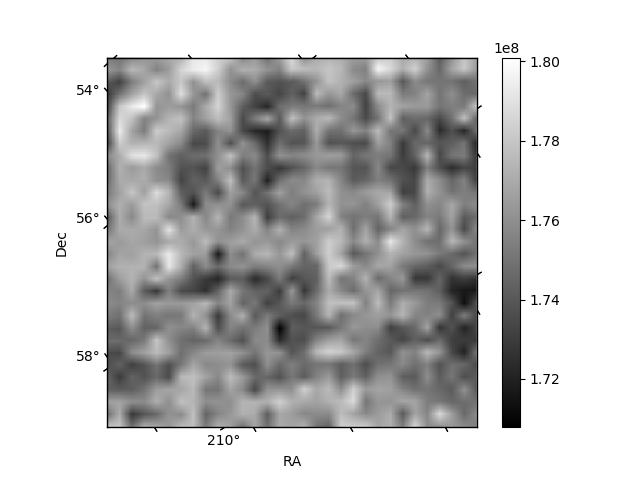
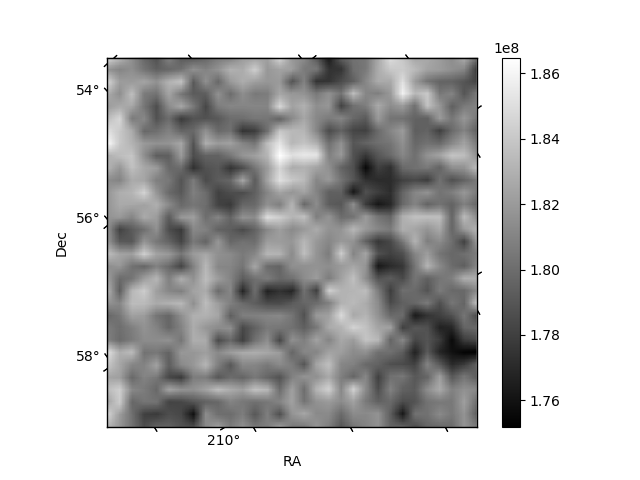
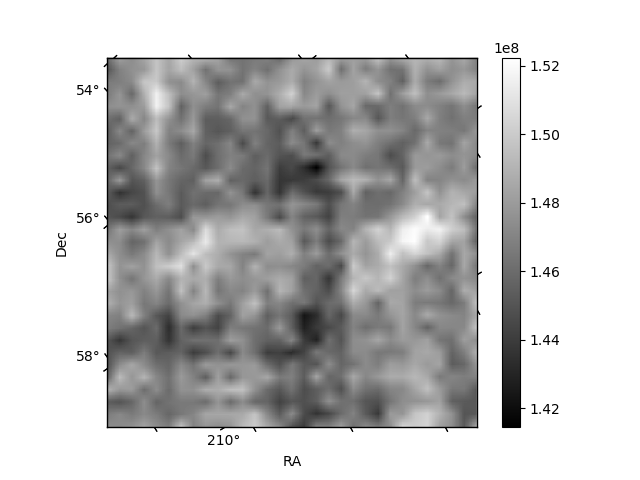
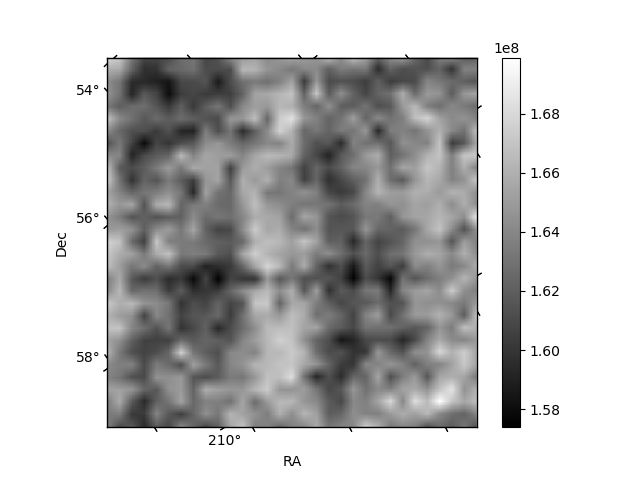
Histogram calculated using DETX and DETY for each event in the final _common_clean file
| Quadrant A | 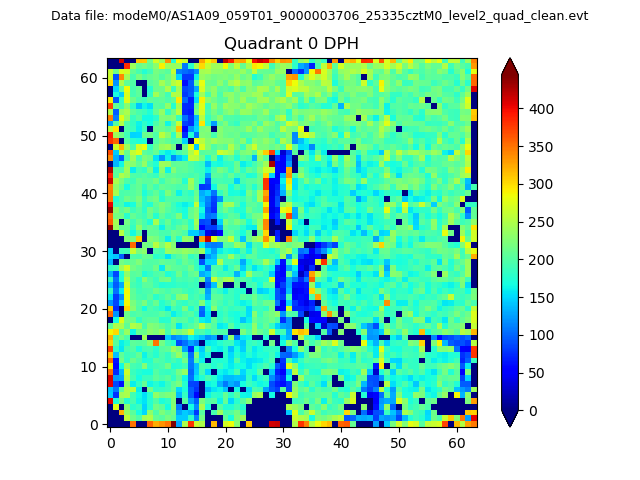 |
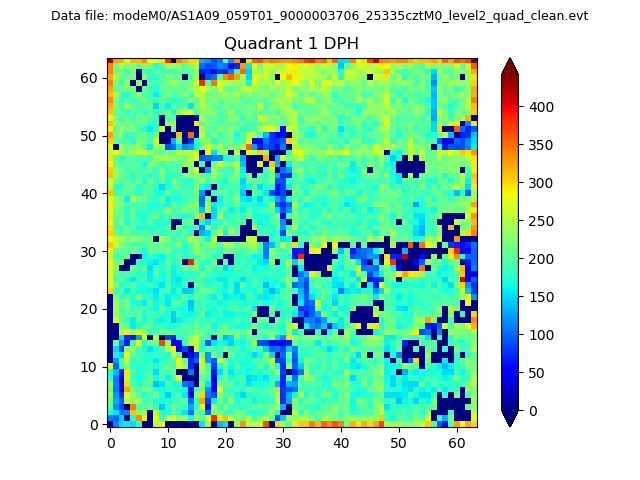 |
Quadrant B |
|---|---|---|---|
| Quadrant D | 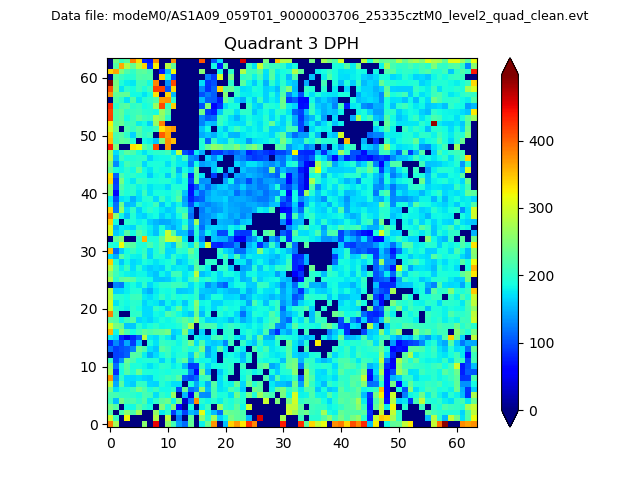 |
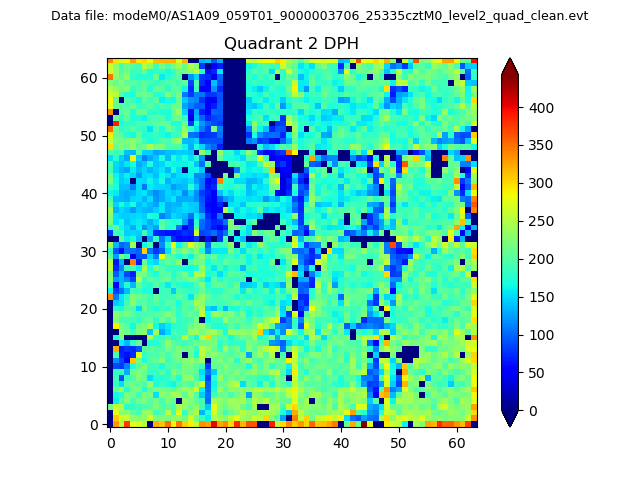 |
Quadrant C |
| Plot type | Count rate plots | Images |
|---|---|---|
| Comparison with Poisson distribution Blue bars denote a histogram of data divided into 1 sec bins. Red curve is a Poisson curve with rate = median count rate of data. |
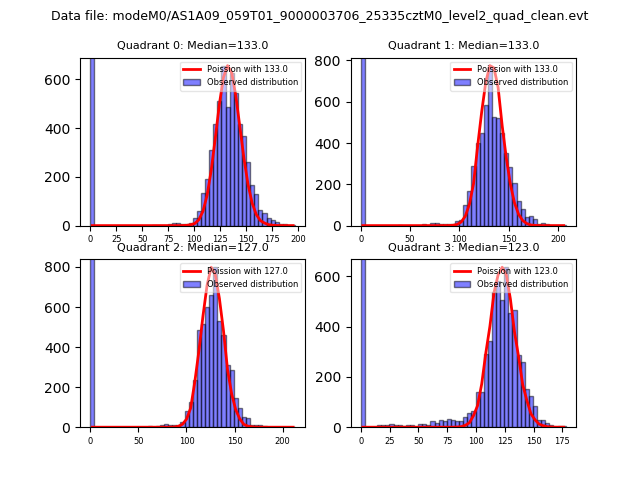 |
 |
| Quadrant-wise count rates Data is divided into 100 sec bins |
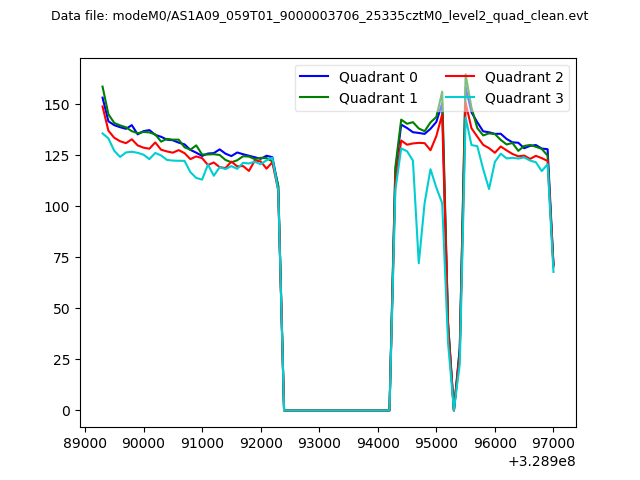 |
|
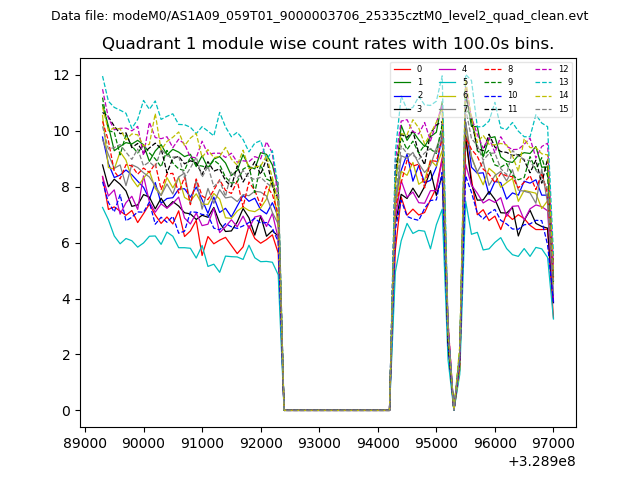
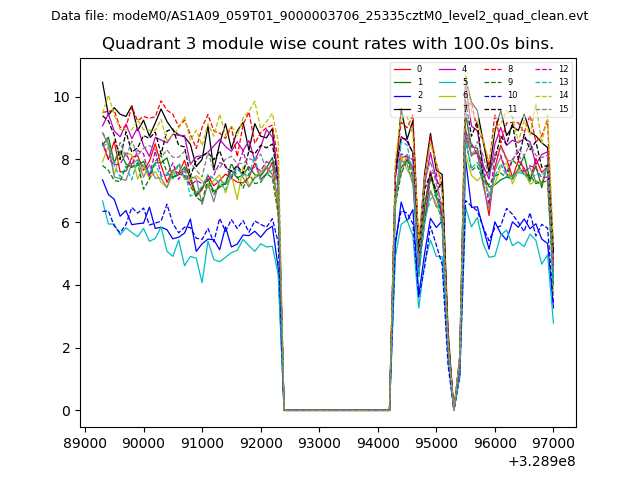
| Module-wise count rates for Quadrant A Data is divided into 100 sec bins |
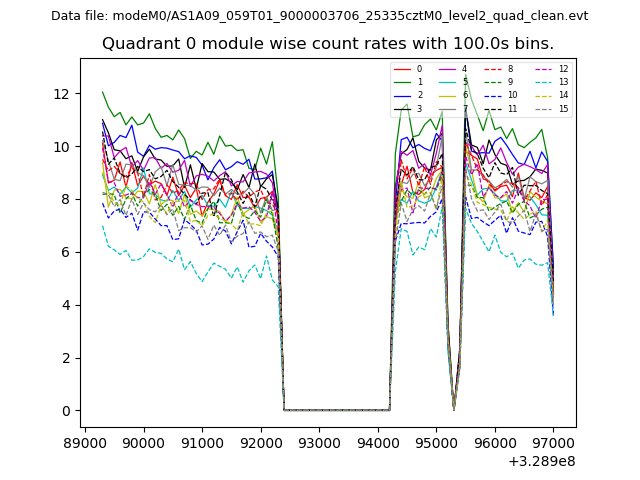 |
 |
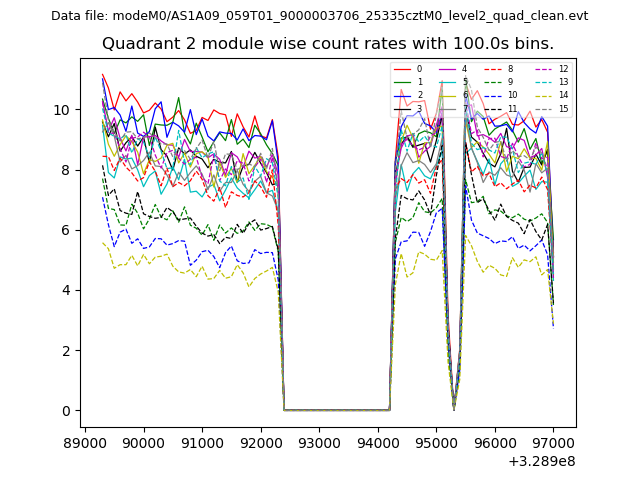
| Module-wise count rates for Quadrant B Data is divided into 100 sec bins |
 |
 |
| Module-wise count rates for Quadrant C Data is divided into 100 sec bins |
 |
 |
| Module-wise count rates for Quadrant D Data is divided into 100 sec bins |
 |
 |
| Parameter | Plot |
|---|---|
| CZT HV Monitor |  |
| D_VDD | 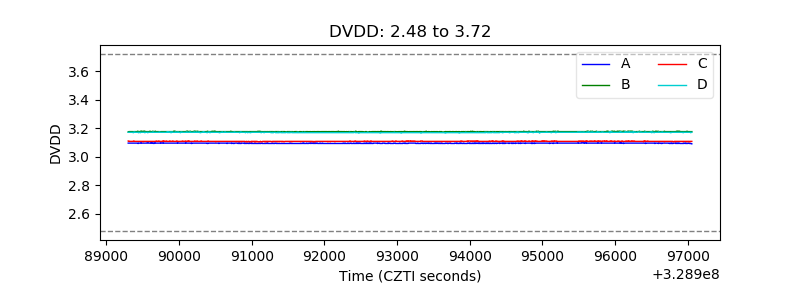 |
| Temperature 1 | 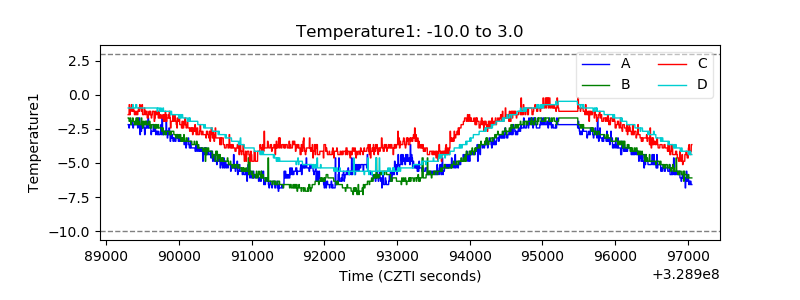 |
| Veto HV Monitor | 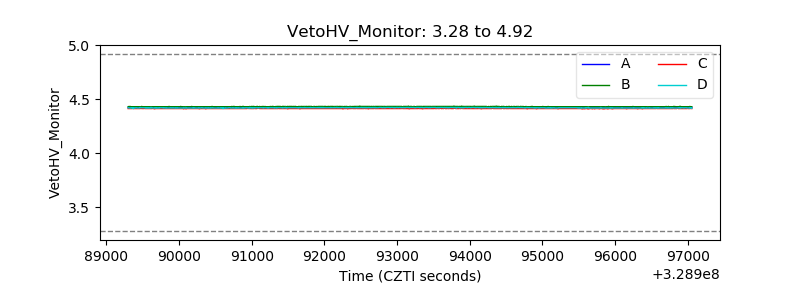 |
| Veto LLD | 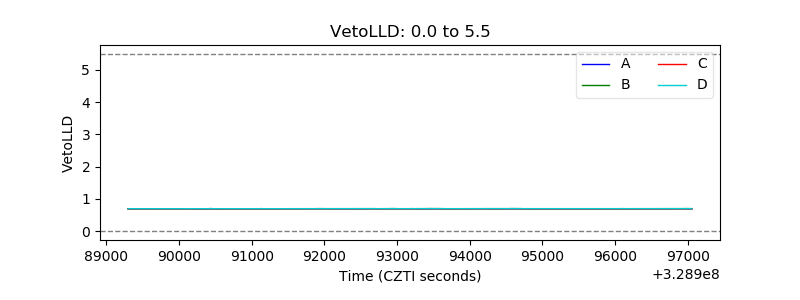 |
| Alpha Counter | 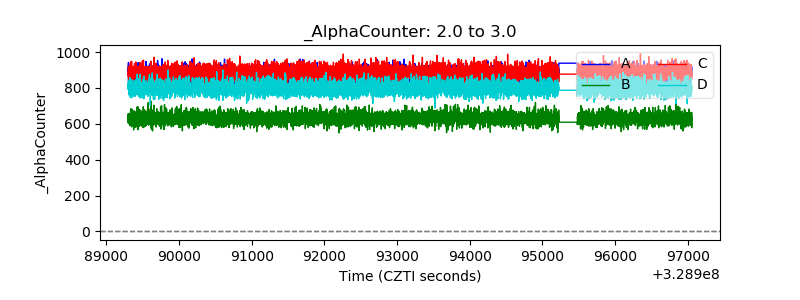 |
| _CPM_Rate | 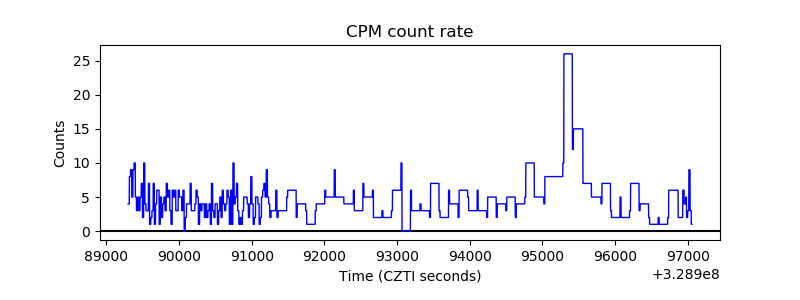 |
| CZT Counter |  |
| +2.5 Volts monitor |  |
| +5 Volts monitor |  |
| _ROLL_ROT | 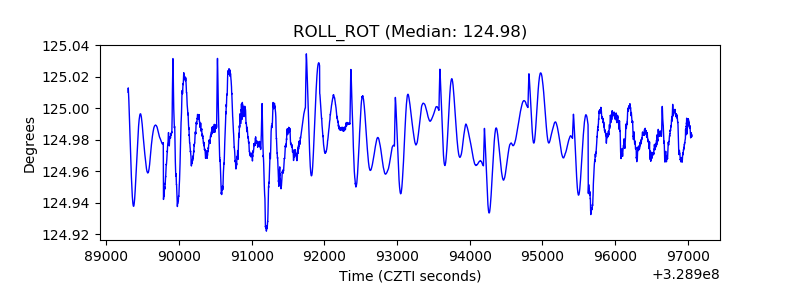 |
| _Roll_DEC |  |
| _Roll_RA | 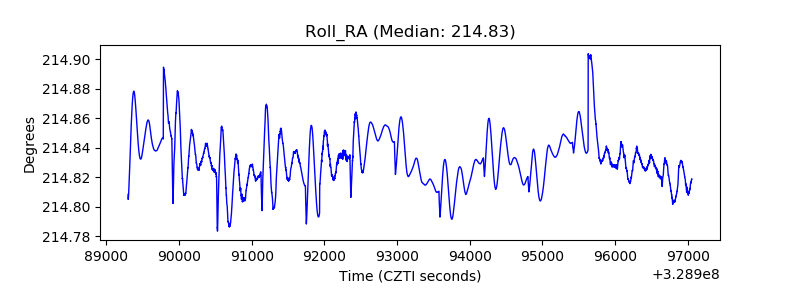 |
| Veto Counter |  |