| Param | Original file | Final file |
|---|---|---|
| Filename | modeM0/AS1A09_059T01_9000003706_25336cztM0_level2.evt | modeM0/AS1A09_059T01_9000003706_25336cztM0_level2_quad_clean.evt |
| Size (bytes) | 618,001,920 | 119,116,800 |
| Size | 589.4 MB | 113.6 MB |
| Events in quadrant A | 3,750,282 | 791,647 |
| Events in quadrant B | 3,818,357 | 792,437 |
| Events in quadrant C | 3,910,076 | 759,932 |
| Events in quadrant D | 6,703,013 | 714,902 |
| Mode M0 | |||
|---|---|---|---|
| Quadrant | BADHDUFLAG | Total packets | Discarded packets |
| A | 0 | 16503 | 0 |
| B | 0 | 16606 | 0 |
| C | 0 | 16881 | 0 |
| D | 0 | 25361 | 0 |
| Mode M9 | |||
|---|---|---|---|
| Quadrant | BADHDUFLAG | Total packets | Discarded packets |
| A | 0 | 6 | 0 |
| B | 0 | 6 | 0 |
| C | 0 | 6 | 0 |
| D | 0 | 6 | 0 |
| Quadrant | Total seconds | Saturated seconds | Saturation percentage |
|---|---|---|---|
| A | 7894 | 62 | 0.785407% |
| B | 7894 | 85 | 1.076767% |
| C | 7894 | 149 | 1.887510% |
| D | 7895 | 618 | 7.827739% |
Noise dominated data is calculated using 1-second bins in cleaned event files. If a bin has >2000 counts, and if more than 50% of those come from <1% of pixels, then it is considered to be noise-dominated and hence unusable.
| Quadrant | # 1 sec bins | Bins with >0 counts | Bins with >2000 counts | High rate bins dominated by noise | Noise dominated (total time) | Noise dominated (detector-on time) | Marked lightcurve |
|---|---|---|---|---|---|---|---|
| A | 8399 | 7896 | 0 | 0 | 0.00% | 0.00% | 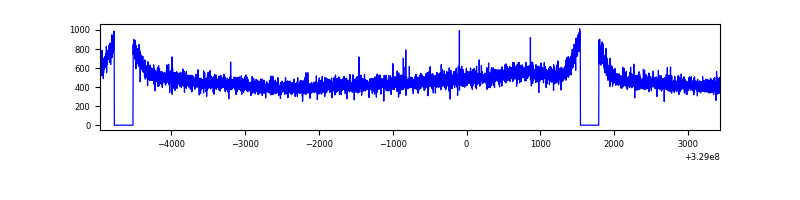 |
| B | 8399 | 7896 | 0 | 0 | 0.00% | 0.00% | 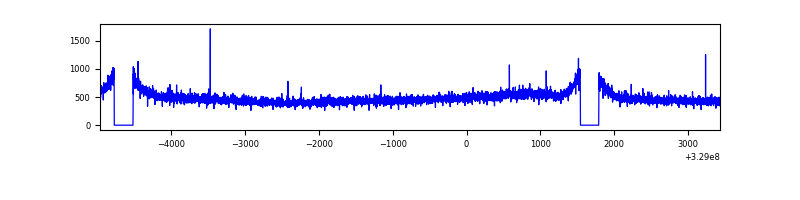 |
| C | 8399 | 7896 | 0 | 0 | 0.00% | 0.00% | 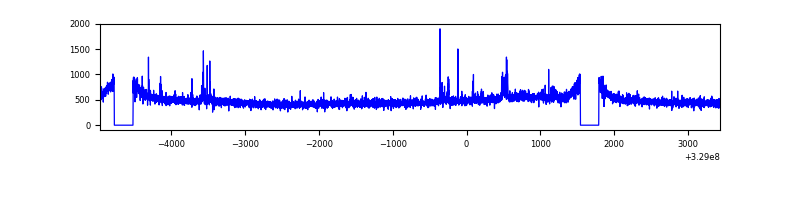 |
| D | 8400 | 7897 | 327 | 327 | 3.89% | 4.14% | 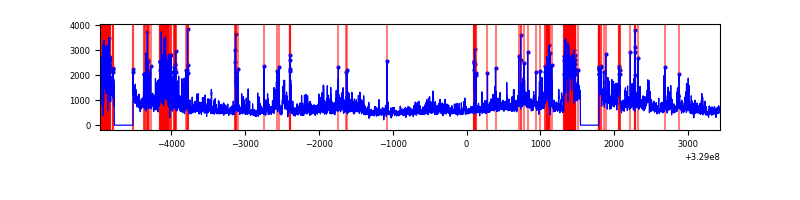 |
Top three noisy pixels from each quadrant. If the there are fewer than three noisy pixels in the level2.evt file, extra rows are filled as -1
| Pixel properties | Quadrant properties | ||||||
|---|---|---|---|---|---|---|---|
| Quadrant | DetID | PixID | Counts | Sigma | Mean | Median | Sigma |
| A | 13 | 254 | 11907 | 55.61 | 971 | 951 | 197.0 |
| A | 3 | 137 | 9076 | 41.24 | 971 | 951 | 197.0 |
| A | 0 | 226 | 8251 | 37.06 | 971 | 951 | 197.0 |
| B | 12 | 111 | 22795 | 117.24 | 965 | 938 | 186.4 |
| B | 11 | 111 | 20065 | 102.6 | 965 | 938 | 186.4 |
| B | 3 | 112 | 19363 | 98.83 | 965 | 938 | 186.4 |
| C | 14 | 238 | 147932 | 671.45 | 937 | 945 | 218.9 |
| C | 9 | 54 | 81585 | 368.37 | 937 | 945 | 218.9 |
| C | 2 | 16 | 21182 | 92.44 | 937 | 945 | 218.9 |
| D | 8 | 195 | 994279 | 4427.44 | 919 | 890 | 224.4 |
| D | 12 | 235 | 860479 | 3831.1 | 919 | 890 | 224.4 |
| D | 12 | 233 | 799497 | 3559.31 | 919 | 890 | 224.4 |
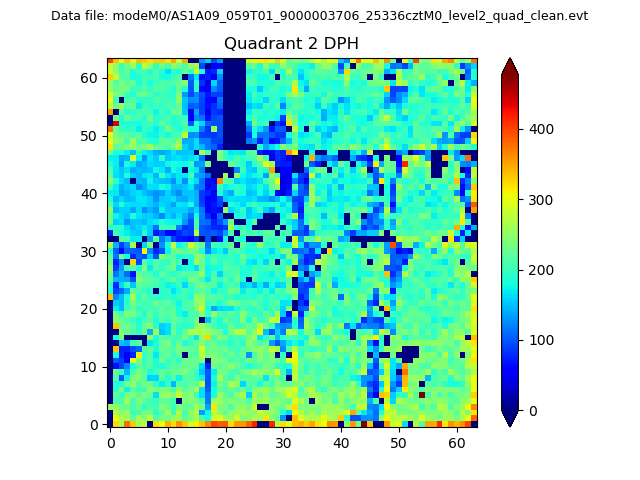
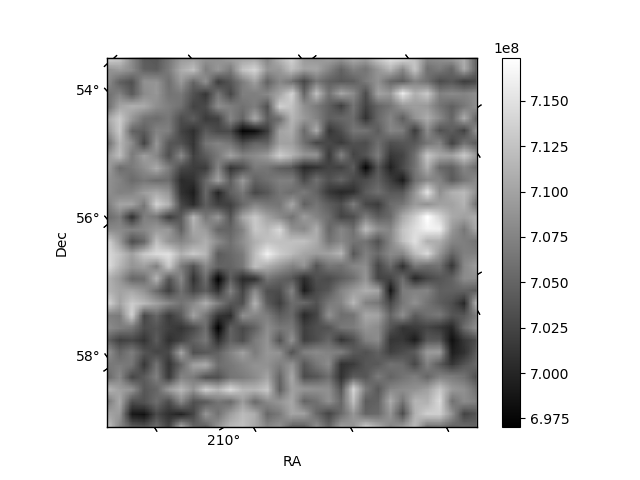
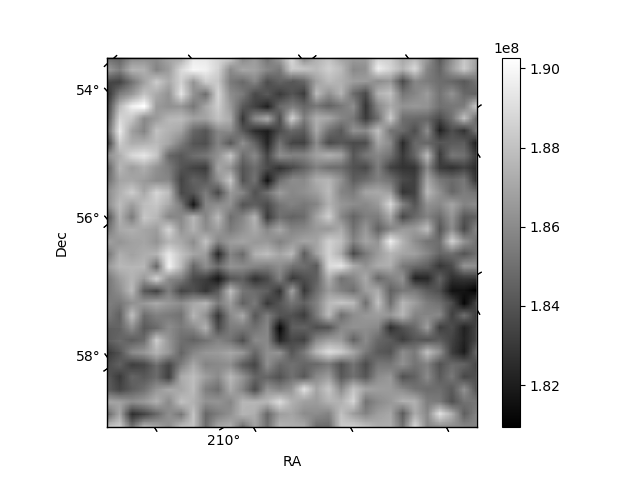
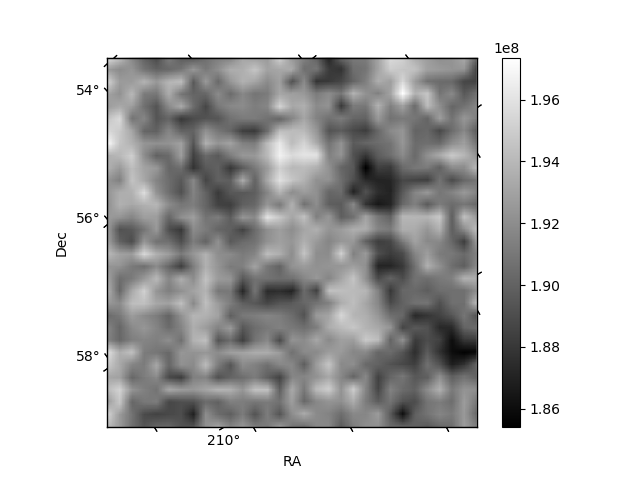
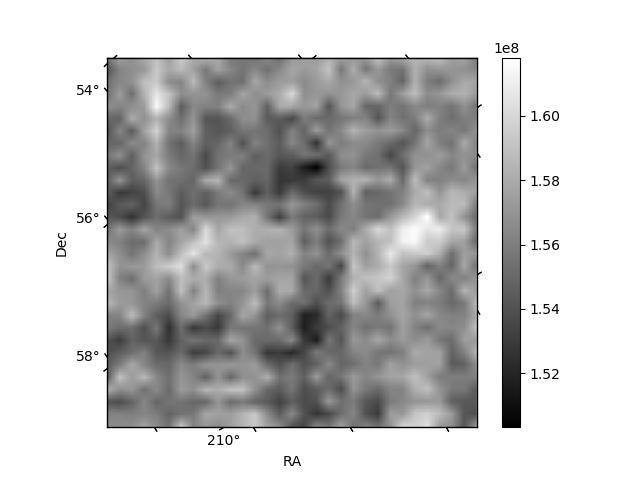
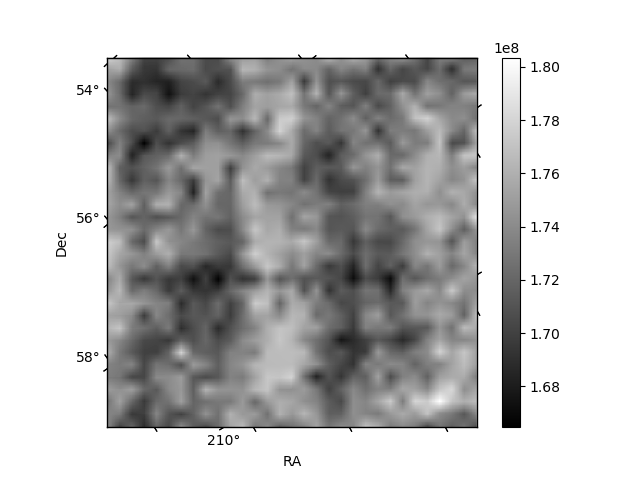
Histogram calculated using DETX and DETY for each event in the final _common_clean file
| Quadrant A | 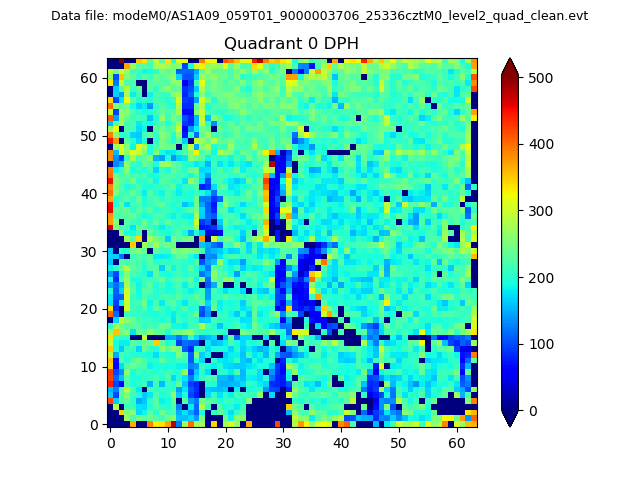 |
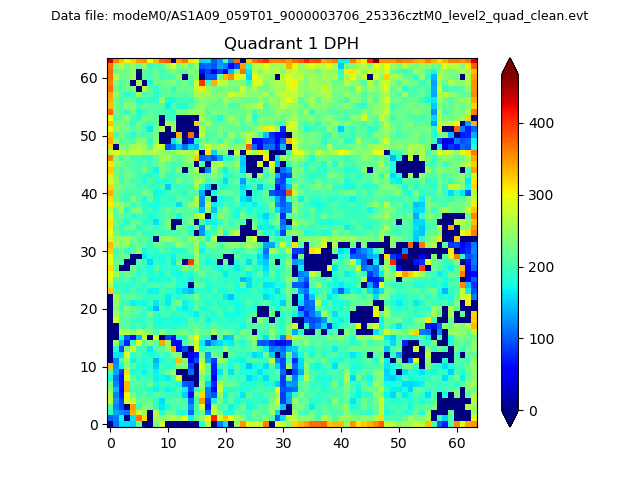 |
Quadrant B |
|---|---|---|---|
| Quadrant D | 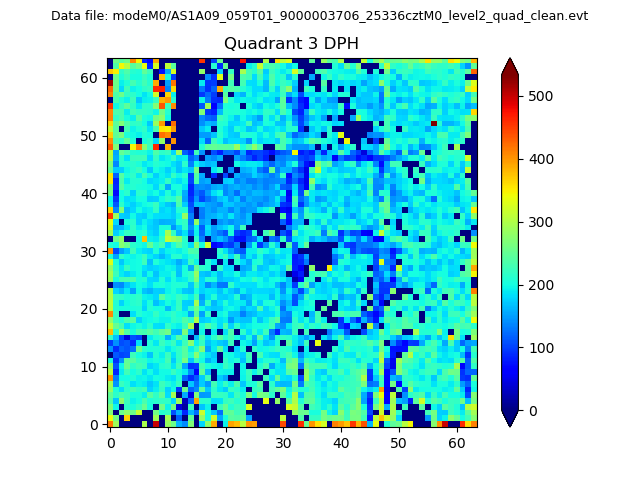 |
 |
Quadrant C |
| Plot type | Count rate plots | Images |
|---|---|---|
| Comparison with Poisson distribution Blue bars denote a histogram of data divided into 1 sec bins. Red curve is a Poisson curve with rate = median count rate of data. |
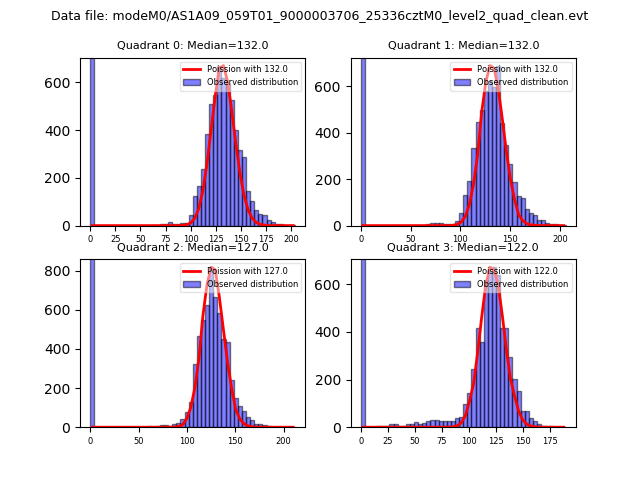 |
 |
| Quadrant-wise count rates Data is divided into 100 sec bins |
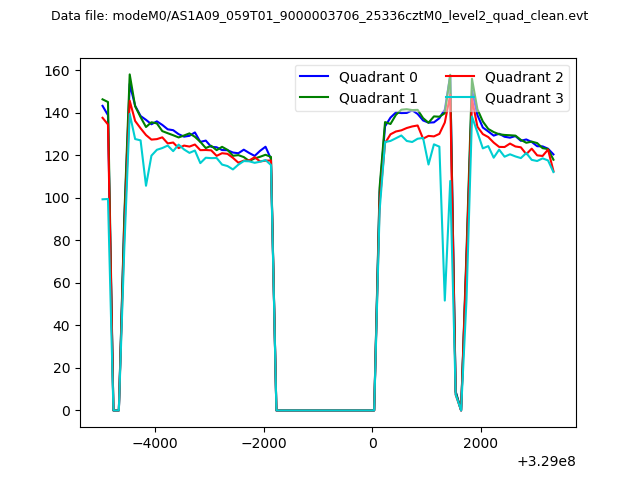 |
|
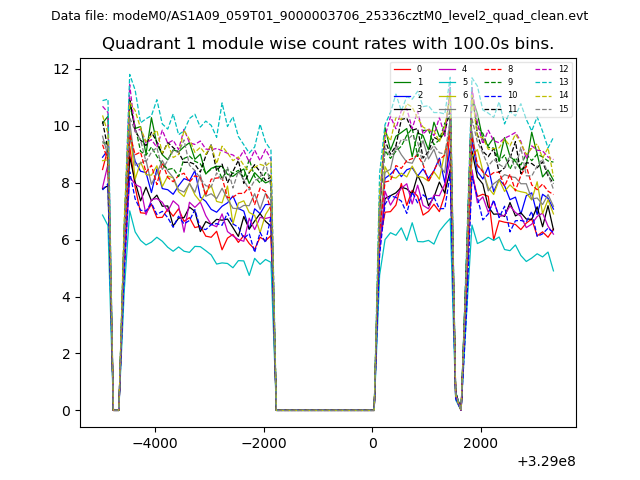
| Module-wise count rates for Quadrant A Data is divided into 100 sec bins |
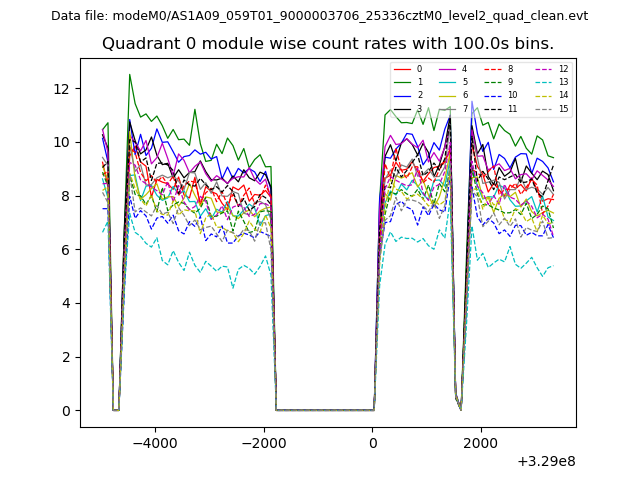 |
 |
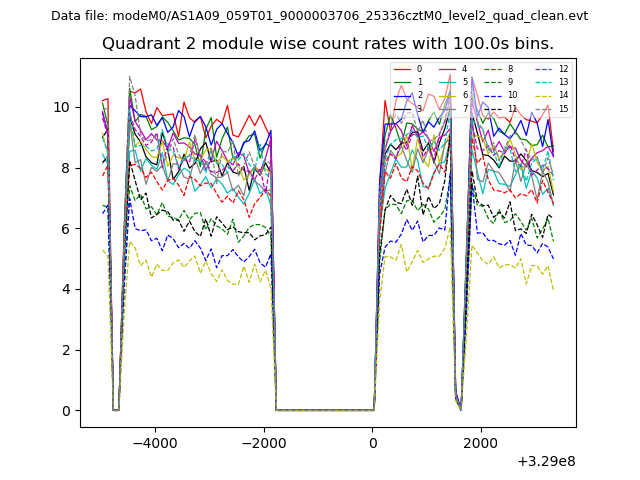
| Module-wise count rates for Quadrant B Data is divided into 100 sec bins |
 |
 |
| Module-wise count rates for Quadrant C Data is divided into 100 sec bins |
 |
 |
| Module-wise count rates for Quadrant D Data is divided into 100 sec bins |
 |
 |
| Parameter | Plot |
|---|---|
| CZT HV Monitor |  |
| D_VDD | 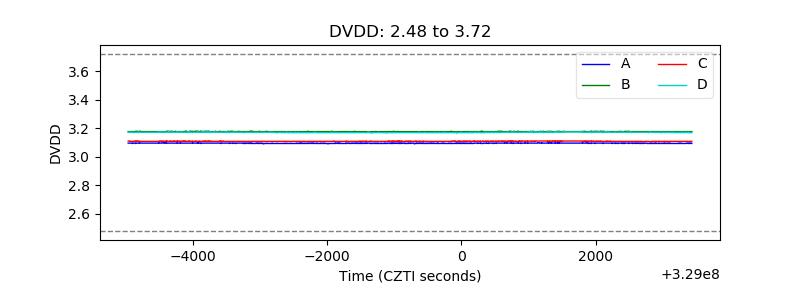 |
| Temperature 1 | 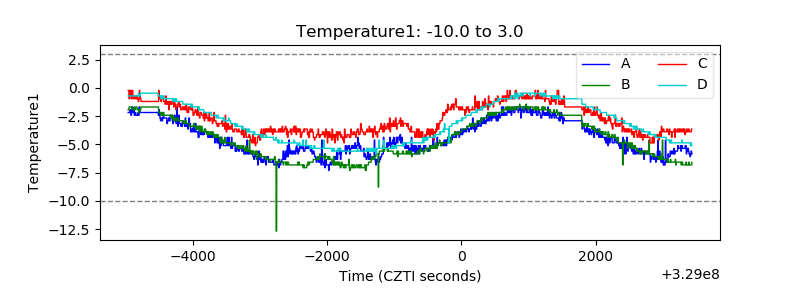 |
| Veto HV Monitor | 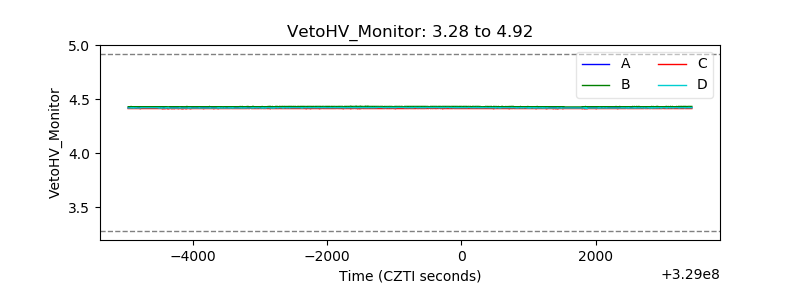 |
| Veto LLD | 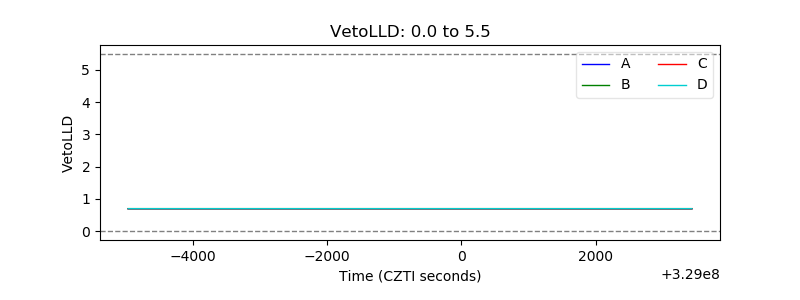 |
| Alpha Counter | 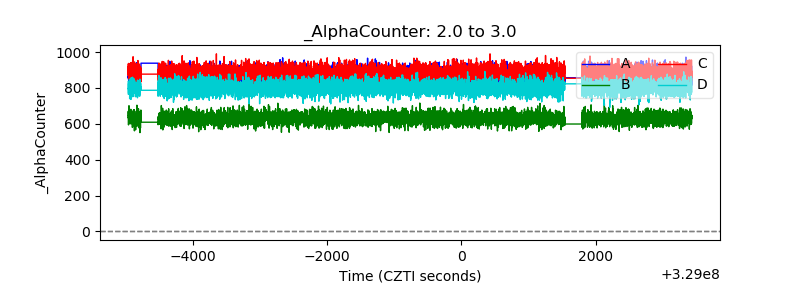 |
| _CPM_Rate | 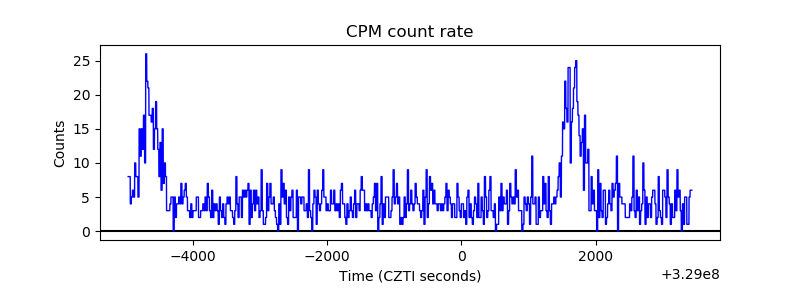 |
| CZT Counter | 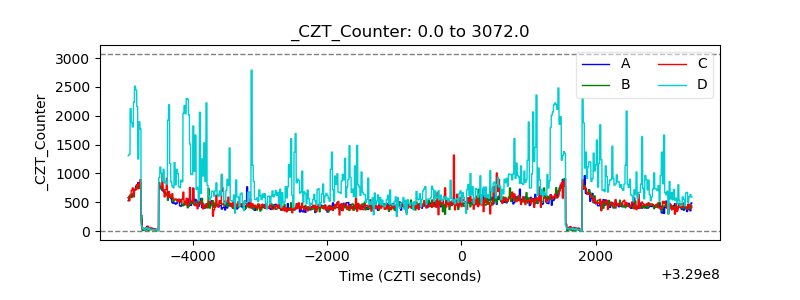 |
| +2.5 Volts monitor |  |
| +5 Volts monitor |  |
| _ROLL_ROT |  |
| _Roll_DEC | 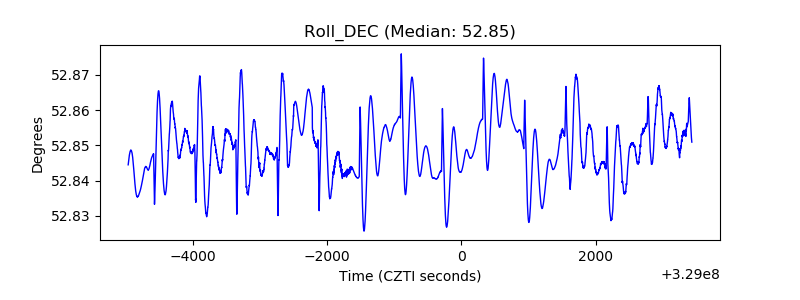 |
| _Roll_RA | 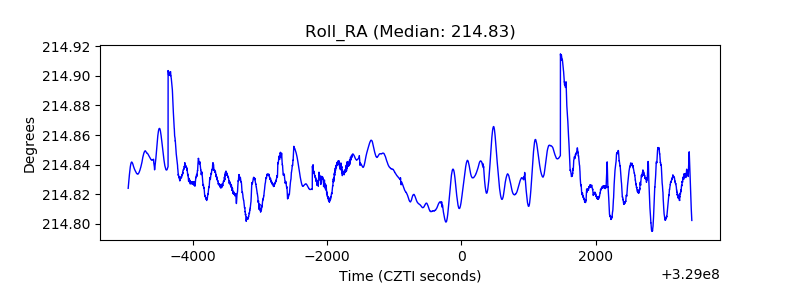 |
| Veto Counter | 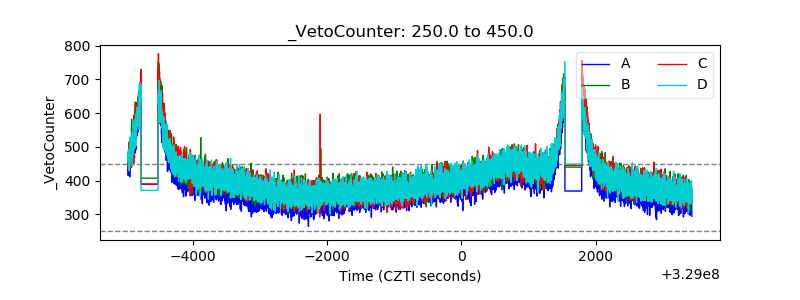 |