| Param | Original file | Final file |
|---|---|---|
| Filename | modeM0/AS1A09_059T01_9000003706_25339cztM0_level2.evt | modeM0/AS1A09_059T01_9000003706_25339cztM0_level2_quad_clean.evt |
| Size (bytes) | 1,417,991,040 | 247,996,800 |
| Size | 1.3 GB | 236.5 MB |
| Events in quadrant A | 8,707,950 | 1,595,732 |
| Events in quadrant B | 8,853,737 | 1,620,376 |
| Events in quadrant C | 9,655,149 | 1,540,352 |
| Events in quadrant D | 14,470,383 | 1,472,076 |
| Mode M0 | |||
|---|---|---|---|
| Quadrant | BADHDUFLAG | Total packets | Discarded packets |
| A | 0 | 38217 | 0 |
| B | 0 | 38609 | 0 |
| C | 0 | 40956 | 0 |
| D | 0 | 55530 | 0 |
| Mode M9 | |||
|---|---|---|---|
| Quadrant | BADHDUFLAG | Total packets | Discarded packets |
| A | 0 | 21 | 0 |
| B | 0 | 21 | 0 |
| C | 0 | 21 | 0 |
| D | 0 | 21 | 0 |
| Quadrant | Total seconds | Saturated seconds | Saturation percentage |
|---|---|---|---|
| A | 18613 | 138 | 0.741417% |
| B | 18614 | 135 | 0.725261% |
| C | 18614 | 438 | 2.353068% |
| D | 18614 | 1151 | 6.183518% |
Noise dominated data is calculated using 1-second bins in cleaned event files. If a bin has >2000 counts, and if more than 50% of those come from <1% of pixels, then it is considered to be noise-dominated and hence unusable.
| Quadrant | # 1 sec bins | Bins with >0 counts | Bins with >2000 counts | High rate bins dominated by noise | Noise dominated (total time) | Noise dominated (detector-on time) | Marked lightcurve |
|---|---|---|---|---|---|---|---|
| A | 20713 | 18617 | 14 | 14 | 0.07% | 0.08% | 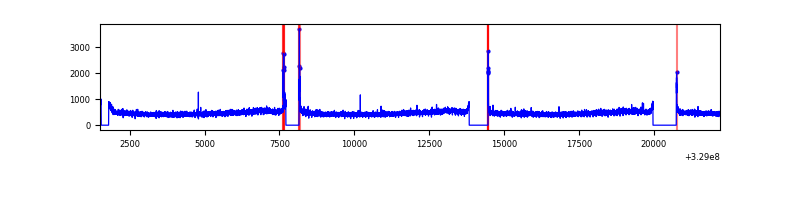 |
| B | 20714 | 18618 | 0 | 0 | 0.00% | 0.00% | 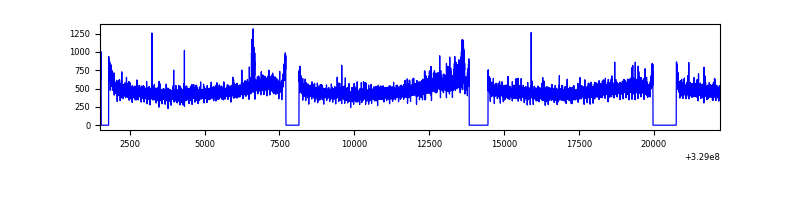 |
| C | 20714 | 18618 | 160 | 160 | 0.77% | 0.86% | 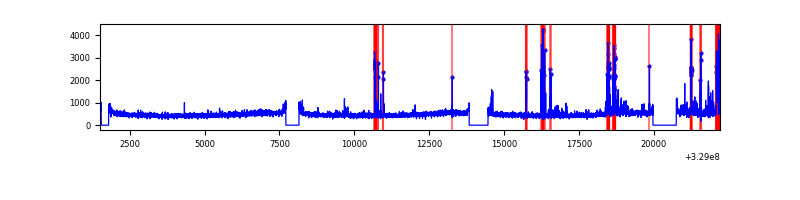 |
| D | 20714 | 18618 | 803 | 803 | 3.88% | 4.31% | 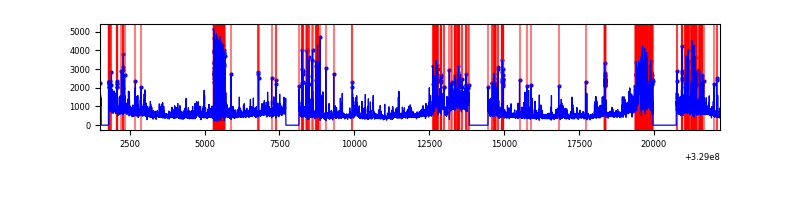 |
Top three noisy pixels from each quadrant. If the there are fewer than three noisy pixels in the level2.evt file, extra rows are filled as -1
| Pixel properties | Quadrant properties | ||||||
|---|---|---|---|---|---|---|---|
| Quadrant | DetID | PixID | Counts | Sigma | Mean | Median | Sigma |
| A | 8 | 192 | 136547 | 302.8 | 2221 | 2173 | 443.8 |
| A | 13 | 254 | 27264 | 56.54 | 2221 | 2173 | 443.8 |
| A | 3 | 137 | 20675 | 41.69 | 2221 | 2173 | 443.8 |
| B | 0 | 190 | 110755 | 257.7 | 2213 | 2154 | 421.4 |
| B | 3 | 112 | 57358 | 130.99 | 2213 | 2154 | 421.4 |
| B | 12 | 111 | 52931 | 120.49 | 2213 | 2154 | 421.4 |
| C | 7 | 87 | 510067 | 1015.61 | 2136 | 2148 | 500.1 |
| C | 14 | 238 | 339371 | 674.29 | 2136 | 2148 | 500.1 |
| C | 3 | 233 | 260105 | 515.8 | 2136 | 2148 | 500.1 |
| D | 1 | 52 | 2839746 | 5560.15 | 2118 | 2053 | 510.4 |
| D | 8 | 195 | 1665627 | 3259.59 | 2118 | 2053 | 510.4 |
| D | 12 | 235 | 1524591 | 2983.25 | 2118 | 2053 | 510.4 |
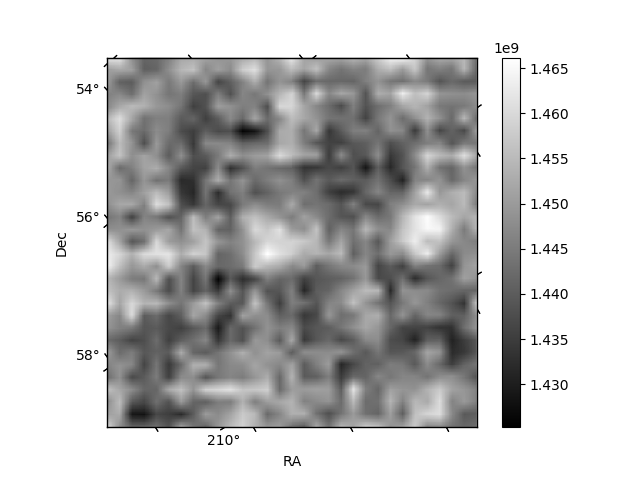
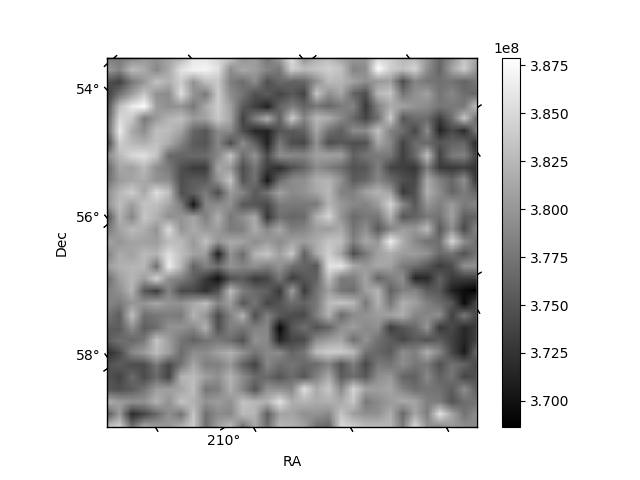
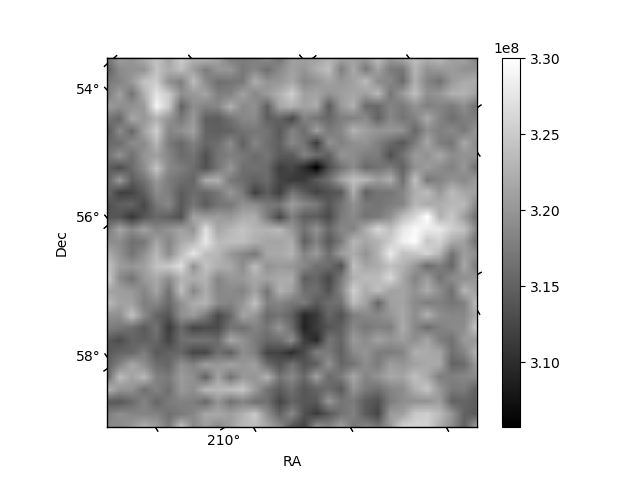
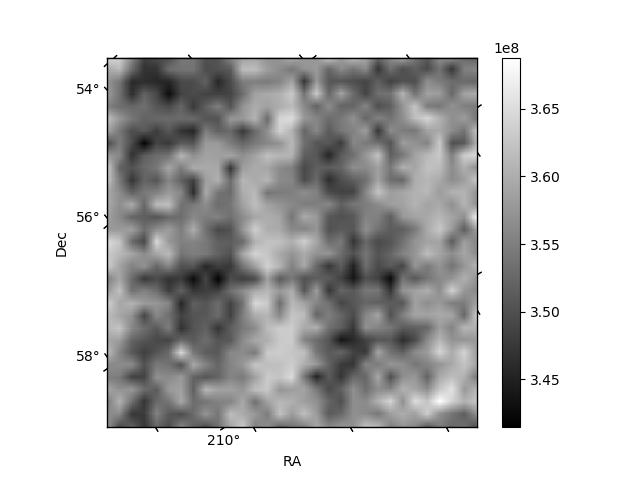
Histogram calculated using DETX and DETY for each event in the final _common_clean file
| Quadrant A | 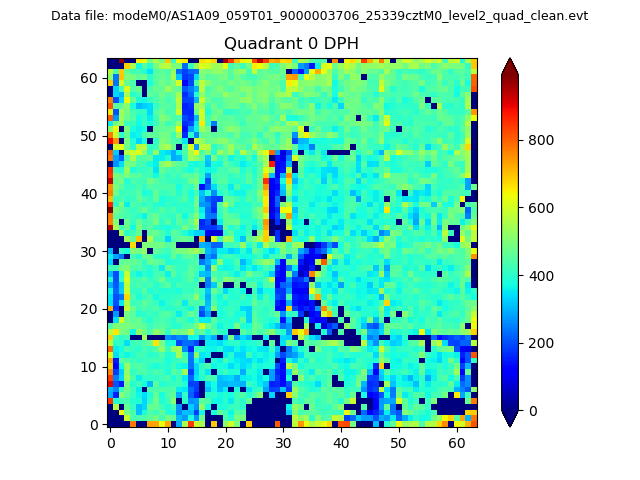 |
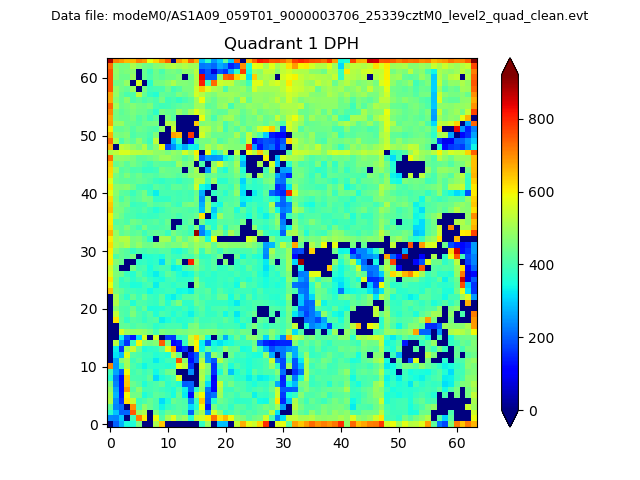 |
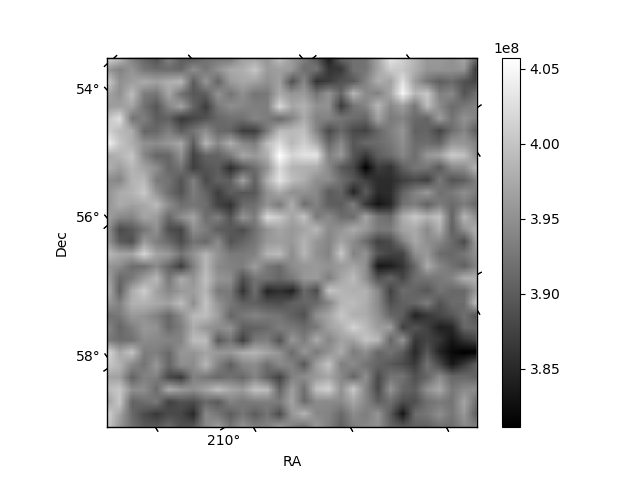
Quadrant B |
|---|---|---|---|
| Quadrant D | 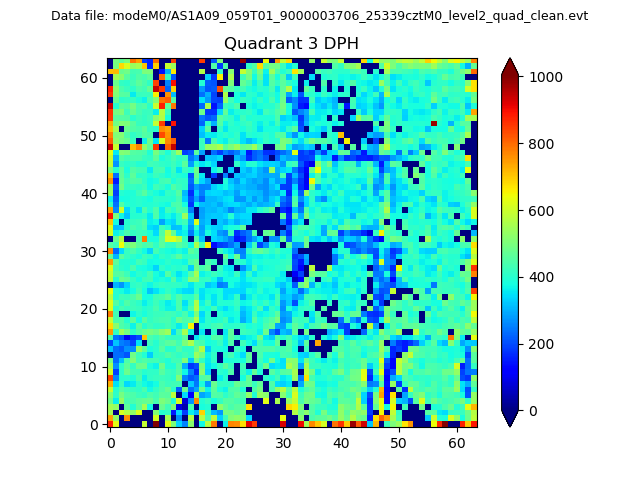 |
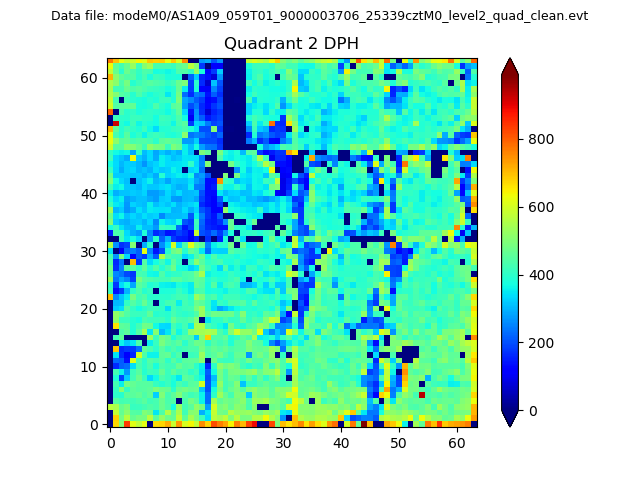 |
Quadrant C |
| Plot type | Count rate plots | Images |
|---|---|---|
| Comparison with Poisson distribution Blue bars denote a histogram of data divided into 1 sec bins. Red curve is a Poisson curve with rate = median count rate of data. |
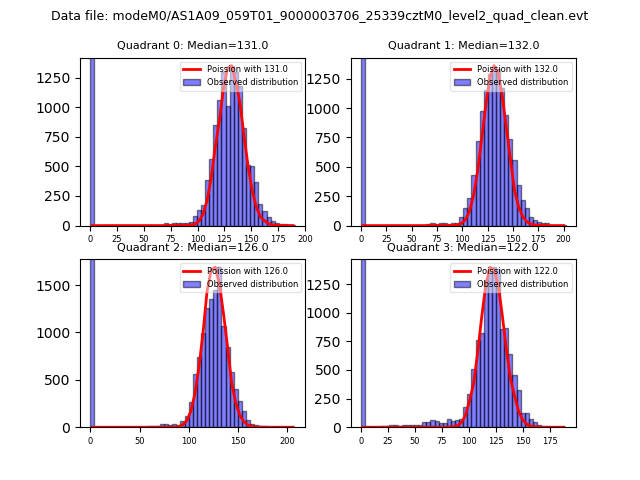 |
 |
| Quadrant-wise count rates Data is divided into 100 sec bins |
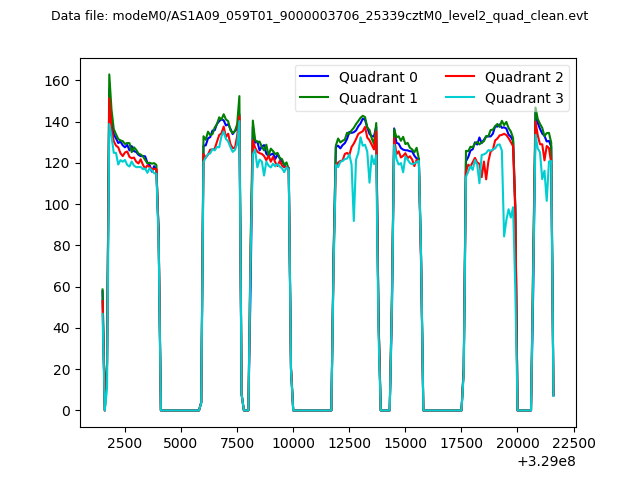 |
|
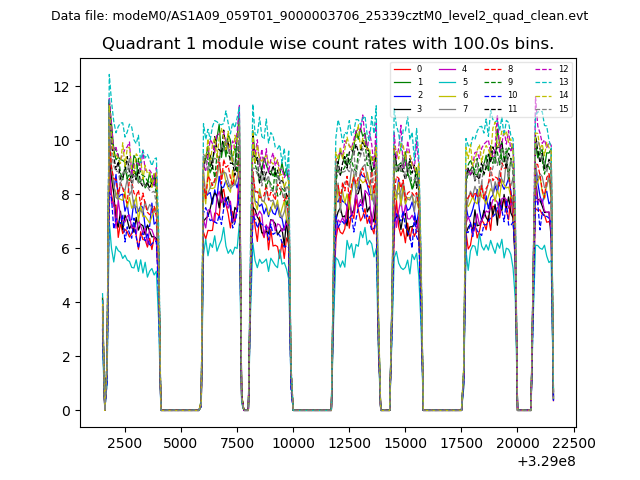
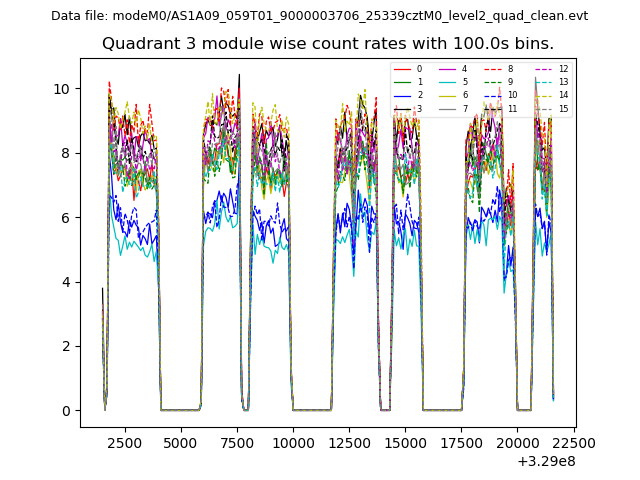
| Module-wise count rates for Quadrant A Data is divided into 100 sec bins |
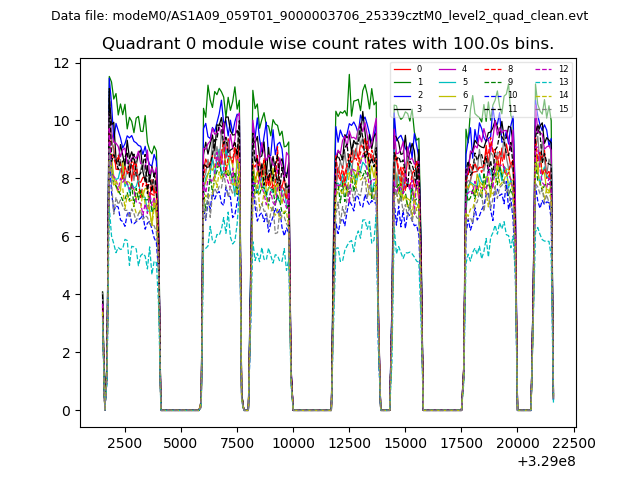 |
 |
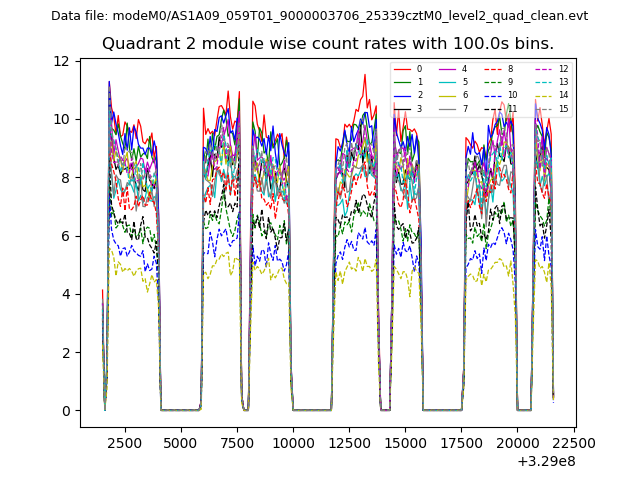
| Module-wise count rates for Quadrant B Data is divided into 100 sec bins |
 |
 |
| Module-wise count rates for Quadrant C Data is divided into 100 sec bins |
 |
 |
| Module-wise count rates for Quadrant D Data is divided into 100 sec bins |
 |
 |
| Parameter | Plot |
|---|---|
| CZT HV Monitor | 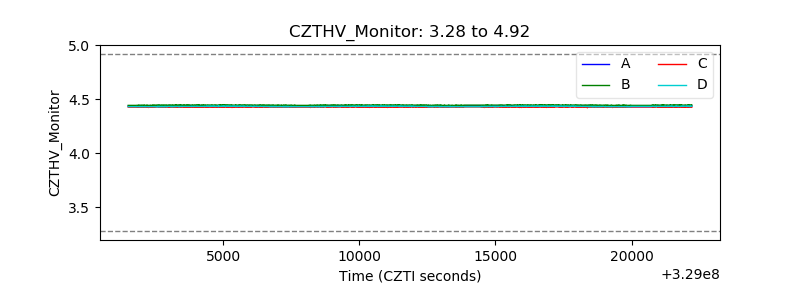 |
| D_VDD | 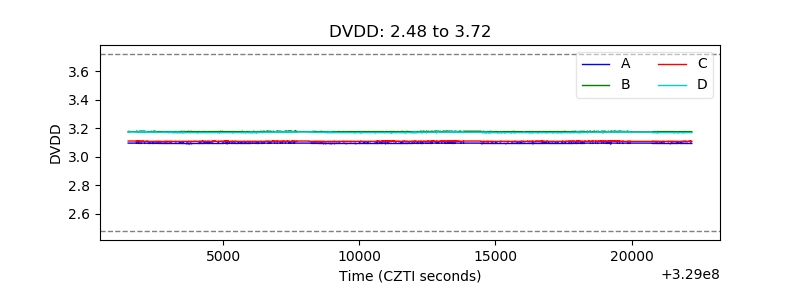 |
| Temperature 1 | 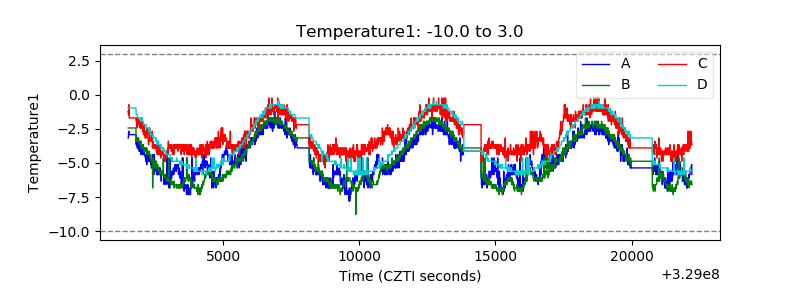 |
| Veto HV Monitor |  |
| Veto LLD | 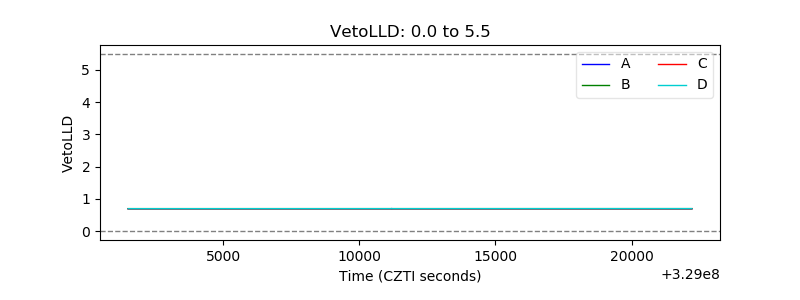 |
| Alpha Counter | 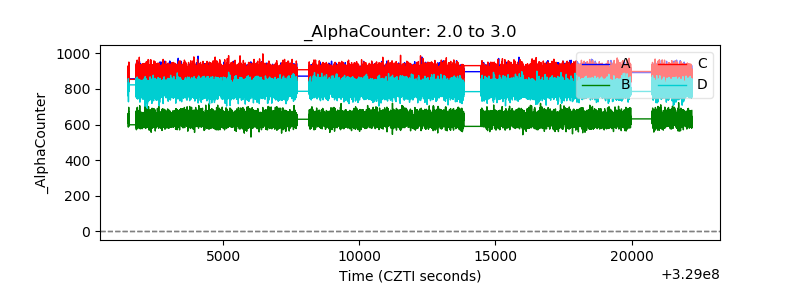 |
| _CPM_Rate | 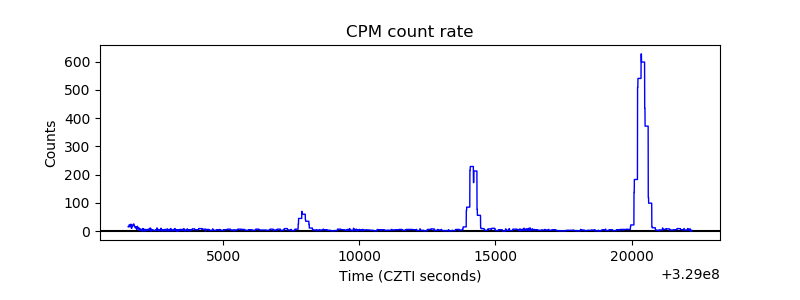 |
| CZT Counter | 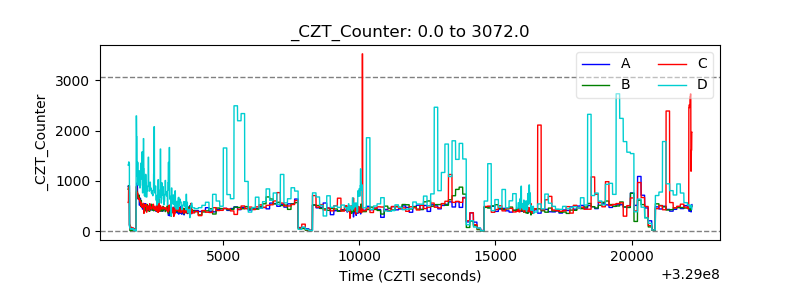 |
| +2.5 Volts monitor |  |
| +5 Volts monitor | 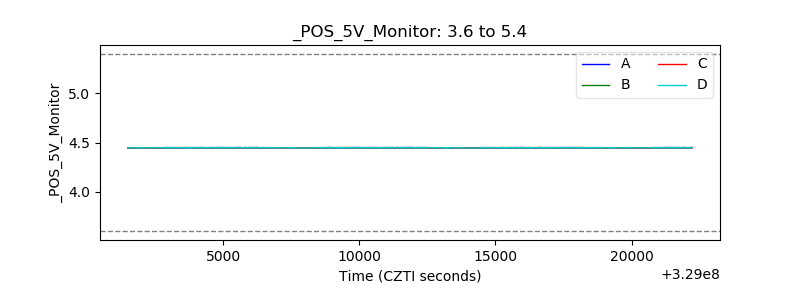 |
| _ROLL_ROT | 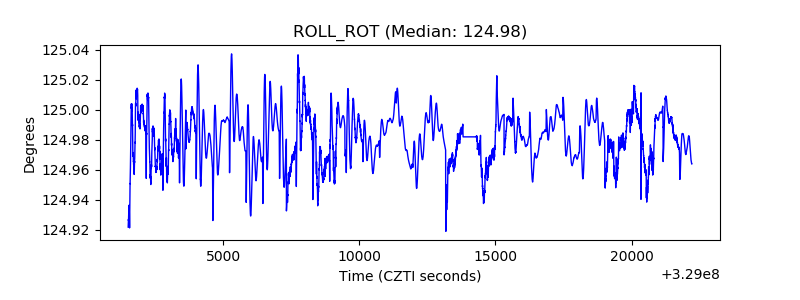 |
| _Roll_DEC | 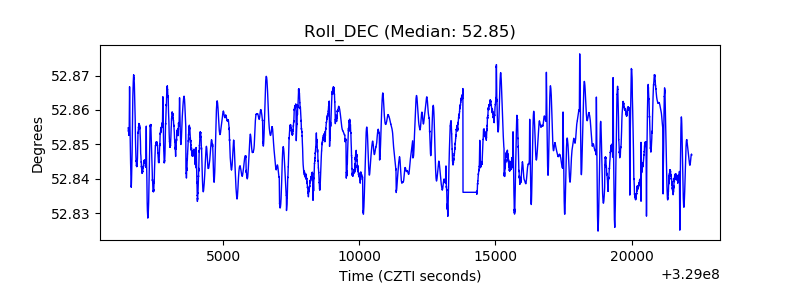 |
| _Roll_RA | 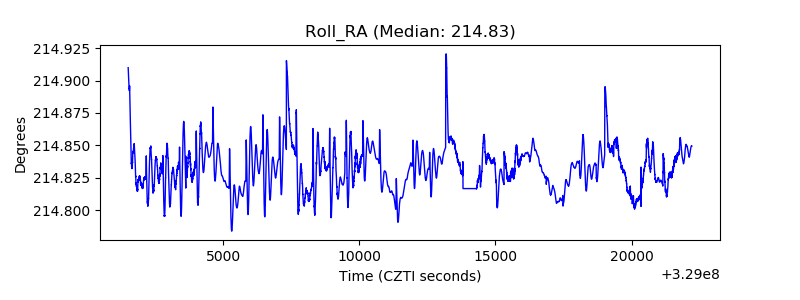 |
| Veto Counter | 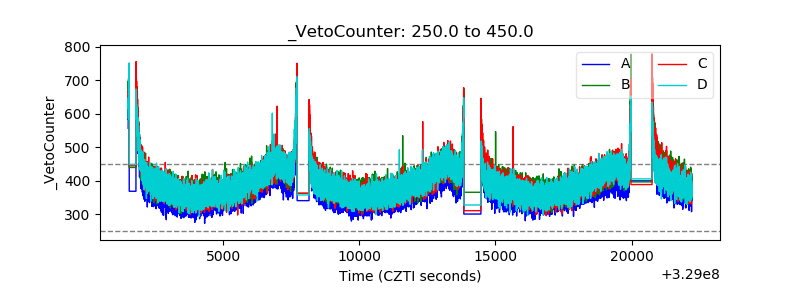 |