| Param | Original file | Final file |
|---|---|---|
| Filename | modeM0/AS1A09_059T01_9000003706_25340cztM0_level2.evt | modeM0/AS1A09_059T01_9000003706_25340cztM0_level2_quad_clean.evt |
| Size (bytes) | 539,778,240 | 80,112,960 |
| Size | 514.8 MB | 76.4 MB |
| Events in quadrant A | 3,228,771 | 507,646 |
| Events in quadrant B | 3,233,584 | 514,234 |
| Events in quadrant C | 3,642,039 | 486,182 |
| Events in quadrant D | 5,788,010 | 450,153 |
| Mode M0 | |||
|---|---|---|---|
| Quadrant | BADHDUFLAG | Total packets | Discarded packets |
| A | 0 | 13776 | 0 |
| B | 0 | 13775 | 0 |
| C | 0 | 14984 | 0 |
| D | 0 | 22062 | 0 |
| Mode M9 | |||
|---|---|---|---|
| Quadrant | BADHDUFLAG | Total packets | Discarded packets |
| A | 0 | 10 | 0 |
| B | 0 | 11 | 0 |
| C | 0 | 11 | 0 |
| D | 0 | 11 | 0 |
| Quadrant | Total seconds | Saturated seconds | Saturation percentage |
|---|---|---|---|
| A | 6707 | 60 | 0.894588% |
| B | 6707 | 34 | 0.506933% |
| C | 6707 | 162 | 2.415387% |
| D | 6707 | 494 | 7.365439% |
Noise dominated data is calculated using 1-second bins in cleaned event files. If a bin has >2000 counts, and if more than 50% of those come from <1% of pixels, then it is considered to be noise-dominated and hence unusable.
| Quadrant | # 1 sec bins | Bins with >0 counts | Bins with >2000 counts | High rate bins dominated by noise | Noise dominated (total time) | Noise dominated (detector-on time) | Marked lightcurve |
|---|---|---|---|---|---|---|---|
| A | 7707 | 6708 | 12 | 12 | 0.16% | 0.18% | 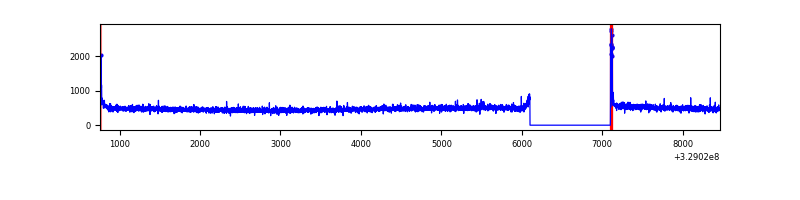 |
| B | 7707 | 6708 | 1 | 1 | 0.01% | 0.01% | 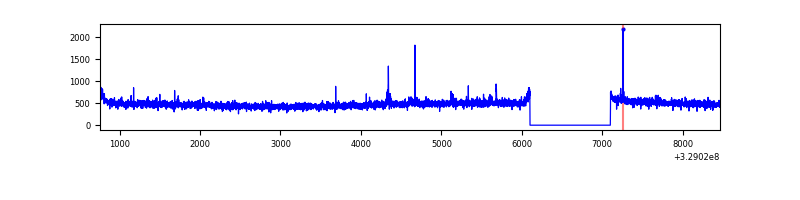 |
| C | 7707 | 6708 | 77 | 77 | 1.00% | 1.15% | 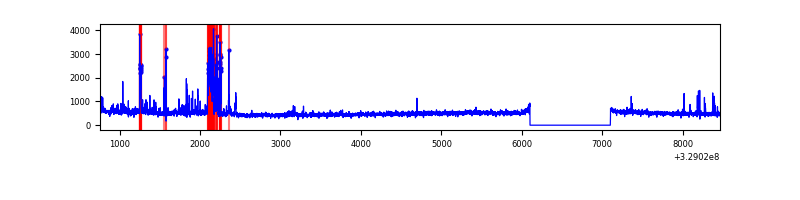 |
| D | 7707 | 6708 | 409 | 409 | 5.31% | 6.10% | 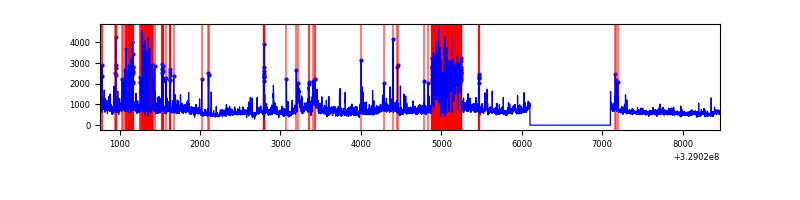 |
Top three noisy pixels from each quadrant. If the there are fewer than three noisy pixels in the level2.evt file, extra rows are filled as -1
| Pixel properties | Quadrant properties | ||||||
|---|---|---|---|---|---|---|---|
| Quadrant | DetID | PixID | Counts | Sigma | Mean | Median | Sigma |
| A | 8 | 192 | 81032 | 490.26 | 817 | 799 | 163.7 |
| A | 13 | 254 | 9835 | 55.21 | 817 | 799 | 163.7 |
| A | 3 | 137 | 7410 | 40.4 | 817 | 799 | 163.7 |
| B | 12 | 111 | 19515 | 120.29 | 814 | 793 | 155.6 |
| B | 3 | 112 | 18277 | 112.33 | 814 | 793 | 155.6 |
| B | 11 | 111 | 17297 | 106.04 | 814 | 793 | 155.6 |
| C | 7 | 87 | 330895 | 1811.57 | 778 | 784 | 182.2 |
| C | 14 | 238 | 123047 | 670.95 | 778 | 784 | 182.2 |
| C | 3 | 233 | 115107 | 627.38 | 778 | 784 | 182.2 |
| D | 1 | 52 | 1687255 | 9026.11 | 769 | 745 | 186.8 |
| D | 8 | 195 | 872024 | 4663.04 | 769 | 745 | 186.8 |
| D | 12 | 235 | 169580 | 903.6 | 769 | 745 | 186.8 |
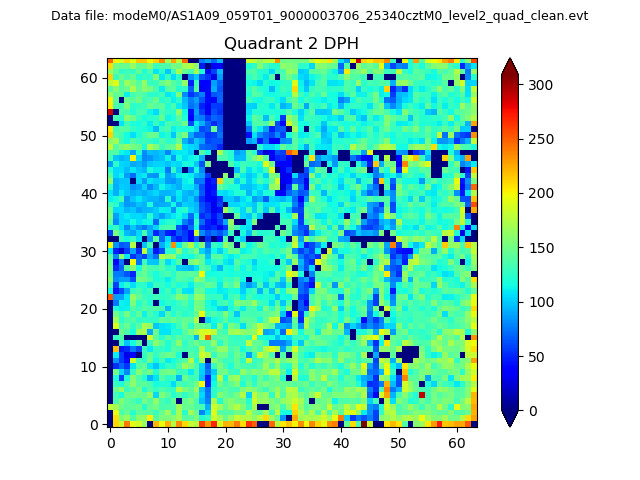
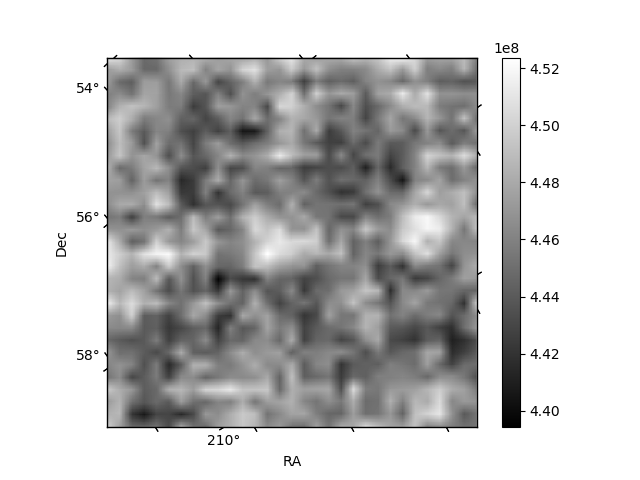
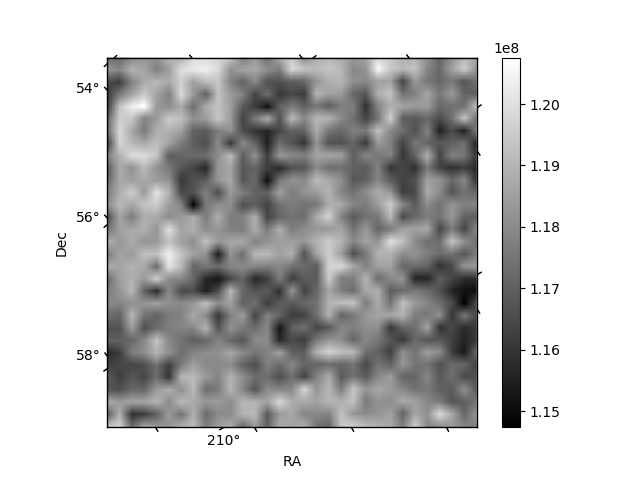
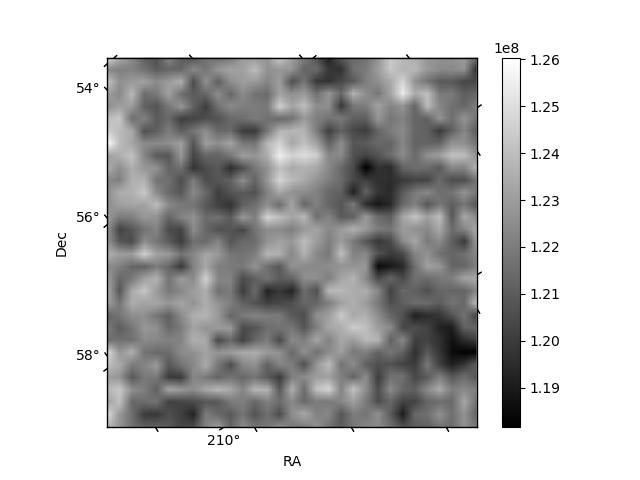
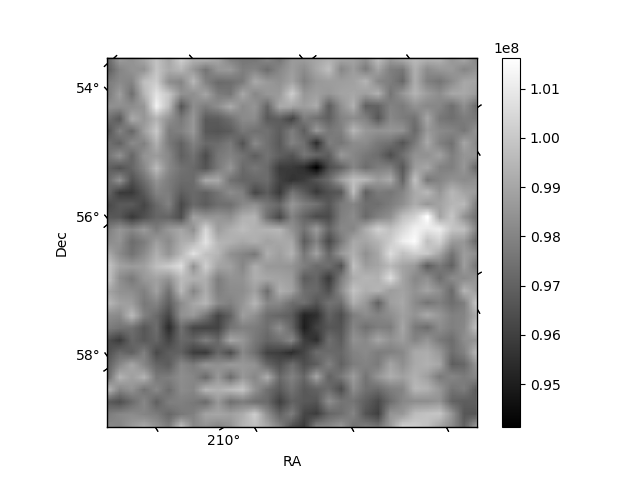
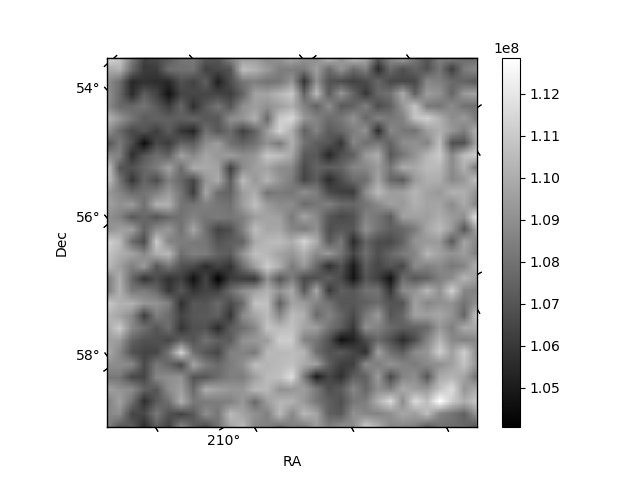
Histogram calculated using DETX and DETY for each event in the final _common_clean file
| Quadrant A | 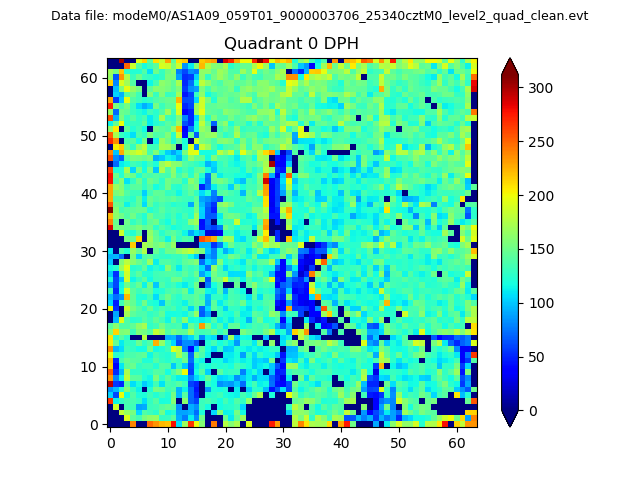 |
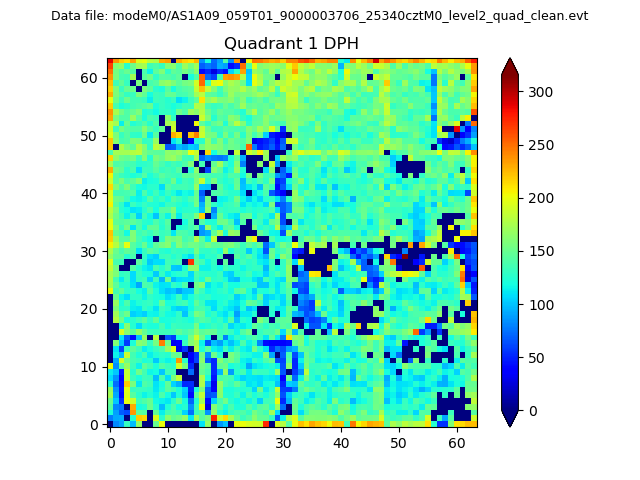 |
Quadrant B |
|---|---|---|---|
| Quadrant D | 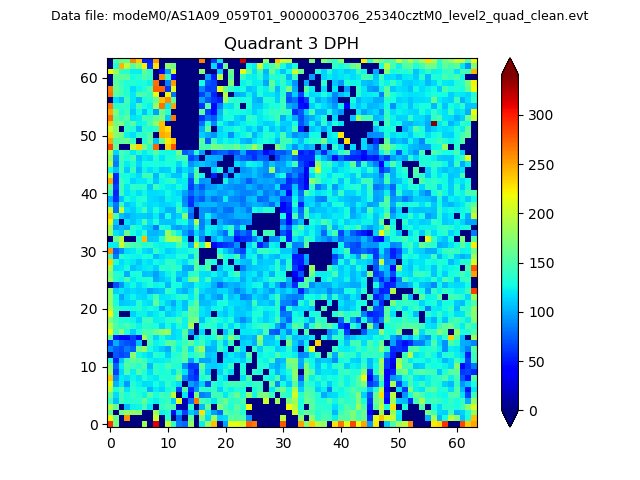 |
 |
Quadrant C |
| Plot type | Count rate plots | Images |
|---|---|---|
| Comparison with Poisson distribution Blue bars denote a histogram of data divided into 1 sec bins. Red curve is a Poisson curve with rate = median count rate of data. |
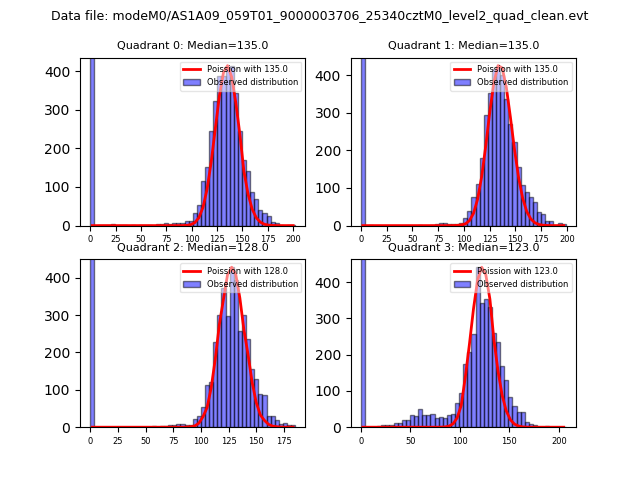 |
 |
| Quadrant-wise count rates Data is divided into 100 sec bins |
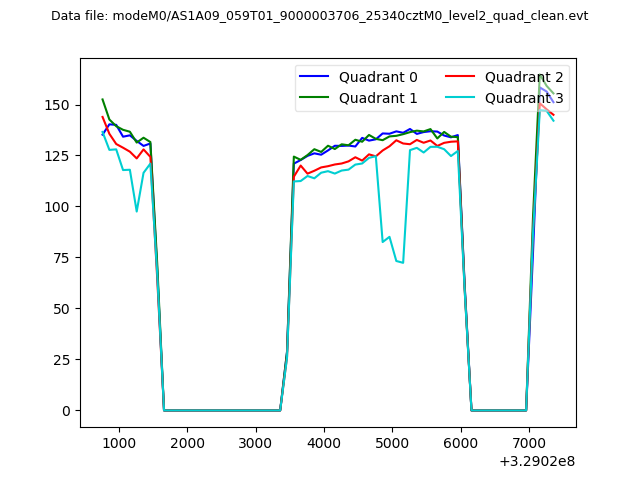 |
|
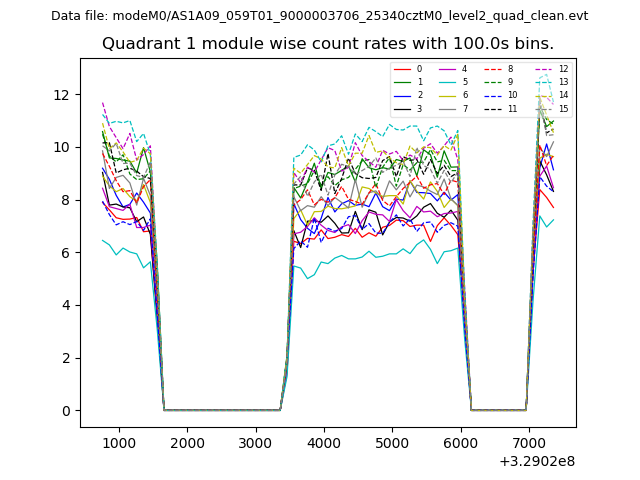
| Module-wise count rates for Quadrant A Data is divided into 100 sec bins |
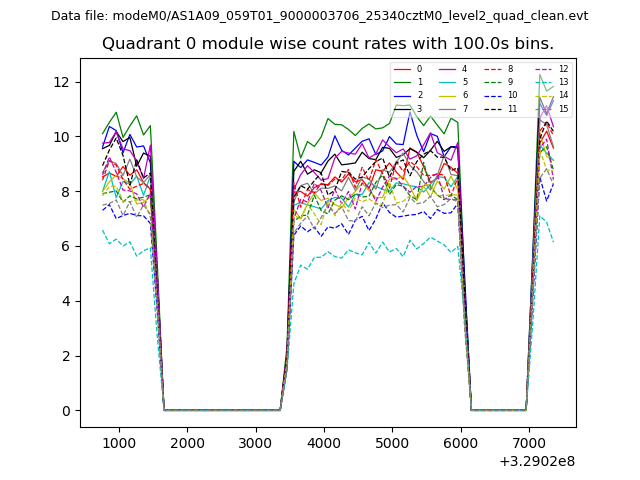 |
 |
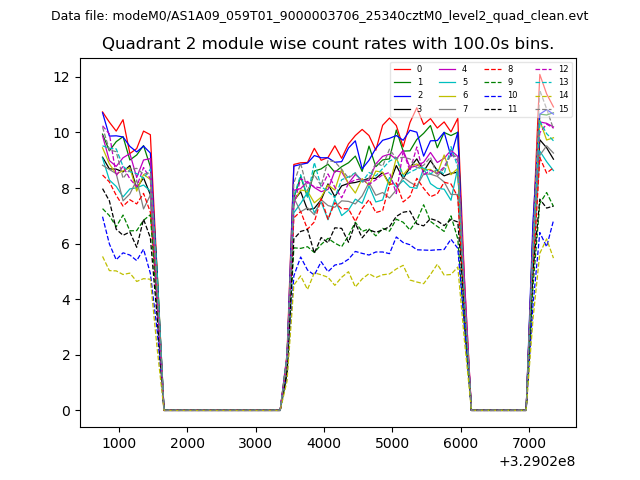
| Module-wise count rates for Quadrant B Data is divided into 100 sec bins |
 |
 |
| Module-wise count rates for Quadrant C Data is divided into 100 sec bins |
 |
 |
| Module-wise count rates for Quadrant D Data is divided into 100 sec bins |
 |
 |
| Parameter | Plot |
|---|---|
| CZT HV Monitor | 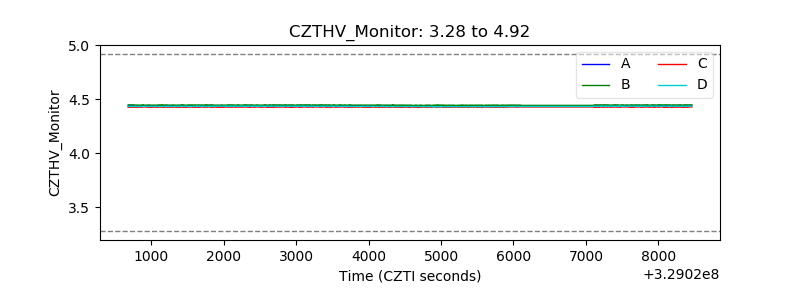 |
| D_VDD | 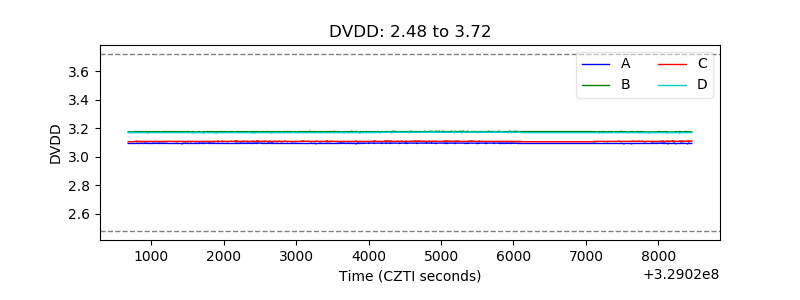 |
| Temperature 1 | 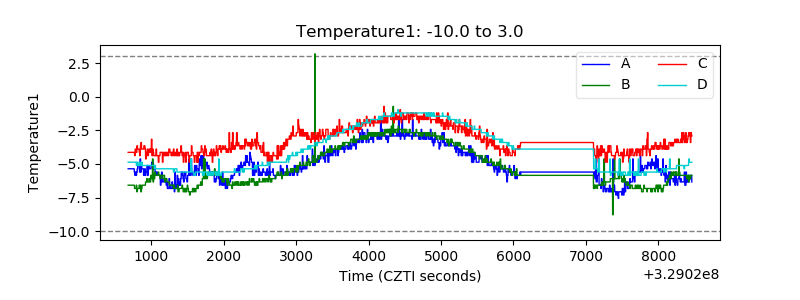 |
| Veto HV Monitor | 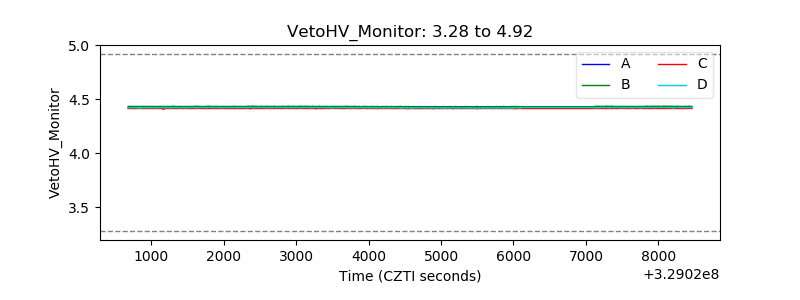 |
| Veto LLD | 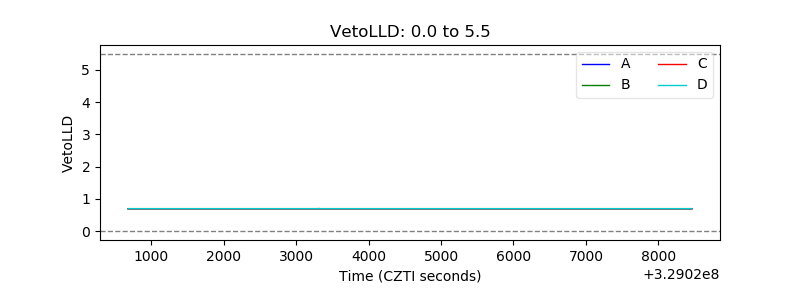 |
| Alpha Counter | 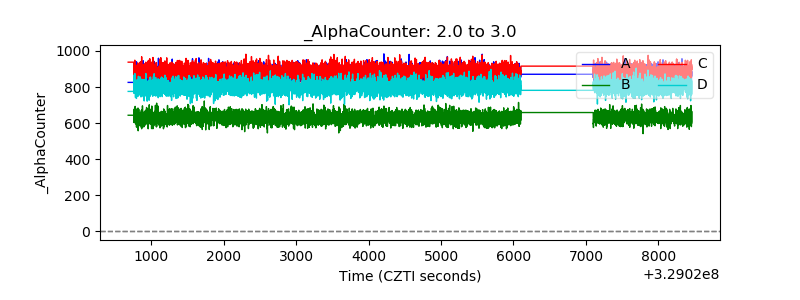 |
| _CPM_Rate |  |
| CZT Counter | 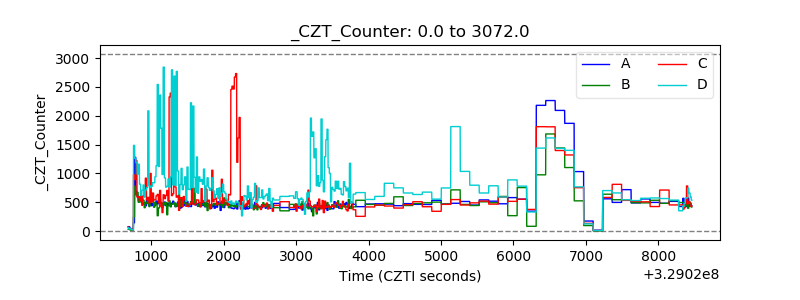 |
| +2.5 Volts monitor | 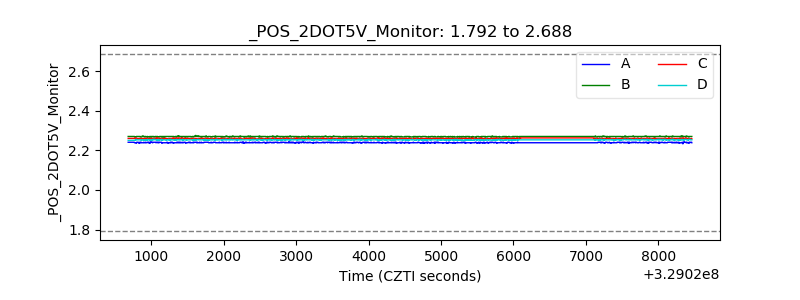 |
| +5 Volts monitor | 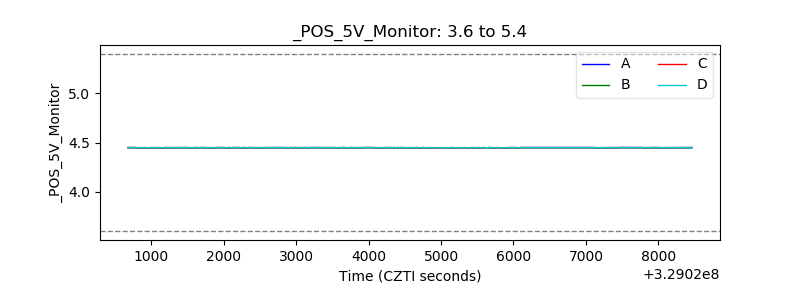 |
| _ROLL_ROT | 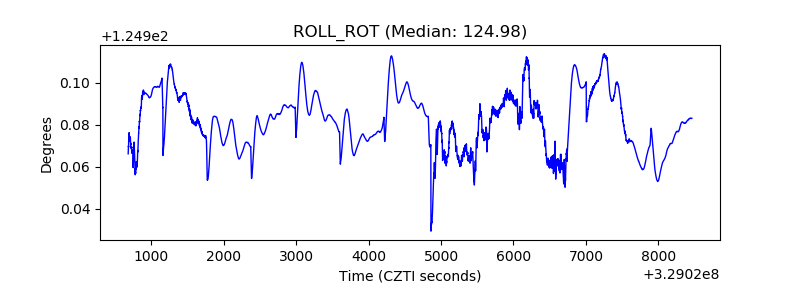 |
| _Roll_DEC | 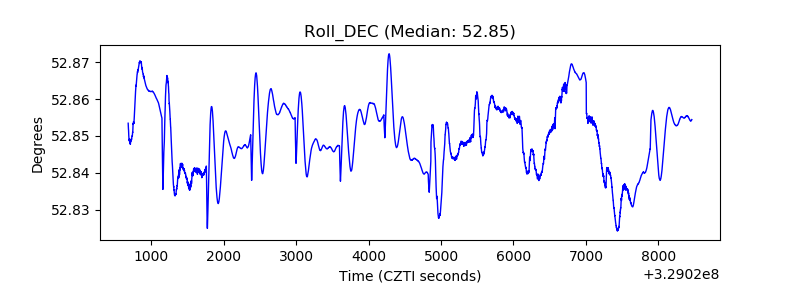 |
| _Roll_RA | 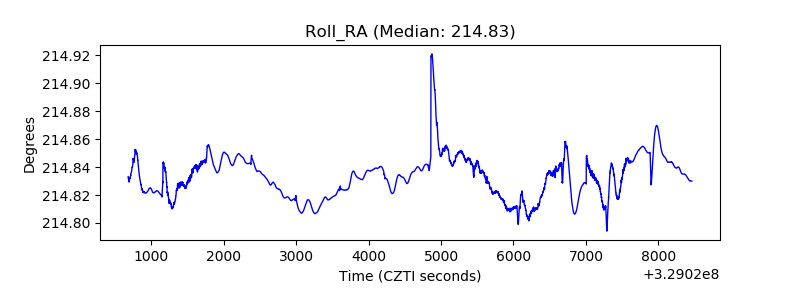 |
| Veto Counter |  |