| Param | Original file | Final file |
|---|---|---|
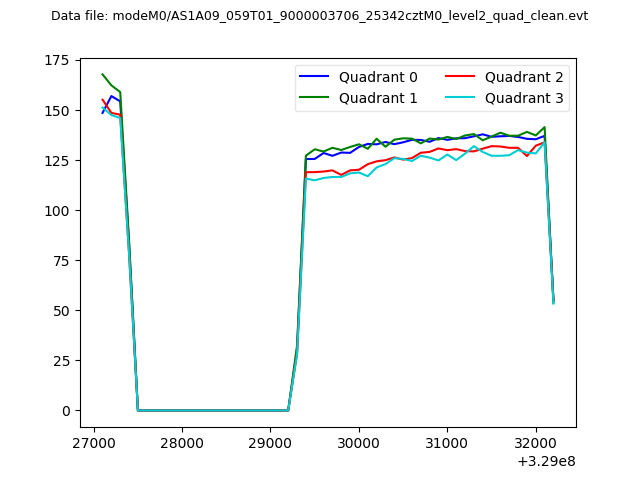
| Filename | modeM0/AS1A09_059T01_9000003706_25342cztM0_level2.evt | modeM0/AS1A09_059T01_9000003706_25342cztM0_level2_quad_clean.evt |
| Size (bytes) | 504,054,720 | 71,496,000 |
| Size | 480.7 MB | 68.2 MB |
| Events in quadrant A | 3,344,809 | 436,748 |
| Events in quadrant B | 3,343,577 | 443,091 |
| Events in quadrant C | 3,535,829 | 415,509 |
| Events in quadrant D | 4,592,587 | 408,114 |
| Mode M0 | |||
|---|---|---|---|
| Quadrant | BADHDUFLAG | Total packets | Discarded packets |
| A | 0 | 13965 | 0 |
| B | 0 | 13989 | 0 |
| C | 0 | 14604 | 0 |
| D | 0 | 18478 | 0 |
| Mode M9 | |||
|---|---|---|---|
| Quadrant | BADHDUFLAG | Total packets | Discarded packets |
| A | 0 | 19 | 0 |
| B | 0 | 20 | 0 |
| C | 0 | 20 | 0 |
| D | 0 | 20 | 0 |
| Quadrant | Total seconds | Saturated seconds | Saturation percentage |
|---|---|---|---|
| A | 6615 | 74 | 1.118670% |
| B | 6615 | 69 | 1.043084% |
| C | 6615 | 102 | 1.541950% |
| D | 6615 | 84 | 1.269841% |
Noise dominated data is calculated using 1-second bins in cleaned event files. If a bin has >2000 counts, and if more than 50% of those come from <1% of pixels, then it is considered to be noise-dominated and hence unusable.
| Quadrant | # 1 sec bins | Bins with >0 counts | Bins with >2000 counts | High rate bins dominated by noise | Noise dominated (total time) | Noise dominated (detector-on time) | Marked lightcurve |
|---|---|---|---|---|---|---|---|
| A | 7710 | 6616 | 17 | 17 | 0.22% | 0.26% | 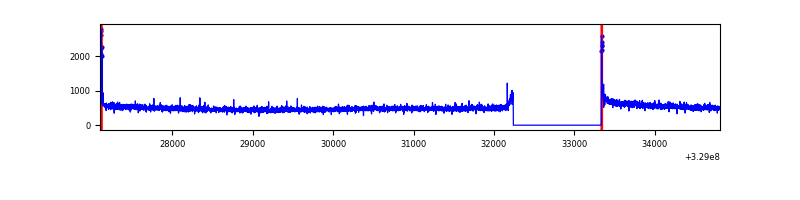 |
| B | 7710 | 6616 | 1 | 1 | 0.01% | 0.02% | 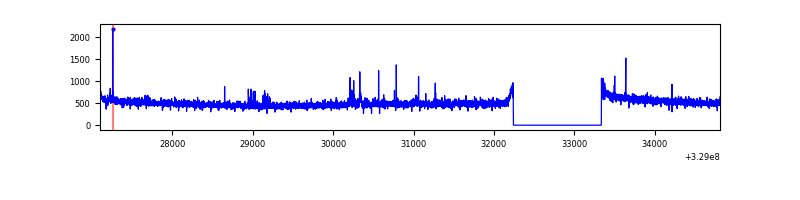 |
| C | 7710 | 6616 | 8 | 8 | 0.10% | 0.12% | 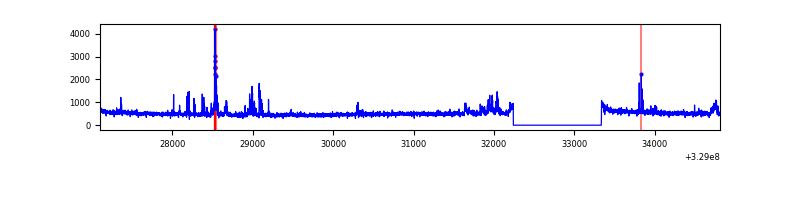 |
| D | 7710 | 6616 | 32 | 32 | 0.42% | 0.48% | 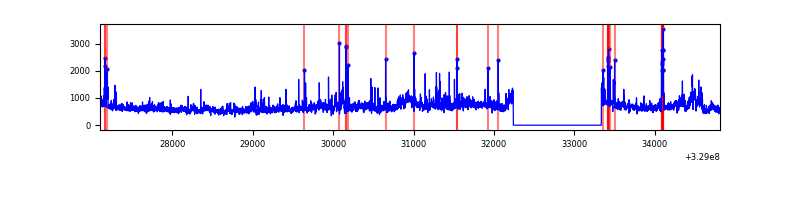 |
Top three noisy pixels from each quadrant. If the there are fewer than three noisy pixels in the level2.evt file, extra rows are filled as -1
| Pixel properties | Quadrant properties | ||||||
|---|---|---|---|---|---|---|---|
| Quadrant | DetID | PixID | Counts | Sigma | Mean | Median | Sigma |
| A | 8 | 192 | 59902 | 349.3 | 849 | 835 | 169.1 |
| A | 6 | 16 | 11419 | 62.59 | 849 | 835 | 169.1 |
| A | 13 | 254 | 9675 | 52.28 | 849 | 835 | 169.1 |
| B | 3 | 112 | 29700 | 181.34 | 843 | 823 | 159.2 |
| B | 12 | 111 | 19525 | 117.44 | 843 | 823 | 159.2 |
| B | 11 | 111 | 17673 | 105.81 | 843 | 823 | 159.2 |
| C | 9 | 54 | 204615 | 1083.69 | 803 | 811 | 188.1 |
| C | 14 | 238 | 129665 | 685.16 | 803 | 811 | 188.1 |
| C | 3 | 233 | 69615 | 365.85 | 803 | 811 | 188.1 |
| D | 1 | 52 | 804036 | 4107.37 | 815 | 793 | 195.6 |
| D | 8 | 195 | 300086 | 1530.43 | 815 | 793 | 195.6 |
| D | 7 | 238 | 139071 | 707.08 | 815 | 793 | 195.6 |
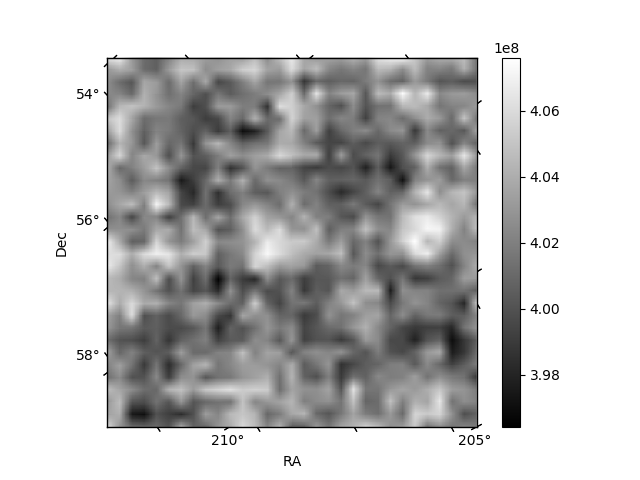
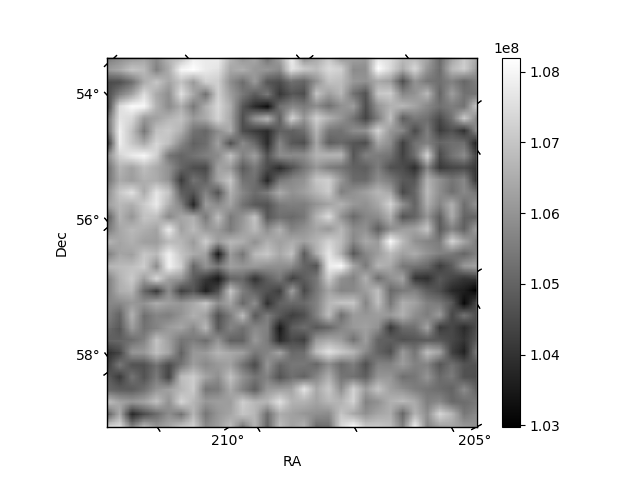
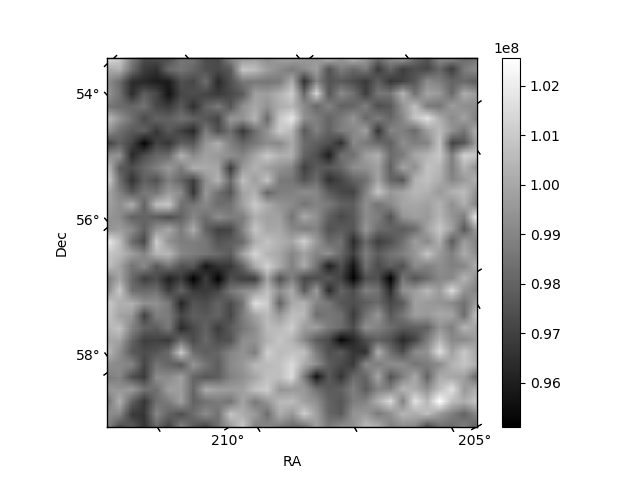
Histogram calculated using DETX and DETY for each event in the final _common_clean file
| Quadrant A | 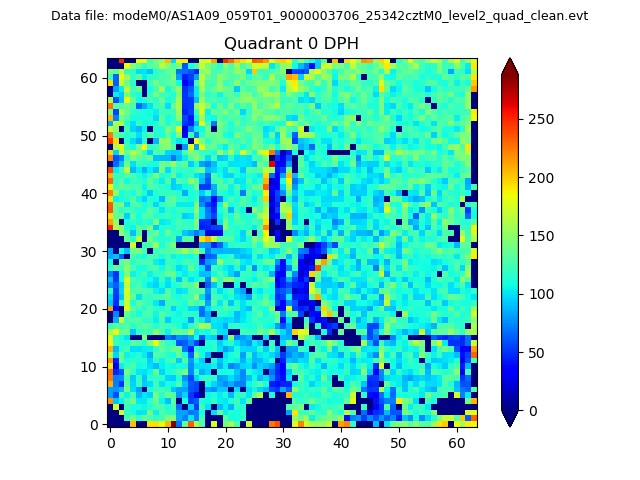 |
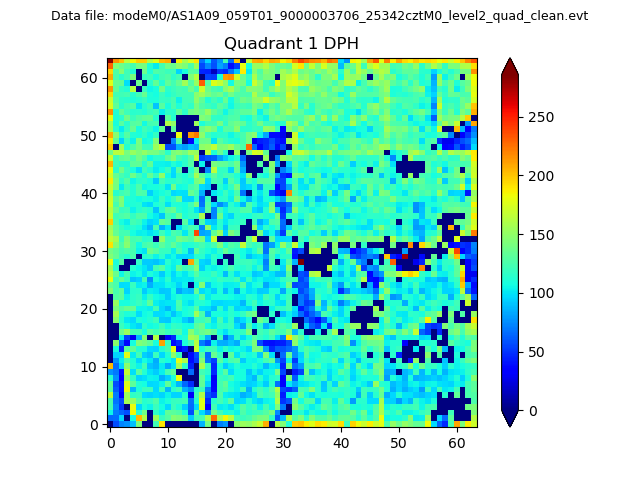 |
Quadrant B |
|---|---|---|---|
| Quadrant D | 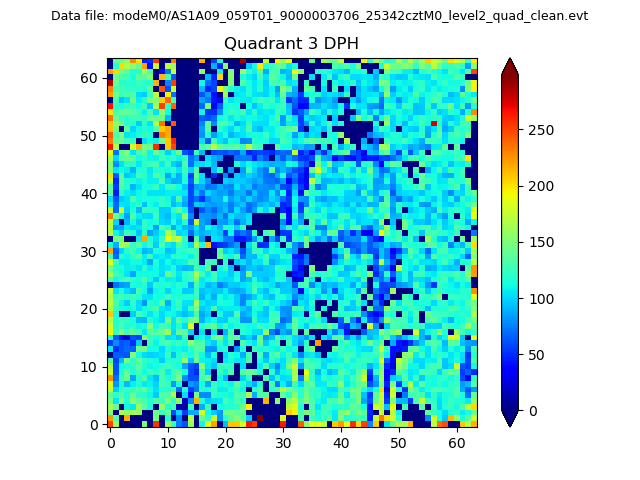 |
 |
Quadrant C |
| Plot type | Count rate plots | Images |
|---|---|---|
| Comparison with Poisson distribution Blue bars denote a histogram of data divided into 1 sec bins. Red curve is a Poisson curve with rate = median count rate of data. |
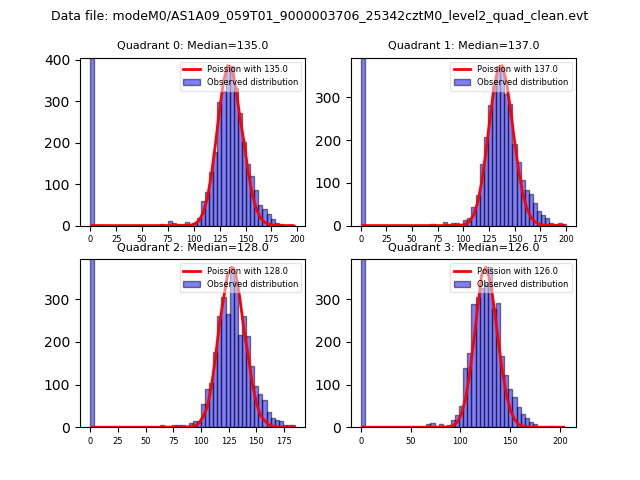 |
 |
| Quadrant-wise count rates Data is divided into 100 sec bins |
 |
|
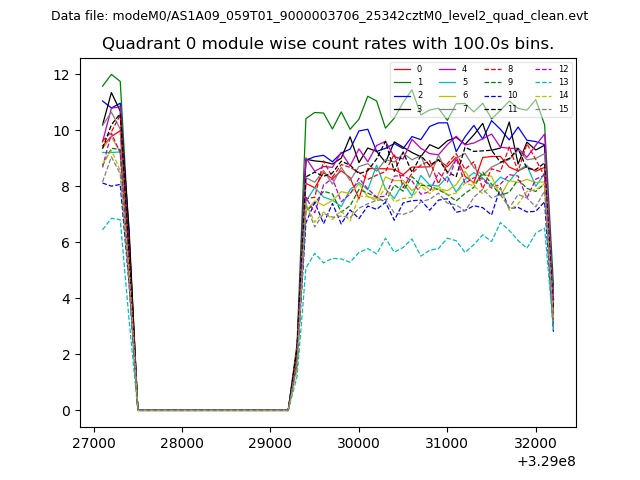
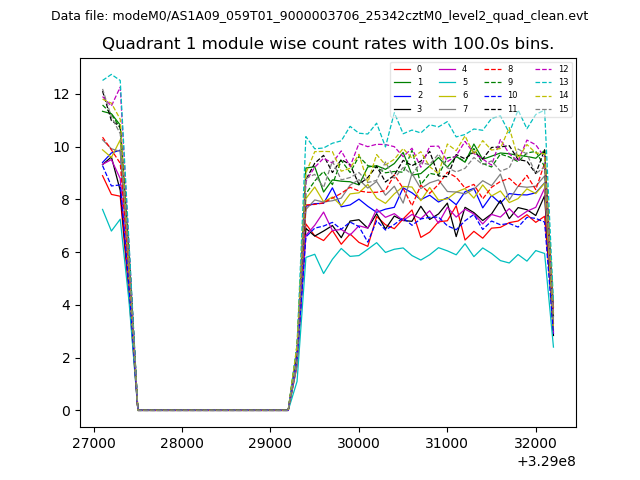
| Module-wise count rates for Quadrant A Data is divided into 100 sec bins |
 |
 |
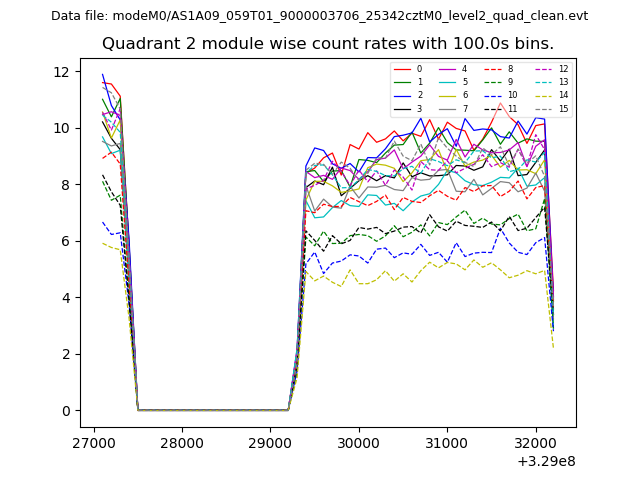
| Module-wise count rates for Quadrant B Data is divided into 100 sec bins |
 |
 |
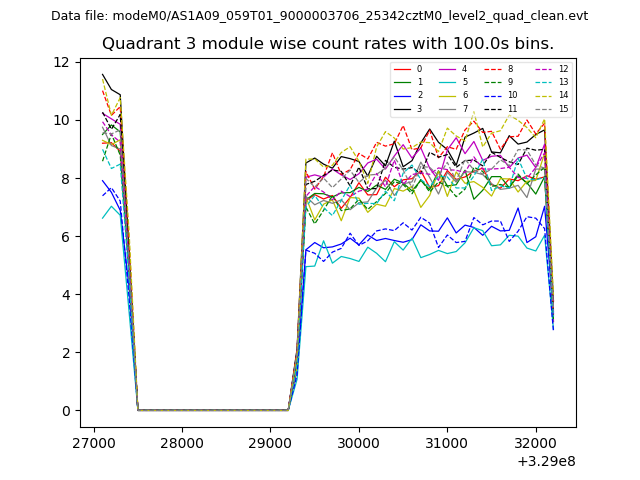
| Module-wise count rates for Quadrant C Data is divided into 100 sec bins |
 |
 |
| Module-wise count rates for Quadrant D Data is divided into 100 sec bins |
 |
 |
| Parameter | Plot |
|---|---|
| CZT HV Monitor | 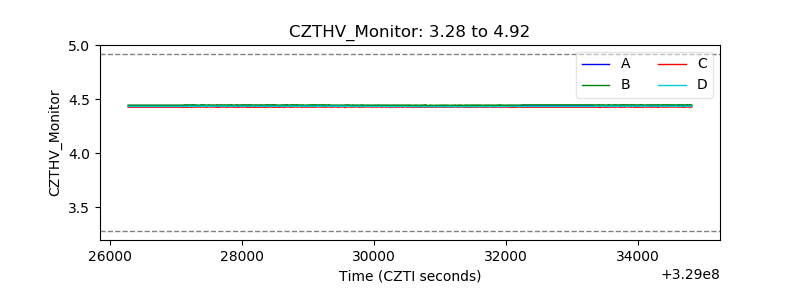 |
| D_VDD | 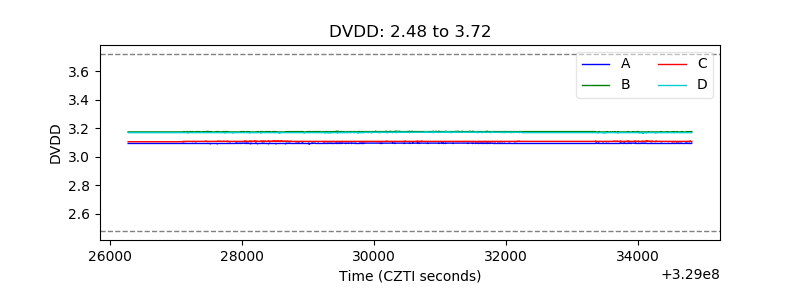 |
| Temperature 1 | 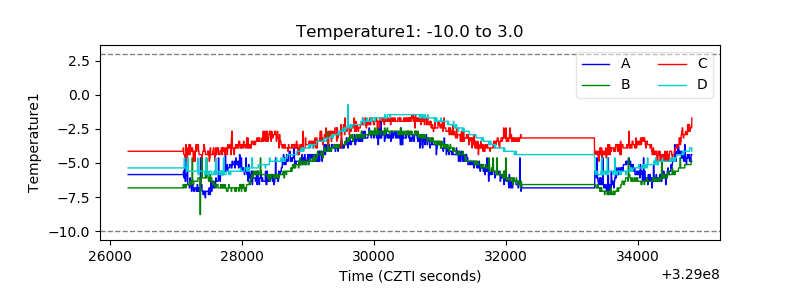 |
| Veto HV Monitor | 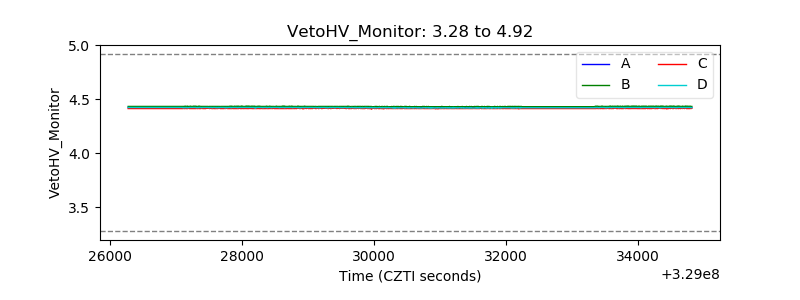 |
| Veto LLD | 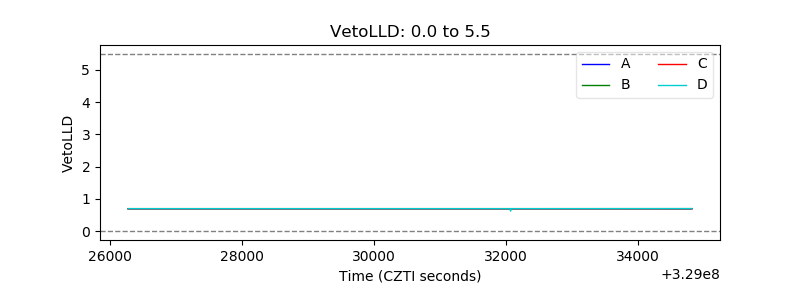 |
| Alpha Counter | 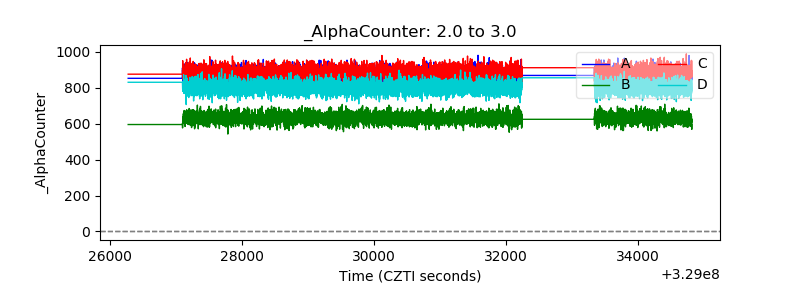 |
| _CPM_Rate | 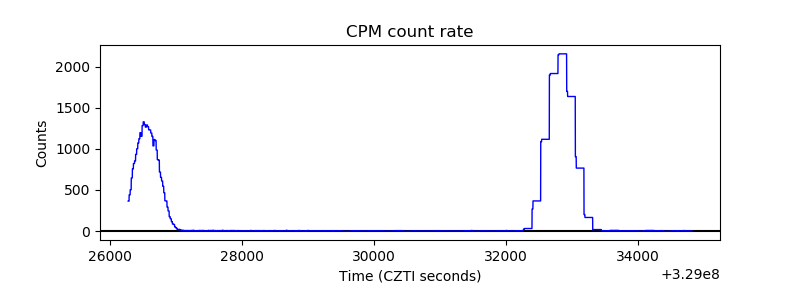 |
| CZT Counter | 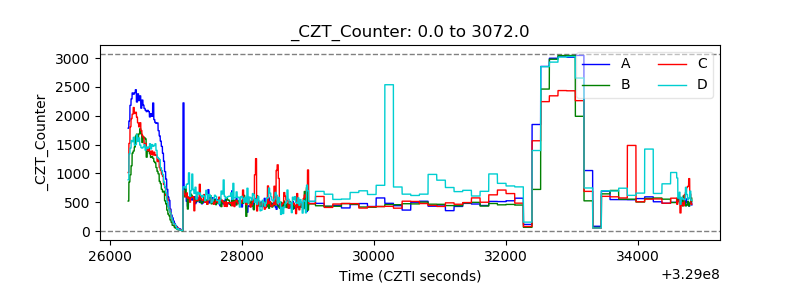 |
| +2.5 Volts monitor |  |
| +5 Volts monitor |  |
| _ROLL_ROT | 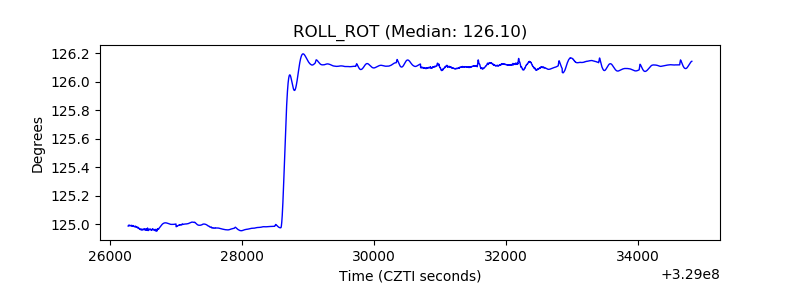 |
| _Roll_DEC | 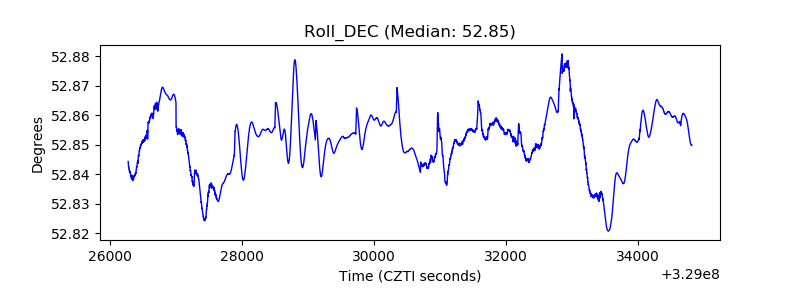 |
| _Roll_RA | 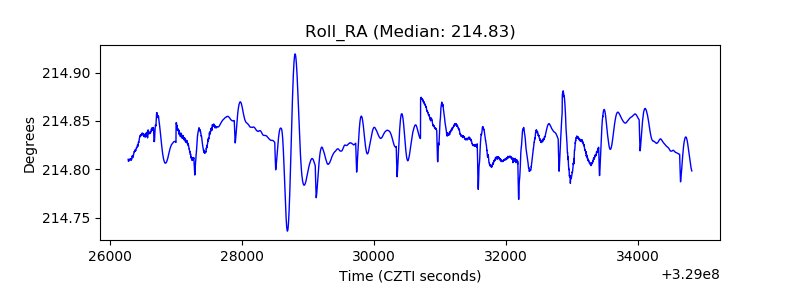 |
| Veto Counter | 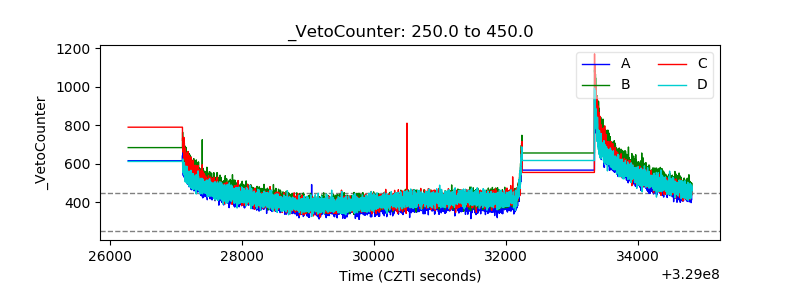 |