| Param | Original file | Final file |
|---|---|---|
| Filename | modeM0/AS1A09_059T01_9000003706_25343cztM0_level2.evt | modeM0/AS1A09_059T01_9000003706_25343cztM0_level2_quad_clean.evt |
| Size (bytes) | 532,762,560 | 71,536,320 |
| Size | 508.1 MB | 68.2 MB |
| Events in quadrant A | 3,363,645 | 448,982 |
| Events in quadrant B | 3,473,514 | 449,600 |
| Events in quadrant C | 3,484,544 | 421,017 |
| Events in quadrant D | 5,386,621 | 407,091 |
| Mode M0 | |||
|---|---|---|---|
| Quadrant | BADHDUFLAG | Total packets | Discarded packets |
| A | 0 | 13918 | 0 |
| B | 0 | 14266 | 0 |
| C | 0 | 14251 | 0 |
| D | 0 | 20468 | 0 |
| Mode M9 | |||
|---|---|---|---|
| Quadrant | BADHDUFLAG | Total packets | Discarded packets |
| A | 0 | 12 | 0 |
| B | 0 | 12 | 0 |
| C | 0 | 12 | 0 |
| D | 0 | 12 | 0 |
| Quadrant | Total seconds | Saturated seconds | Saturation percentage |
|---|---|---|---|
| A | 6294 | 96 | 1.525262% |
| B | 6295 | 113 | 1.795075% |
| C | 6295 | 133 | 2.112788% |
| D | 6295 | 201 | 3.193010% |
Noise dominated data is calculated using 1-second bins in cleaned event files. If a bin has >2000 counts, and if more than 50% of those come from <1% of pixels, then it is considered to be noise-dominated and hence unusable.
| Quadrant | # 1 sec bins | Bins with >0 counts | Bins with >2000 counts | High rate bins dominated by noise | Noise dominated (total time) | Noise dominated (detector-on time) | Marked lightcurve |
|---|---|---|---|---|---|---|---|
| A | 7504 | 6294 | 6 | 6 | 0.08% | 0.10% | 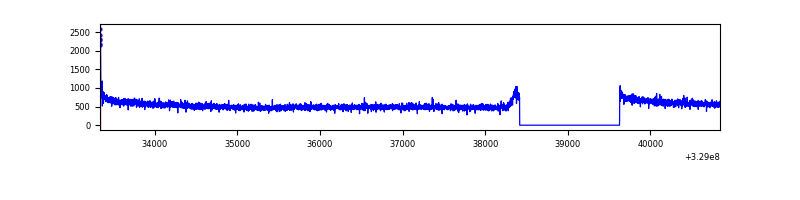 |
| B | 7505 | 6295 | 0 | 0 | 0.00% | 0.00% | 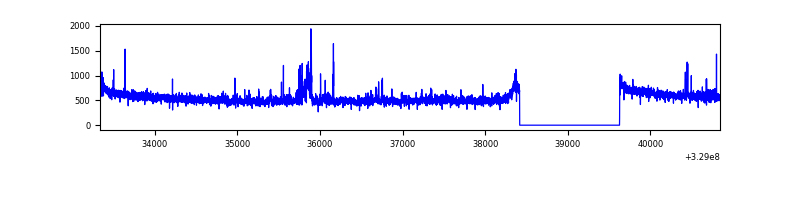 |
| C | 7505 | 6295 | 8 | 8 | 0.11% | 0.13% | 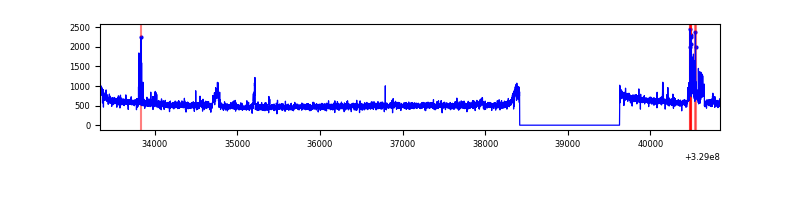 |
| D | 7505 | 6295 | 113 | 113 | 1.51% | 1.80% | 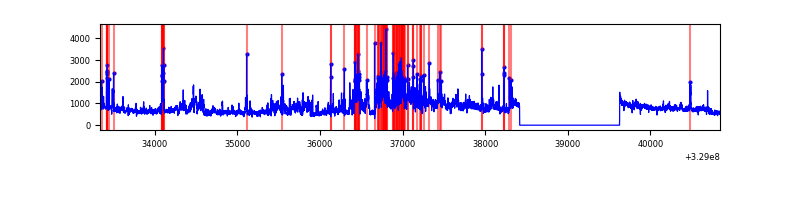 |
Top three noisy pixels from each quadrant. If the there are fewer than three noisy pixels in the level2.evt file, extra rows are filled as -1
| Pixel properties | Quadrant properties | ||||||
|---|---|---|---|---|---|---|---|
| Quadrant | DetID | PixID | Counts | Sigma | Mean | Median | Sigma |
| A | 8 | 192 | 18163 | 101.38 | 867 | 852 | 170.7 |
| A | 13 | 254 | 9384 | 49.97 | 867 | 852 | 170.7 |
| A | 3 | 137 | 7391 | 38.3 | 867 | 852 | 170.7 |
| B | 3 | 112 | 109711 | 687.75 | 853 | 835 | 158.3 |
| B | 12 | 111 | 18944 | 114.39 | 853 | 835 | 158.3 |
| B | 11 | 111 | 17291 | 103.95 | 853 | 835 | 158.3 |
| C | 9 | 54 | 139587 | 741.74 | 812 | 817 | 187.1 |
| C | 14 | 238 | 132481 | 703.76 | 812 | 817 | 187.1 |
| C | 3 | 233 | 46657 | 245.02 | 812 | 817 | 187.1 |
| D | 1 | 52 | 1322810 | 6685.97 | 825 | 803 | 197.7 |
| D | 12 | 235 | 433809 | 2189.9 | 825 | 803 | 197.7 |
| D | 8 | 195 | 188054 | 947.01 | 825 | 803 | 197.7 |
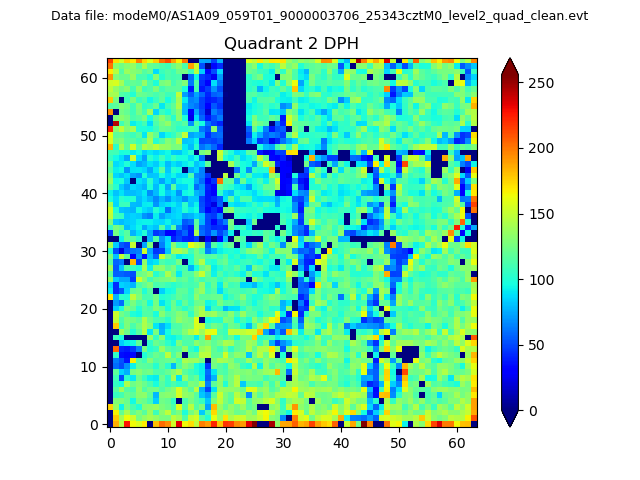
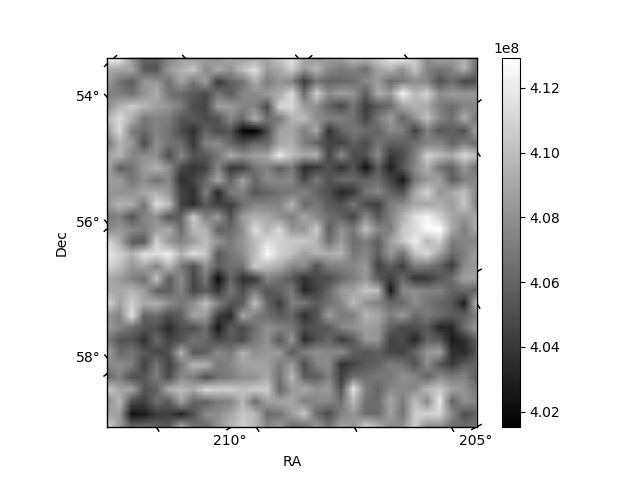
Histogram calculated using DETX and DETY for each event in the final _common_clean file
| Quadrant A | 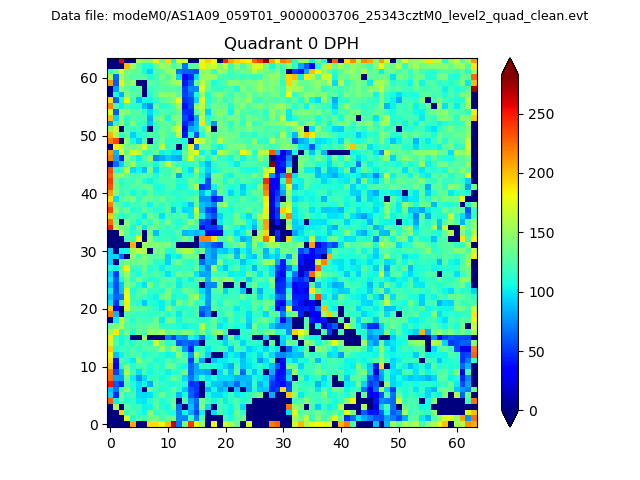 |
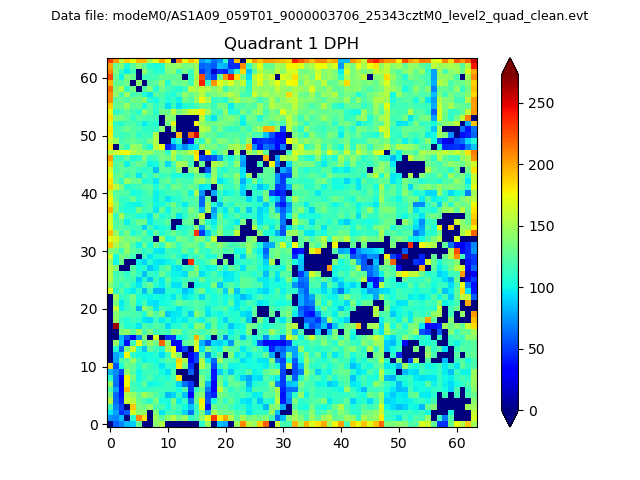 |
Quadrant B |
|---|---|---|---|
| Quadrant D | 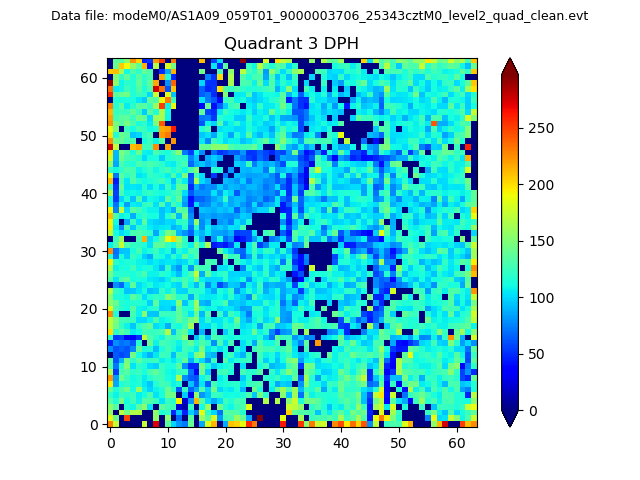 |
 |
Quadrant C |
| Plot type | Count rate plots | Images |
|---|---|---|
| Comparison with Poisson distribution Blue bars denote a histogram of data divided into 1 sec bins. Red curve is a Poisson curve with rate = median count rate of data. |
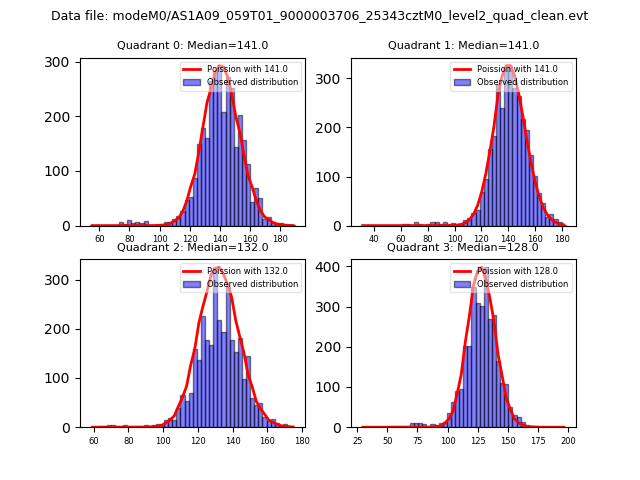 |
 |
| Quadrant-wise count rates Data is divided into 100 sec bins |
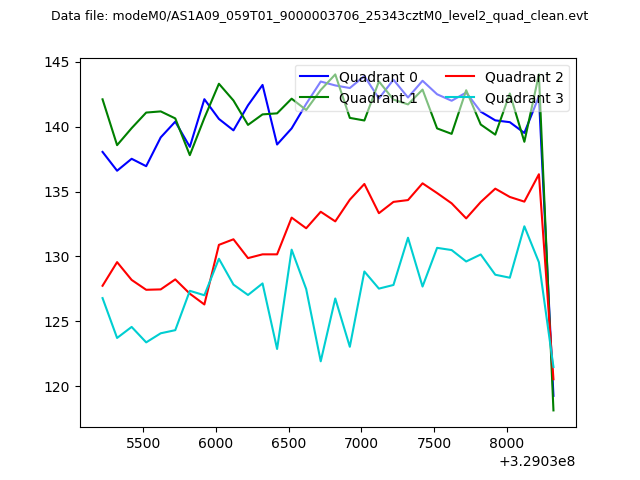 |
|
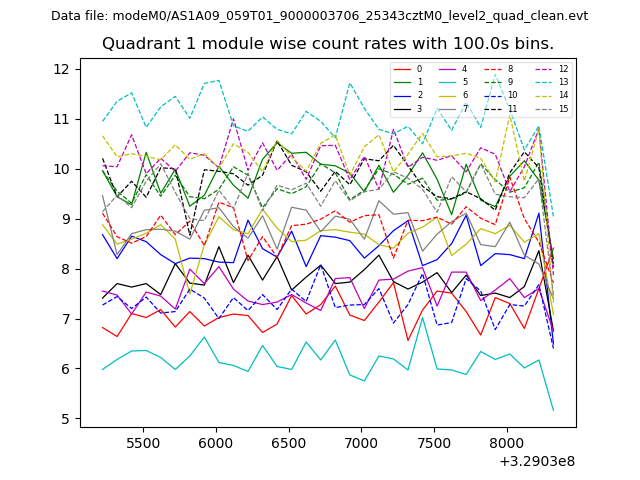
| Module-wise count rates for Quadrant A Data is divided into 100 sec bins |
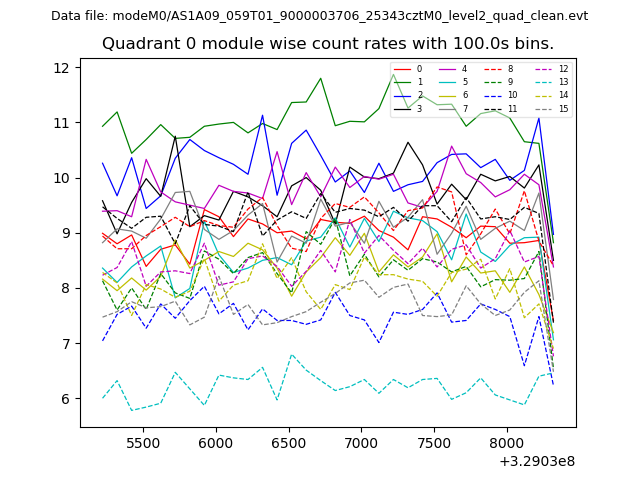 |
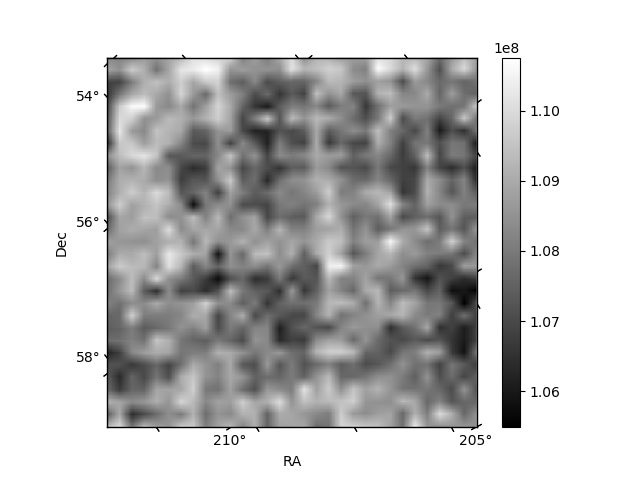 |
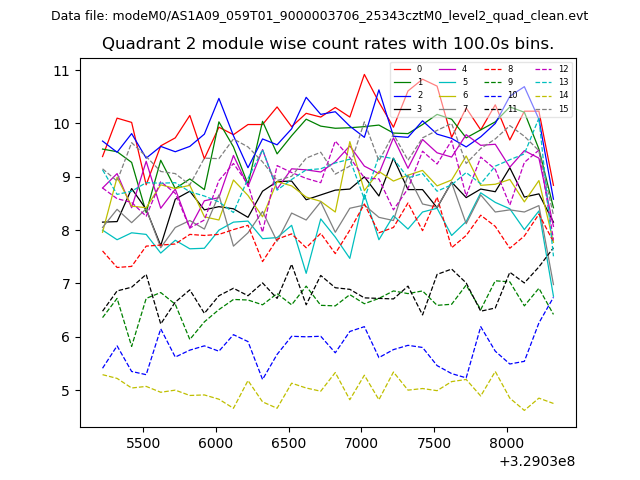
| Module-wise count rates for Quadrant B Data is divided into 100 sec bins |
 |
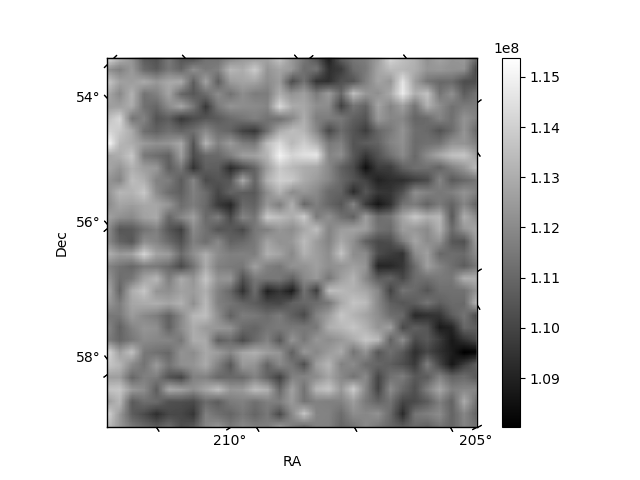 |
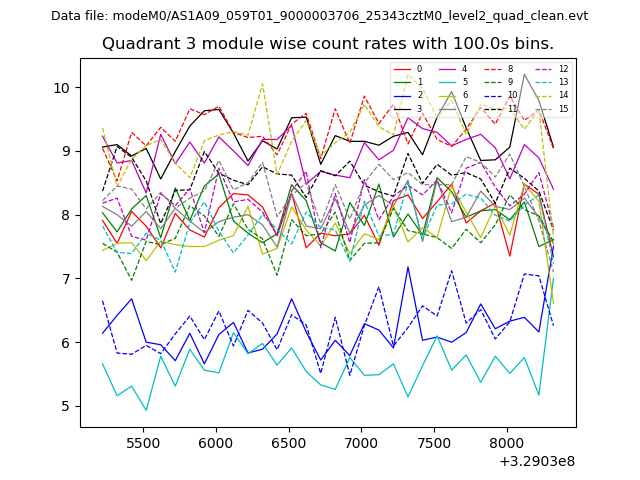
| Module-wise count rates for Quadrant C Data is divided into 100 sec bins |
 |
 |
| Module-wise count rates for Quadrant D Data is divided into 100 sec bins |
 |
 |
| Parameter | Plot |
|---|---|
| CZT HV Monitor | 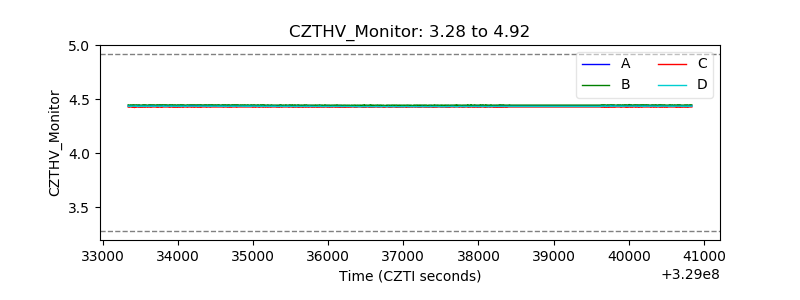 |
| D_VDD | 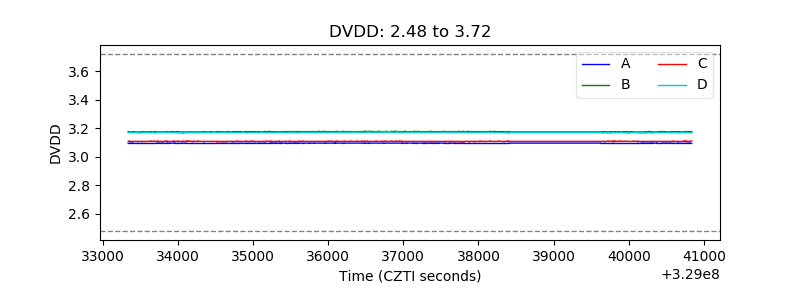 |
| Temperature 1 | 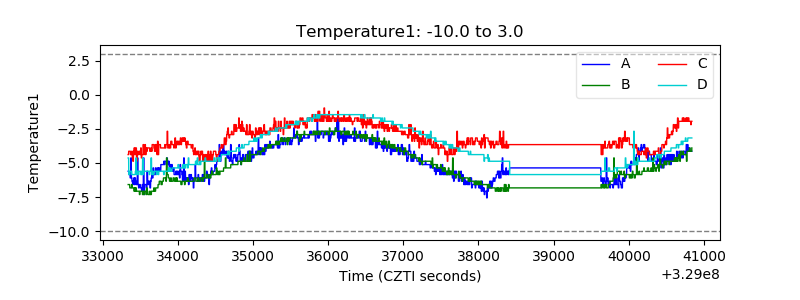 |
| Veto HV Monitor | 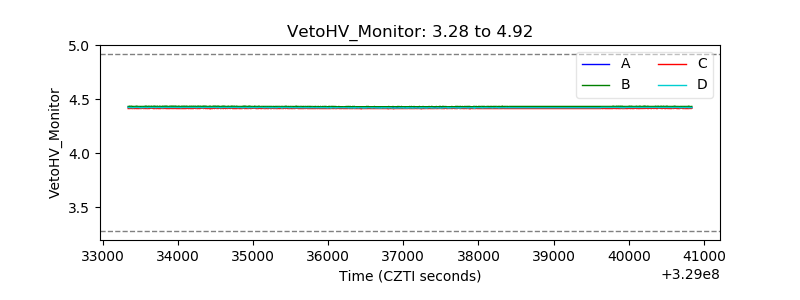 |
| Veto LLD | 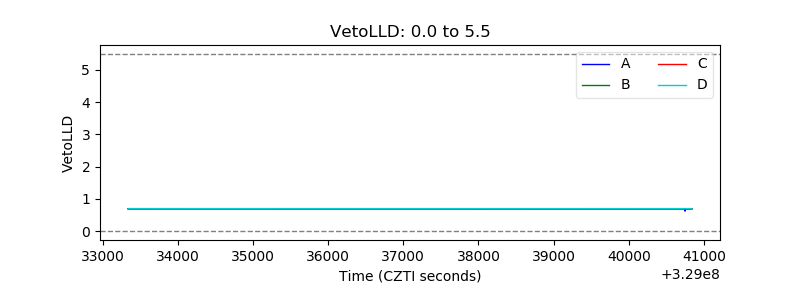 |
| Alpha Counter | 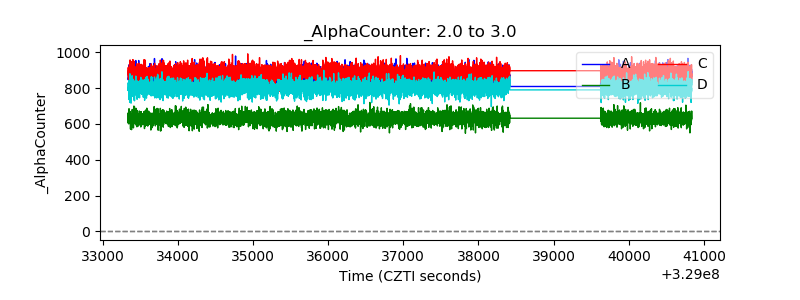 |
| _CPM_Rate | 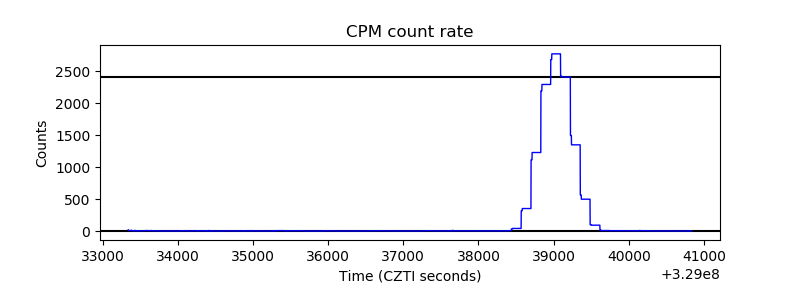 |
| CZT Counter | 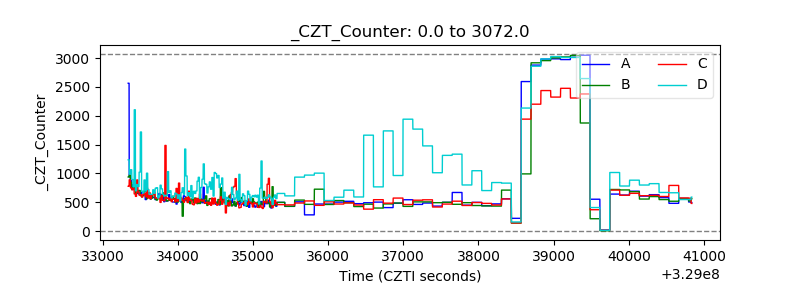 |
| +2.5 Volts monitor |  |
| +5 Volts monitor |  |
| _ROLL_ROT |  |
| _Roll_DEC | 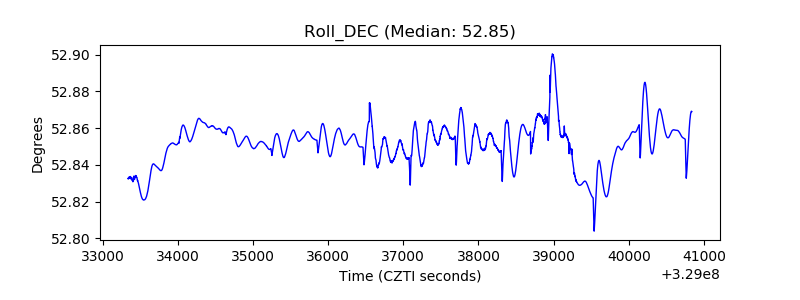 |
| _Roll_RA | 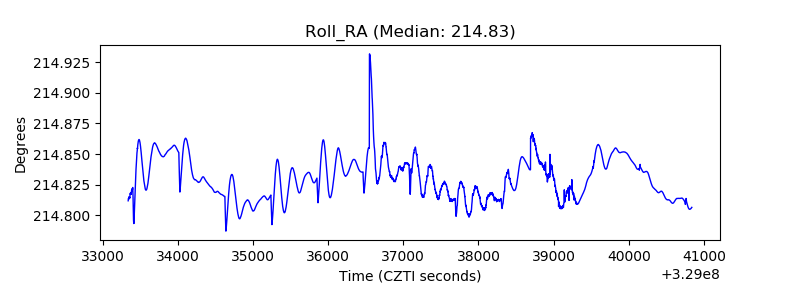 |
| Veto Counter |  |