| Param | Original file | Final file |
|---|---|---|
| Filename | modeM0/AS1A09_059T01_9000003706_25344cztM0_level2.evt | modeM0/AS1A09_059T01_9000003706_25344cztM0_level2_quad_clean.evt |
| Size (bytes) | 516,516,480 | 88,139,520 |
| Size | 492.6 MB | 84.1 MB |
| Events in quadrant A | 3,536,061 | 577,661 |
| Events in quadrant B | 3,554,595 | 580,188 |
| Events in quadrant C | 3,822,312 | 540,115 |
| Events in quadrant D | 4,304,004 | 532,785 |
| Mode M0 | |||
|---|---|---|---|
| Quadrant | BADHDUFLAG | Total packets | Discarded packets |
| A | 0 | 14520 | 0 |
| B | 0 | 14532 | 0 |
| C | 0 | 15277 | 0 |
| D | 0 | 17105 | 0 |
| Mode M9 | |||
|---|---|---|---|
| Quadrant | BADHDUFLAG | Total packets | Discarded packets |
| A | 0 | 20 | 0 |
| B | 0 | 21 | 0 |
| C | 0 | 21 | 0 |
| D | 0 | 21 | 0 |
| Quadrant | Total seconds | Saturated seconds | Saturation percentage |
|---|---|---|---|
| A | 6274 | 100 | 1.593880% |
| B | 6274 | 111 | 1.769206% |
| C | 6274 | 231 | 3.681862% |
| D | 6274 | 100 | 1.593880% |
Noise dominated data is calculated using 1-second bins in cleaned event files. If a bin has >2000 counts, and if more than 50% of those come from <1% of pixels, then it is considered to be noise-dominated and hence unusable.
| Quadrant | # 1 sec bins | Bins with >0 counts | Bins with >2000 counts | High rate bins dominated by noise | Noise dominated (total time) | Noise dominated (detector-on time) | Marked lightcurve |
|---|---|---|---|---|---|---|---|
| A | 7574 | 6274 | 0 | 0 | 0.00% | 0.00% | 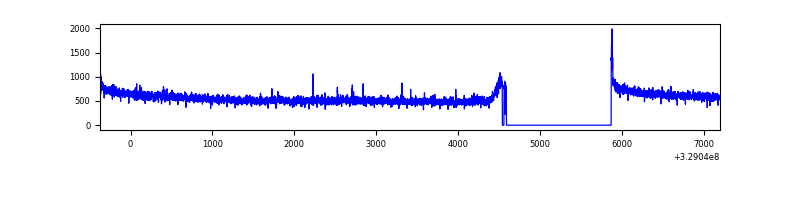 |
| B | 7574 | 6275 | 0 | 0 | 0.00% | 0.00% |  |
| C | 7574 | 6275 | 35 | 35 | 0.46% | 0.56% | 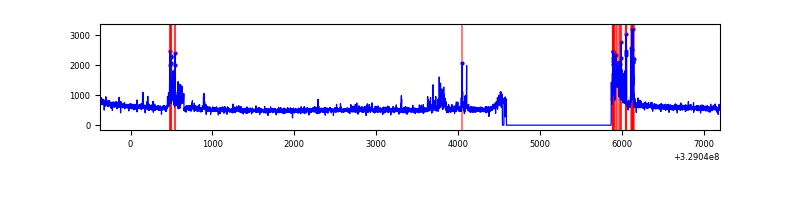 |
| D | 7574 | 6275 | 30 | 30 | 0.40% | 0.48% | 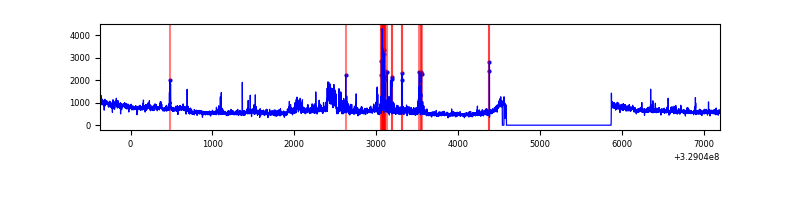 |
Top three noisy pixels from each quadrant. If the there are fewer than three noisy pixels in the level2.evt file, extra rows are filled as -1
| Pixel properties | Quadrant properties | ||||||
|---|---|---|---|---|---|---|---|
| Quadrant | DetID | PixID | Counts | Sigma | Mean | Median | Sigma |
| A | 8 | 192 | 35762 | 196.31 | 908 | 895 | 177.6 |
| A | 13 | 254 | 8874 | 44.92 | 908 | 895 | 177.6 |
| A | 0 | 226 | 7869 | 39.26 | 908 | 895 | 177.6 |
| B | 3 | 112 | 54389 | 329.66 | 891 | 873 | 162.3 |
| B | 12 | 111 | 19010 | 111.73 | 891 | 873 | 162.3 |
| B | 11 | 111 | 17275 | 101.04 | 891 | 873 | 162.3 |
| C | 9 | 54 | 365934 | 1896.36 | 842 | 850 | 192.5 |
| C | 14 | 238 | 138933 | 717.25 | 842 | 850 | 192.5 |
| C | 3 | 233 | 34544 | 175.02 | 842 | 850 | 192.5 |
| D | 8 | 195 | 542899 | 2615.01 | 871 | 850 | 207.3 |
| D | 1 | 52 | 212746 | 1022.25 | 871 | 850 | 207.3 |
| D | 12 | 233 | 107772 | 515.83 | 871 | 850 | 207.3 |
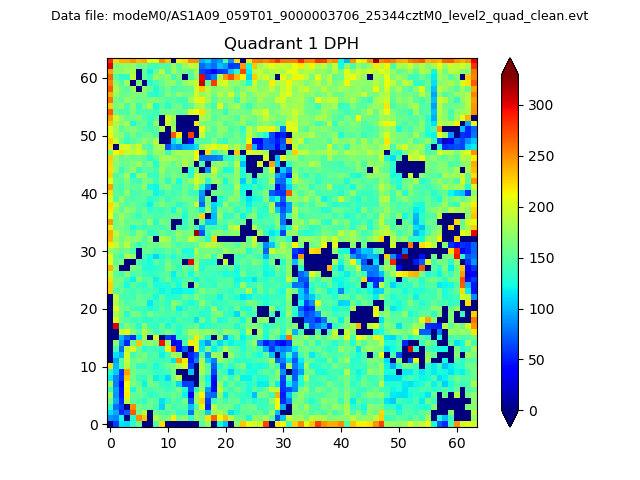
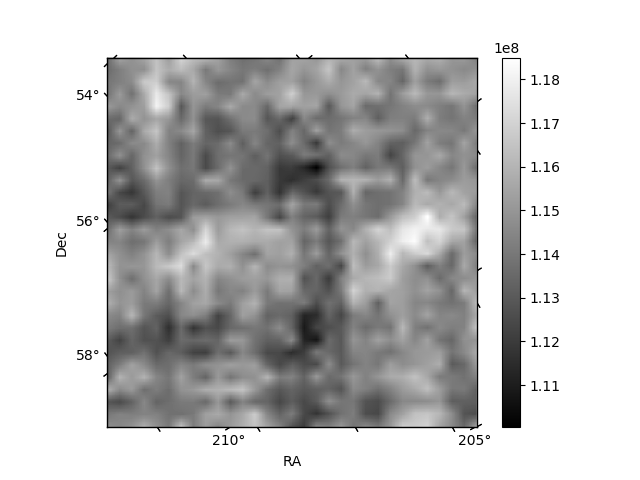
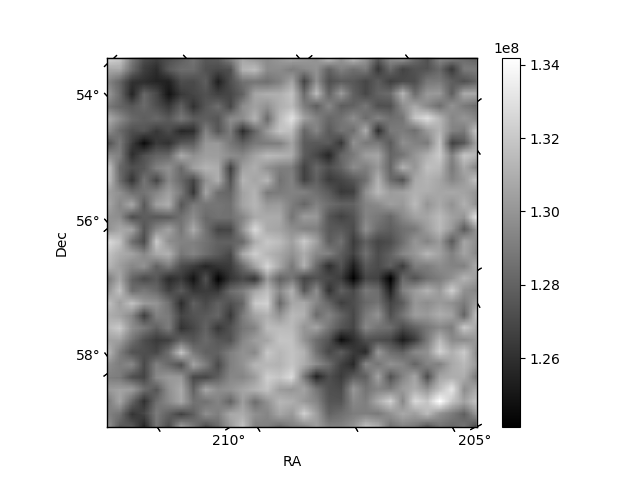
Histogram calculated using DETX and DETY for each event in the final _common_clean file
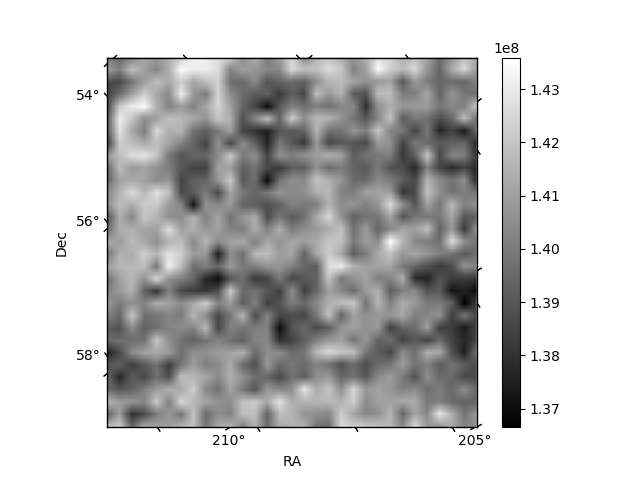
| Quadrant A | 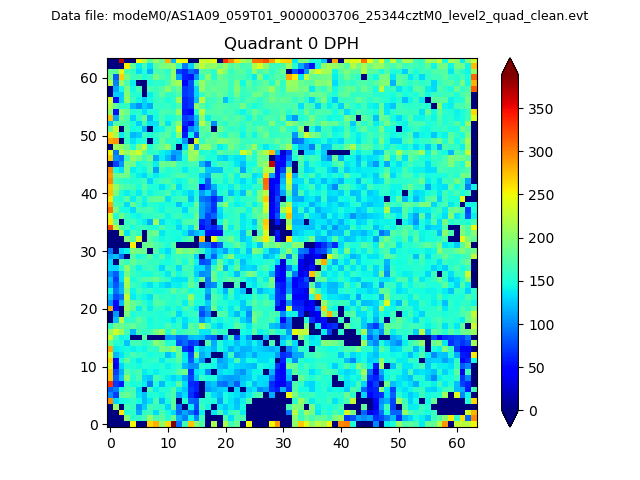 |
 |
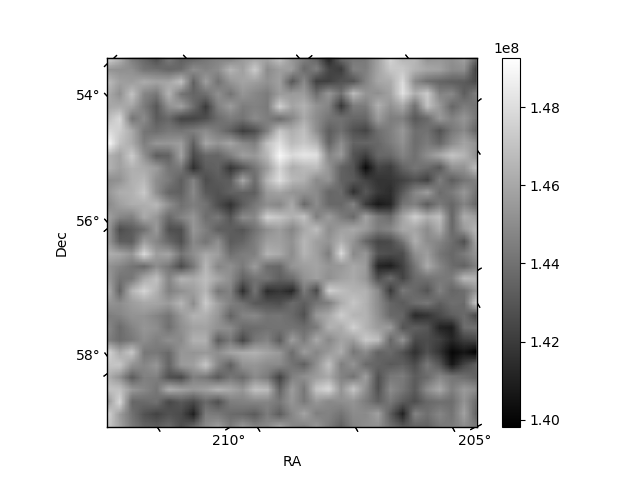
Quadrant B |
|---|---|---|---|
| Quadrant D | 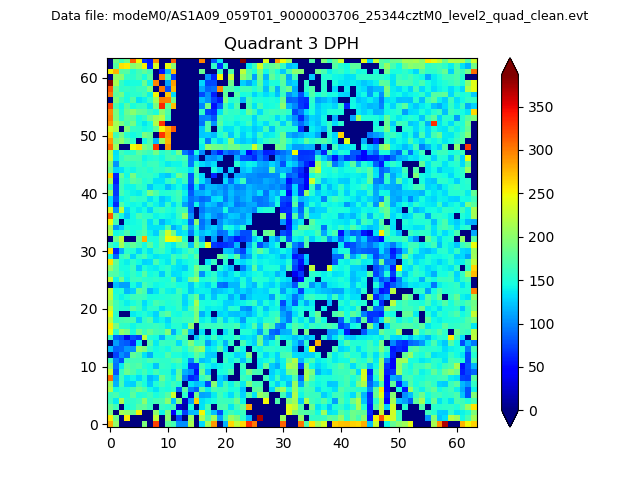 |
 |
Quadrant C |
| Plot type | Count rate plots | Images |
|---|---|---|
| Comparison with Poisson distribution Blue bars denote a histogram of data divided into 1 sec bins. Red curve is a Poisson curve with rate = median count rate of data. |
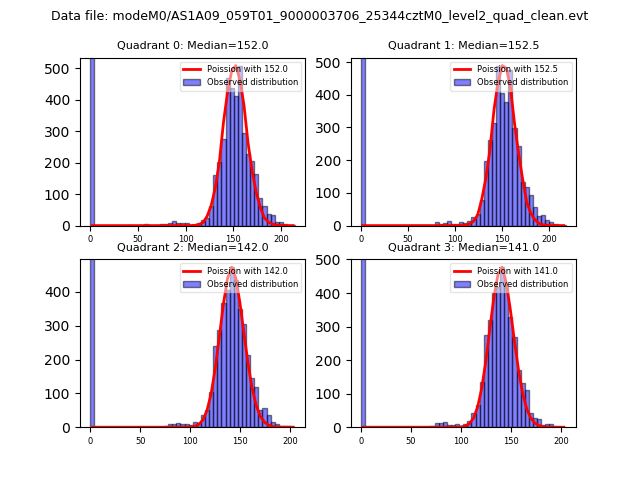 |
 |
| Quadrant-wise count rates Data is divided into 100 sec bins |
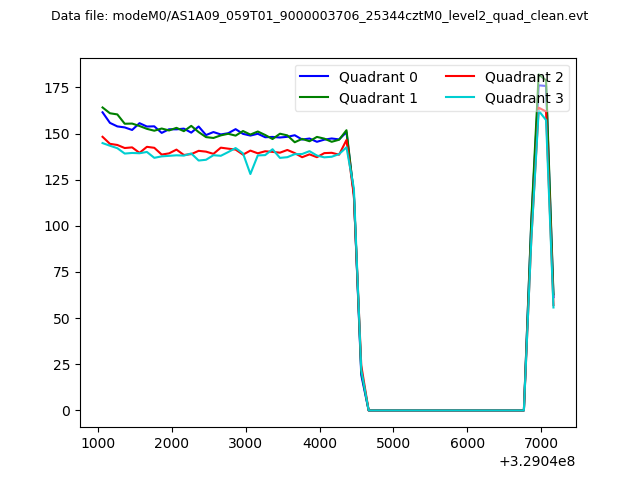 |
|
| Module-wise count rates for Quadrant A Data is divided into 100 sec bins |
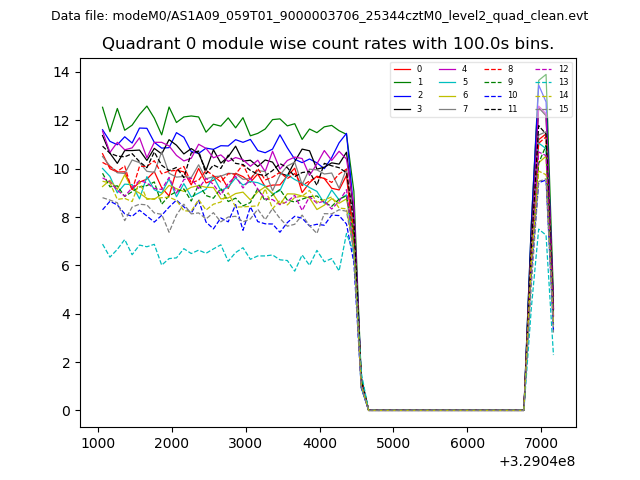 |
 |
| Module-wise count rates for Quadrant B Data is divided into 100 sec bins |
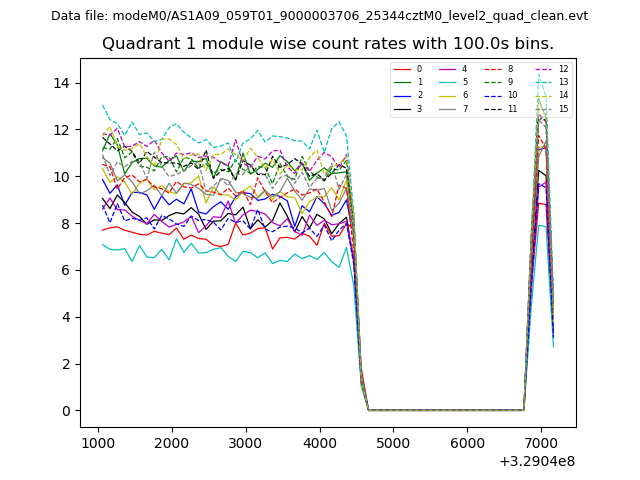 |
 |
| Module-wise count rates for Quadrant C Data is divided into 100 sec bins |
 |
 |
| Module-wise count rates for Quadrant D Data is divided into 100 sec bins |
 |
 |
| Parameter | Plot |
|---|---|
| CZT HV Monitor | 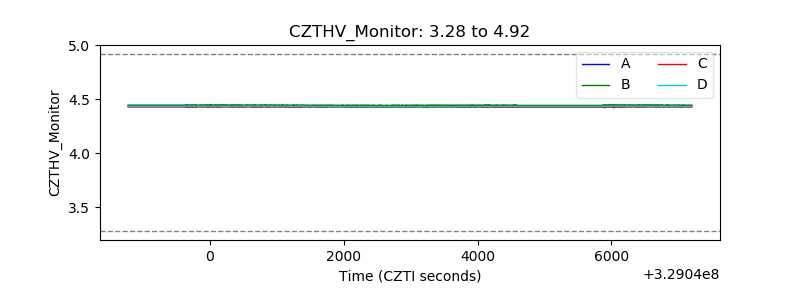 |
| D_VDD | 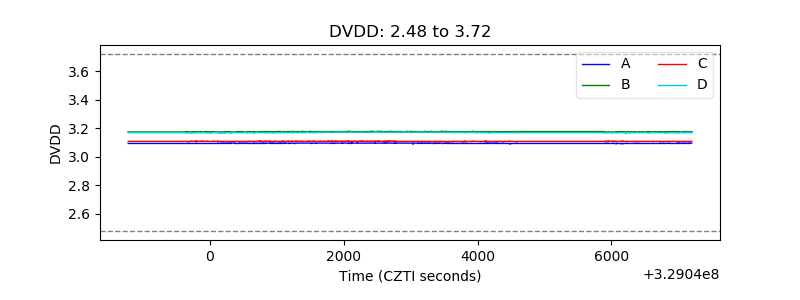 |
| Temperature 1 | 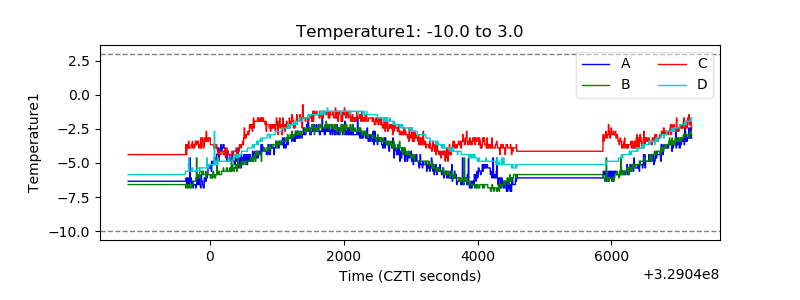 |
| Veto HV Monitor | 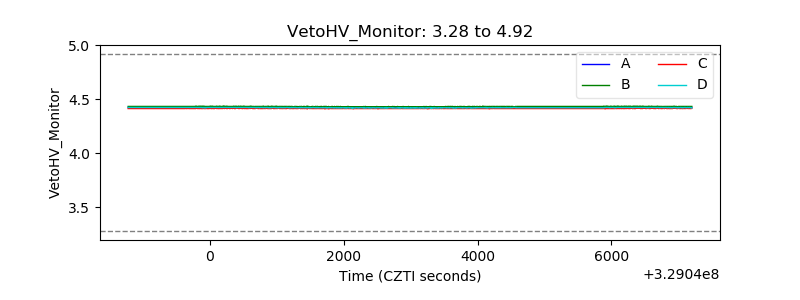 |
| Veto LLD | 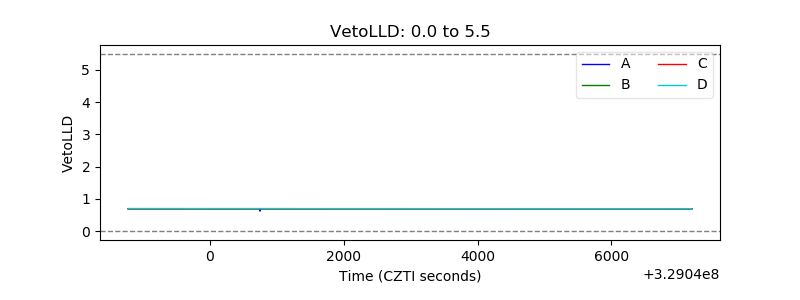 |
| Alpha Counter | 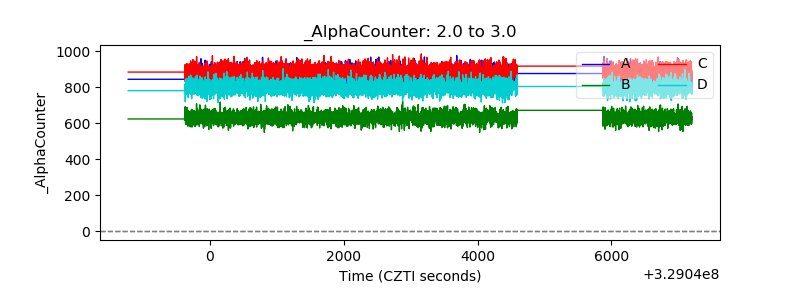 |
| _CPM_Rate | 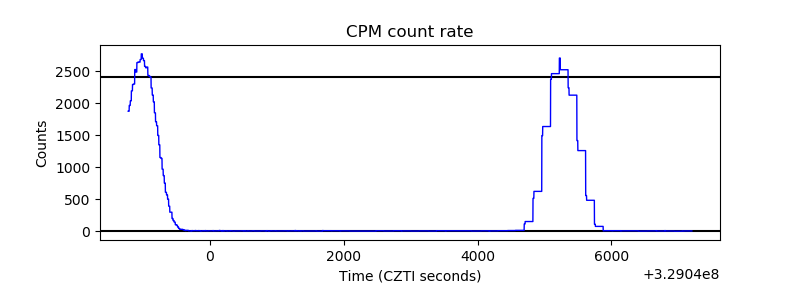 |
| CZT Counter |  |
| +2.5 Volts monitor |  |
| +5 Volts monitor | 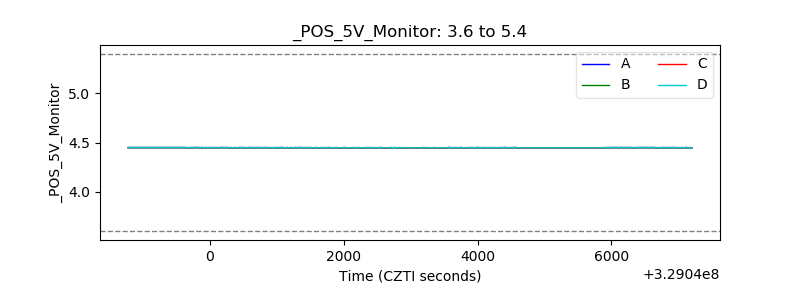 |
| _ROLL_ROT | 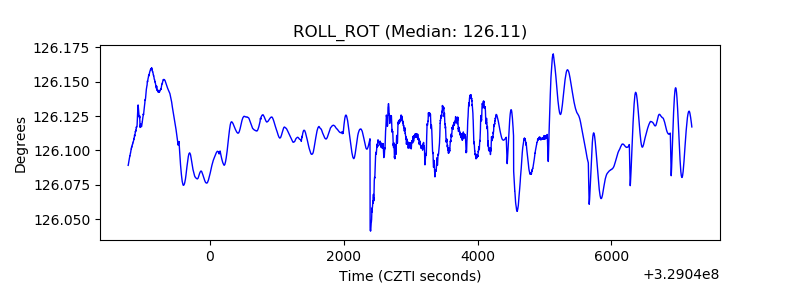 |
| _Roll_DEC | 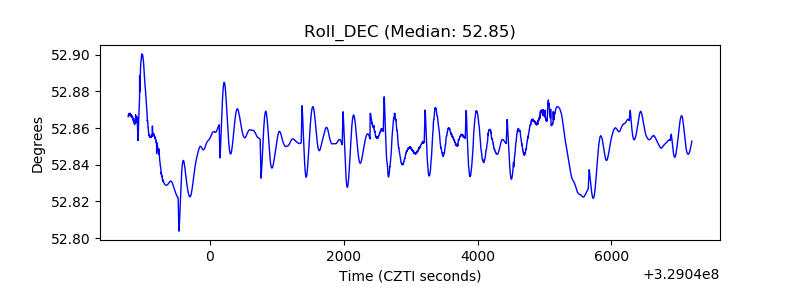 |
| _Roll_RA | 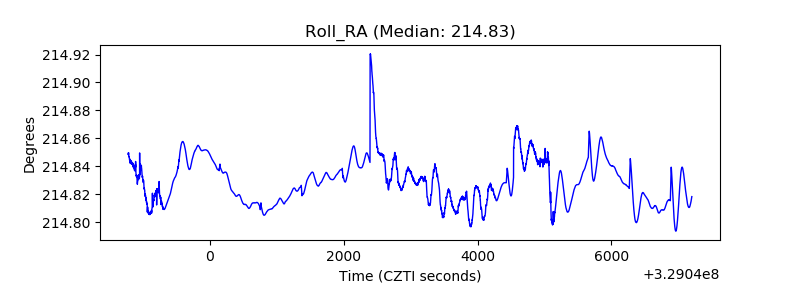 |
| Veto Counter | 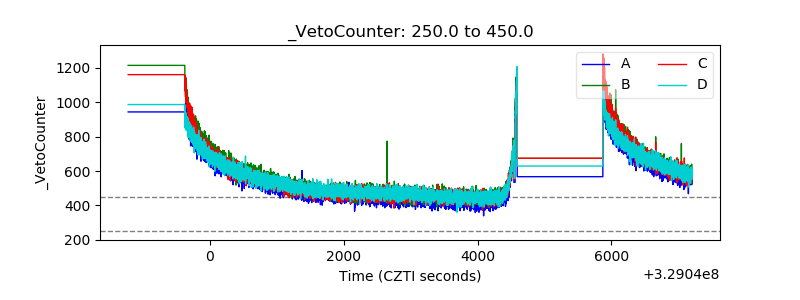 |