| Param | Original file | Final file |
|---|---|---|
| Filename | modeM0/AS1A09_059T01_9000003706_25345cztM0_level2.evt | modeM0/AS1A09_059T01_9000003706_25345cztM0_level2_quad_clean.evt |
| Size (bytes) | 521,493,120 | 114,883,200 |
| Size | 497.3 MB | 109.6 MB |
| Events in quadrant A | 3,695,104 | 784,064 |
| Events in quadrant B | 3,678,878 | 785,959 |
| Events in quadrant C | 3,861,362 | 730,115 |
| Events in quadrant D | 4,118,541 | 727,195 |
| Mode M0 | |||
|---|---|---|---|
| Quadrant | BADHDUFLAG | Total packets | Discarded packets |
| A | 0 | 15158 | 0 |
| B | 0 | 15031 | 0 |
| C | 0 | 15459 | 0 |
| D | 0 | 16678 | 0 |
| Mode M9 | |||
|---|---|---|---|
| Quadrant | BADHDUFLAG | Total packets | Discarded packets |
| A | 0 | 14 | 0 |
| B | 0 | 14 | 0 |
| C | 0 | 14 | 0 |
| D | 0 | 14 | 0 |
| Quadrant | Total seconds | Saturated seconds | Saturation percentage |
|---|---|---|---|
| A | 6489 | 108 | 1.664355% |
| B | 6490 | 122 | 1.879815% |
| C | 6489 | 222 | 3.421174% |
| D | 6489 | 122 | 1.880105% |
Noise dominated data is calculated using 1-second bins in cleaned event files. If a bin has >2000 counts, and if more than 50% of those come from <1% of pixels, then it is considered to be noise-dominated and hence unusable.
| Quadrant | # 1 sec bins | Bins with >0 counts | Bins with >2000 counts | High rate bins dominated by noise | Noise dominated (total time) | Noise dominated (detector-on time) | Marked lightcurve |
|---|---|---|---|---|---|---|---|
| A | 7824 | 6489 | 0 | 0 | 0.00% | 0.00% | 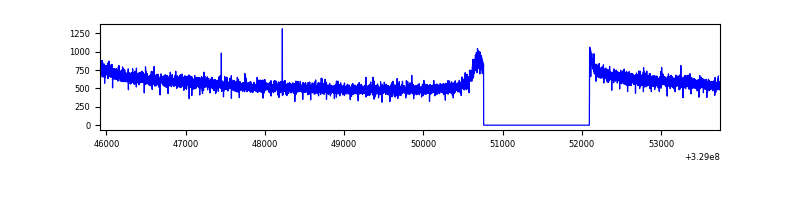 |
| B | 7825 | 6490 | 0 | 0 | 0.00% | 0.00% | 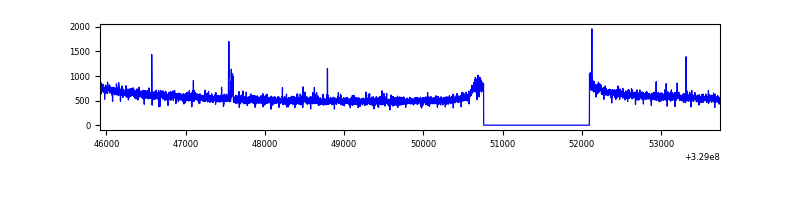 |
| C | 7824 | 6490 | 20 | 20 | 0.26% | 0.31% | 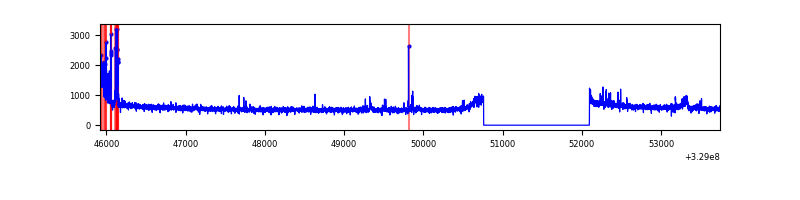 |
| D | 7824 | 6489 | 26 | 26 | 0.33% | 0.40% | 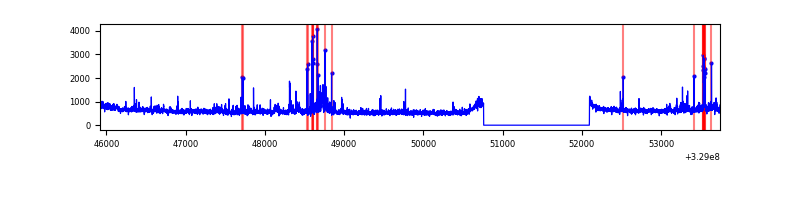 |
Top three noisy pixels from each quadrant. If the there are fewer than three noisy pixels in the level2.evt file, extra rows are filled as -1
| Pixel properties | Quadrant properties | ||||||
|---|---|---|---|---|---|---|---|
| Quadrant | DetID | PixID | Counts | Sigma | Mean | Median | Sigma |
| A | 13 | 254 | 9563 | 46.27 | 957 | 943 | 186.3 |
| A | 0 | 226 | 8440 | 40.24 | 957 | 943 | 186.3 |
| A | 3 | 137 | 7609 | 35.78 | 957 | 943 | 186.3 |
| B | 0 | 190 | 25240 | 143.22 | 931 | 911 | 169.9 |
| B | 12 | 111 | 19480 | 109.31 | 931 | 911 | 169.9 |
| B | 11 | 111 | 17815 | 99.51 | 931 | 911 | 169.9 |
| C | 9 | 54 | 233944 | 1143.02 | 888 | 895 | 203.9 |
| C | 14 | 238 | 146610 | 714.68 | 888 | 895 | 203.9 |
| C | 3 | 233 | 18553 | 86.61 | 888 | 895 | 203.9 |
| D | 8 | 195 | 215708 | 973.09 | 921 | 897 | 220.8 |
| D | 12 | 235 | 174297 | 785.5 | 921 | 897 | 220.8 |
| D | 12 | 233 | 123029 | 553.26 | 921 | 897 | 220.8 |
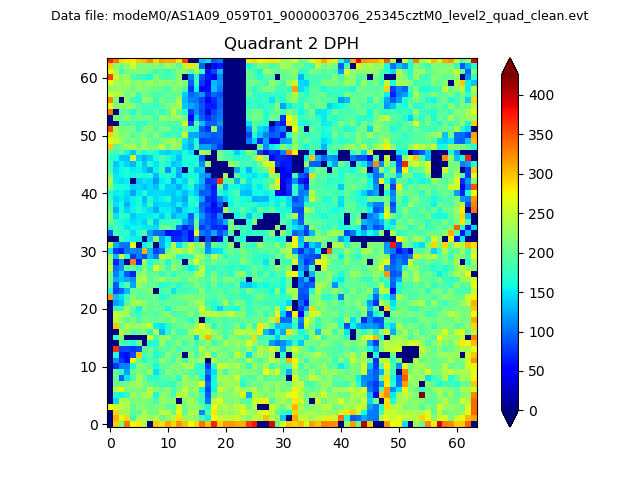
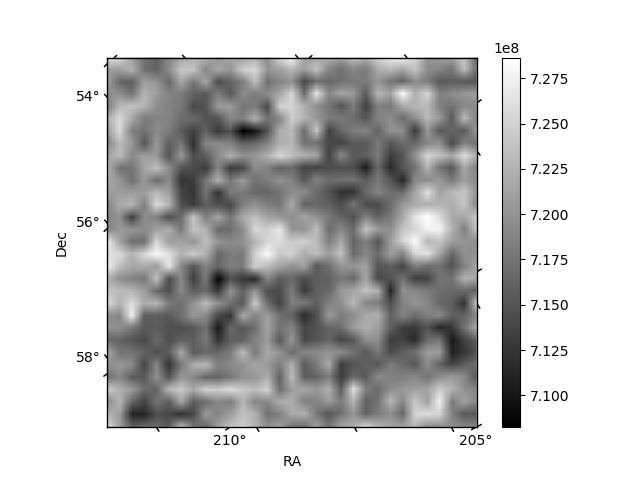
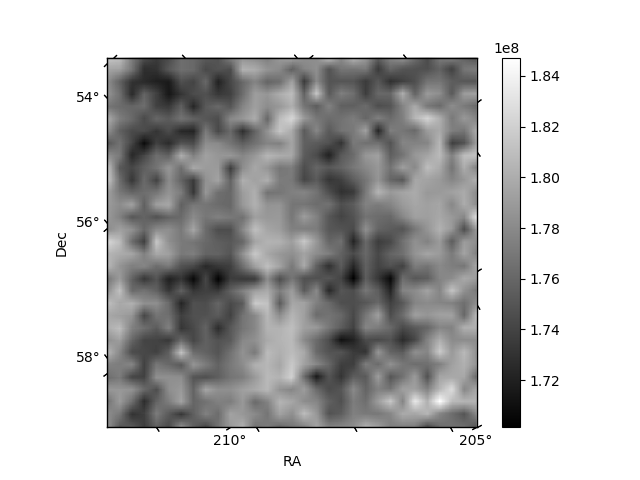
Histogram calculated using DETX and DETY for each event in the final _common_clean file
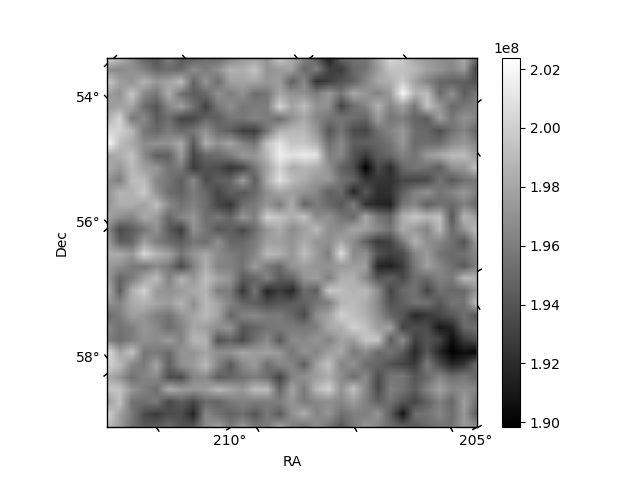
| Quadrant A | 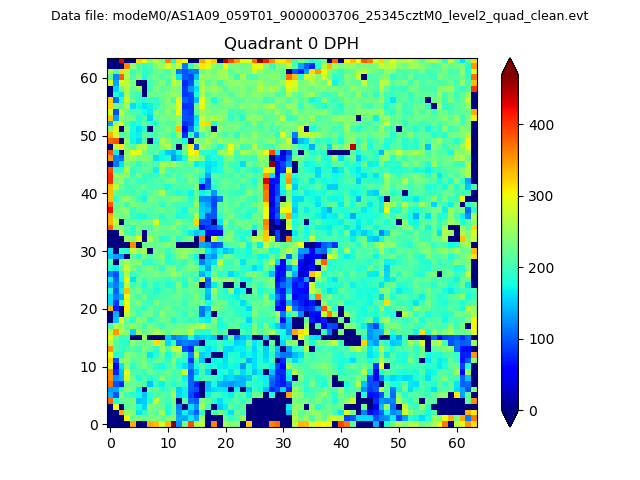 |
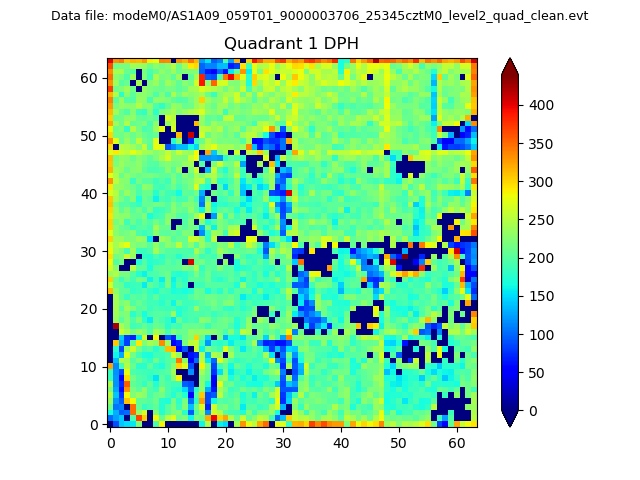 |
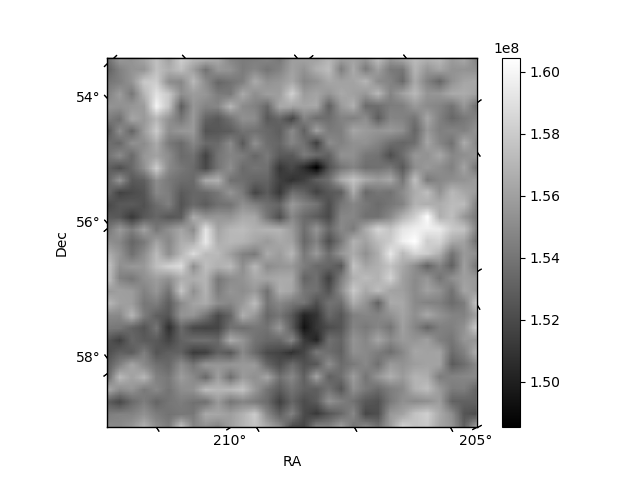
Quadrant B |
|---|---|---|---|
| Quadrant D | 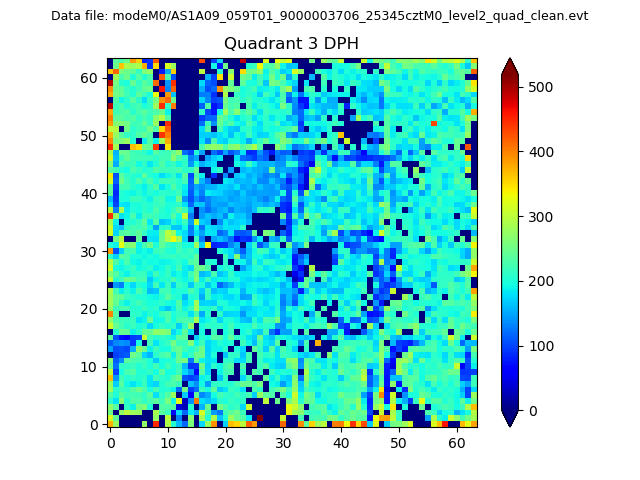 |
 |
Quadrant C |
| Plot type | Count rate plots | Images |
|---|---|---|
| Comparison with Poisson distribution Blue bars denote a histogram of data divided into 1 sec bins. Red curve is a Poisson curve with rate = median count rate of data. |
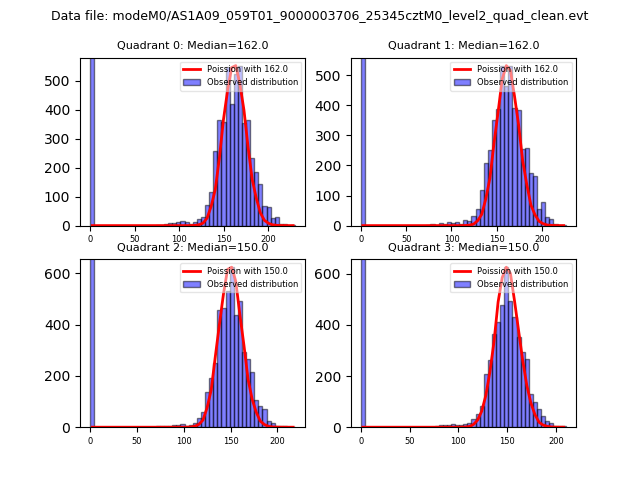 |
 |
| Quadrant-wise count rates Data is divided into 100 sec bins |
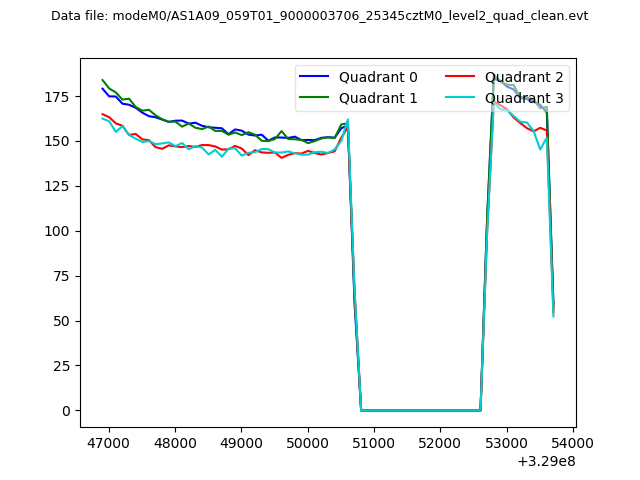 |
|
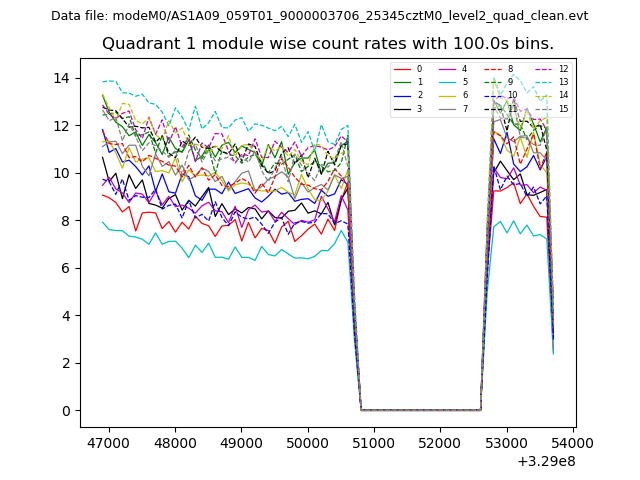
| Module-wise count rates for Quadrant A Data is divided into 100 sec bins |
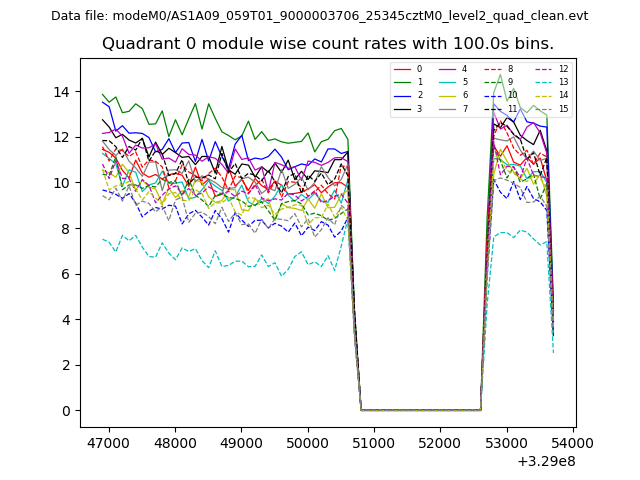 |
 |
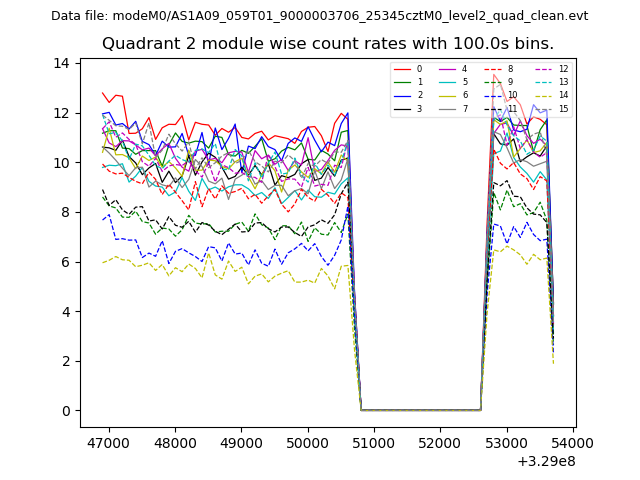
| Module-wise count rates for Quadrant B Data is divided into 100 sec bins |
 |
 |
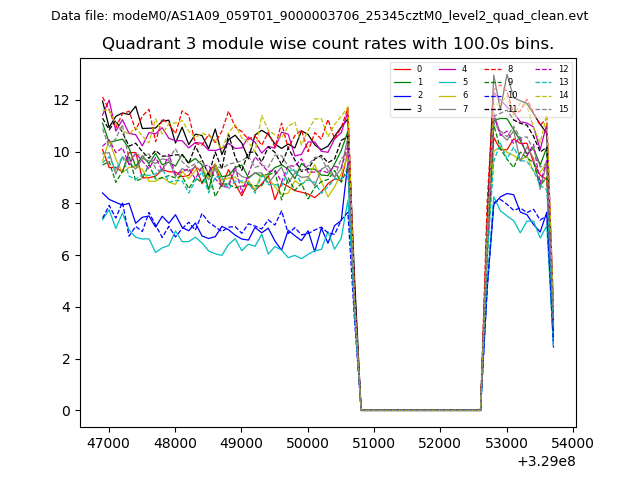
| Module-wise count rates for Quadrant C Data is divided into 100 sec bins |
 |
 |
| Module-wise count rates for Quadrant D Data is divided into 100 sec bins |
 |
 |
| Parameter | Plot |
|---|---|
| CZT HV Monitor | 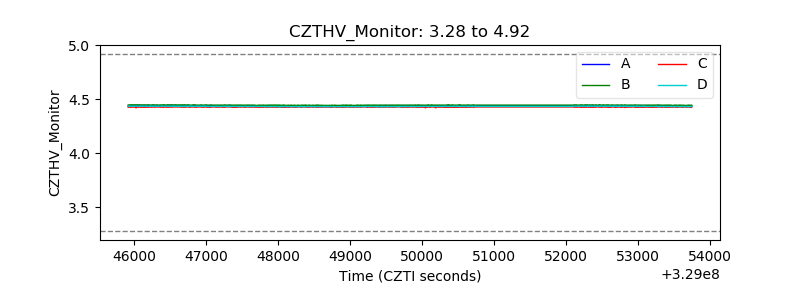 |
| D_VDD | 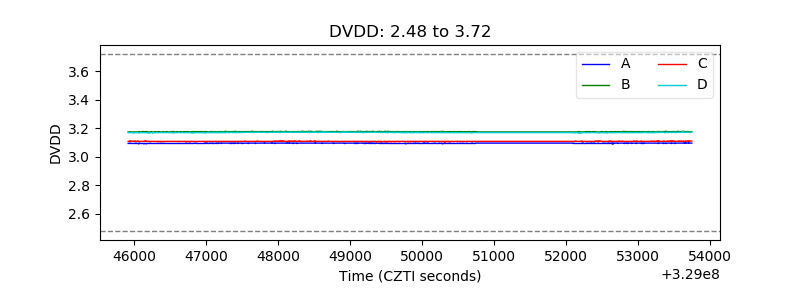 |
| Temperature 1 | 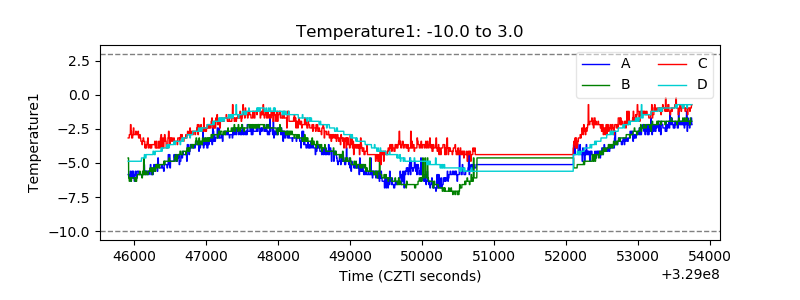 |
| Veto HV Monitor | 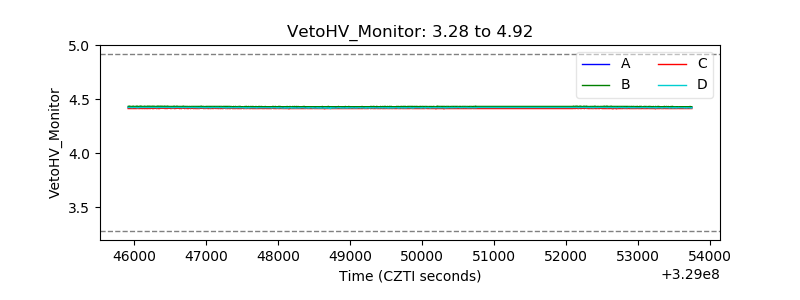 |
| Veto LLD | 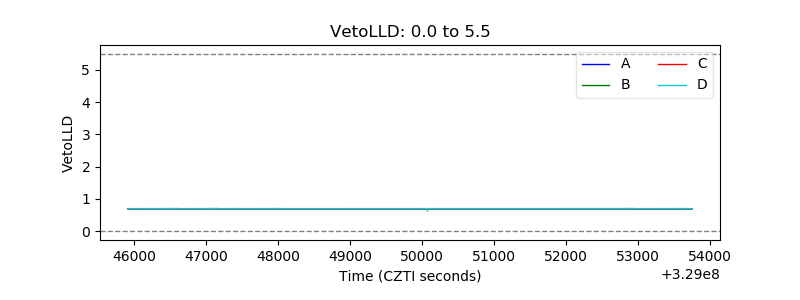 |
| Alpha Counter | 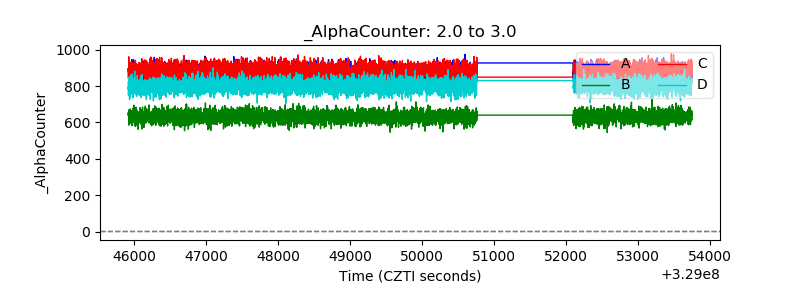 |
| _CPM_Rate | 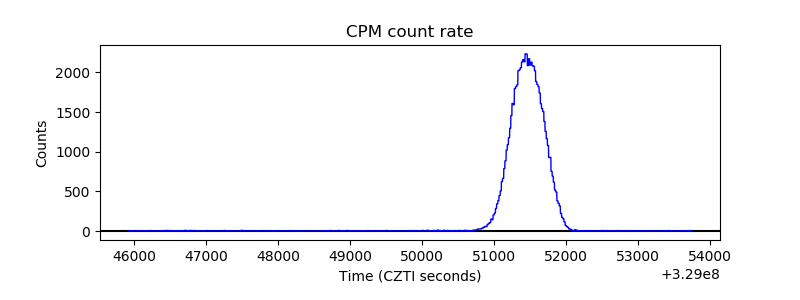 |
| CZT Counter | 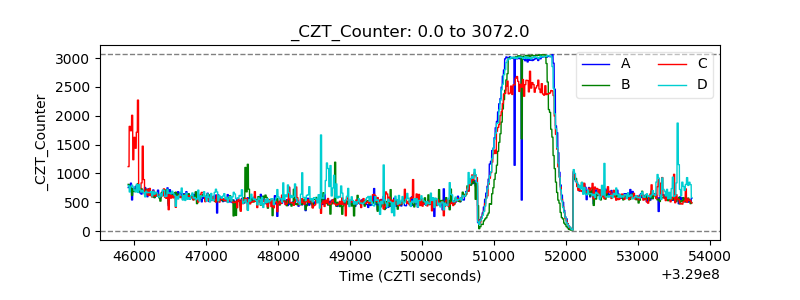 |
| +2.5 Volts monitor | 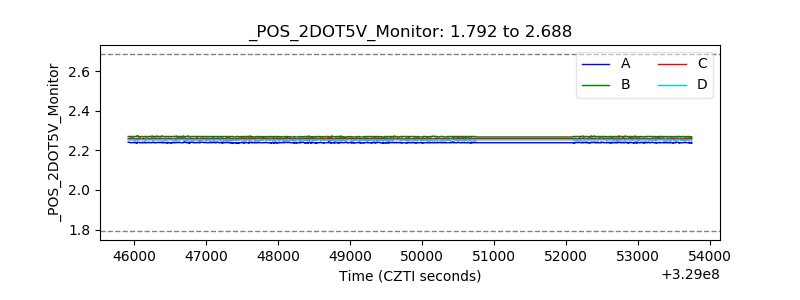 |
| +5 Volts monitor |  |
| _ROLL_ROT | 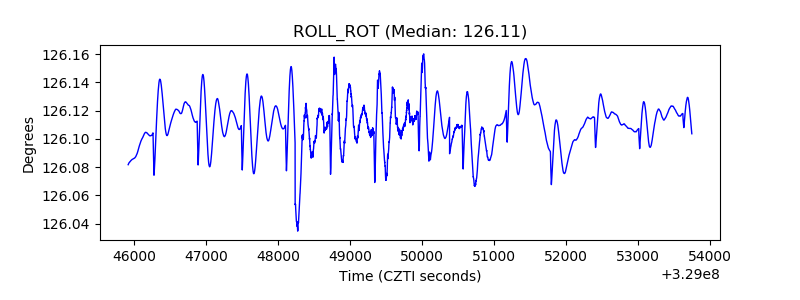 |
| _Roll_DEC |  |
| _Roll_RA | 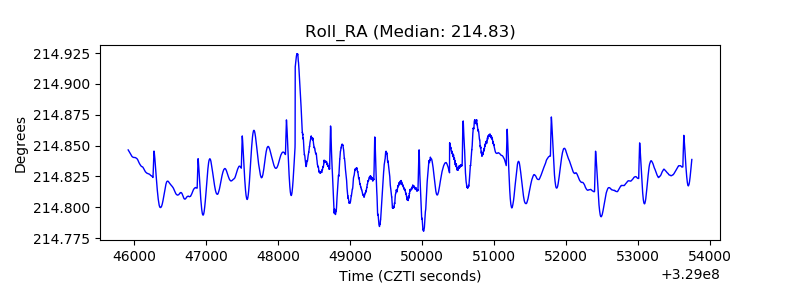 |
| Veto Counter | 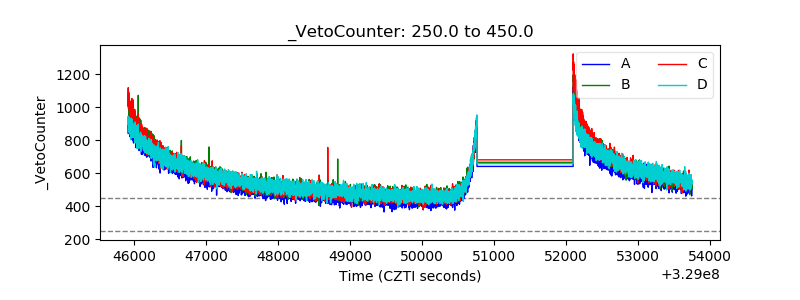 |