| Param | Original file | Final file |
|---|---|---|
| Filename | modeM0/AS1A09_059T01_9000003706_25346cztM0_level2.evt | modeM0/AS1A09_059T01_9000003706_25346cztM0_level2_quad_clean.evt |
| Size (bytes) | 519,048,000 | 123,160,320 |
| Size | 495.0 MB | 117.5 MB |
| Events in quadrant A | 3,555,379 | 853,199 |
| Events in quadrant B | 3,788,595 | 841,910 |
| Events in quadrant C | 3,798,502 | 798,181 |
| Events in quadrant D | 4,144,983 | 792,506 |
| Mode M0 | |||
|---|---|---|---|
| Quadrant | BADHDUFLAG | Total packets | Discarded packets |
| A | 0 | 14555 | 0 |
| B | 0 | 15185 | 0 |
| C | 0 | 15158 | 0 |
| D | 0 | 16825 | 0 |
| Mode M9 | |||
|---|---|---|---|
| Quadrant | BADHDUFLAG | Total packets | Discarded packets |
| A | 0 | 13 | 0 |
| B | 0 | 13 | 0 |
| C | 0 | 13 | 0 |
| D | 0 | 13 | 0 |
| Quadrant | Total seconds | Saturated seconds | Saturation percentage |
|---|---|---|---|
| A | 6369 | 107 | 1.680013% |
| B | 6369 | 261 | 4.097975% |
| C | 6369 | 215 | 3.375726% |
| D | 6369 | 126 | 1.978333% |
Noise dominated data is calculated using 1-second bins in cleaned event files. If a bin has >2000 counts, and if more than 50% of those come from <1% of pixels, then it is considered to be noise-dominated and hence unusable.
| Quadrant | # 1 sec bins | Bins with >0 counts | Bins with >2000 counts | High rate bins dominated by noise | Noise dominated (total time) | Noise dominated (detector-on time) | Marked lightcurve |
|---|---|---|---|---|---|---|---|
| A | 7699 | 6369 | 0 | 0 | 0.00% | 0.00% | 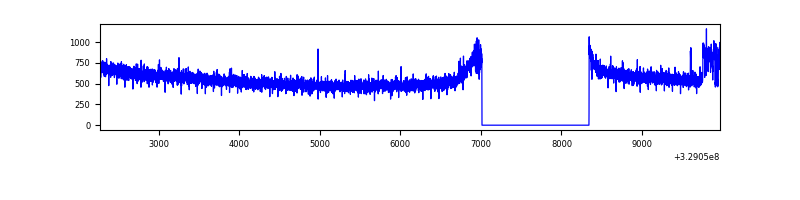 |
| B | 7699 | 6370 | 104 | 104 | 1.35% | 1.63% | 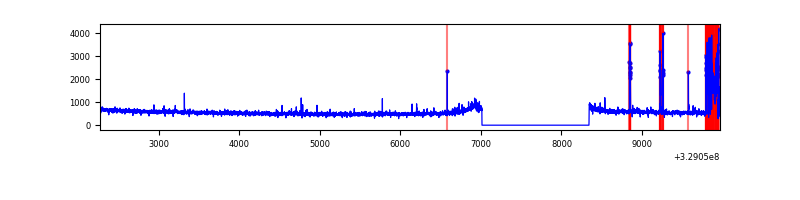 |
| C | 7699 | 6369 | 51 | 51 | 0.66% | 0.80% | 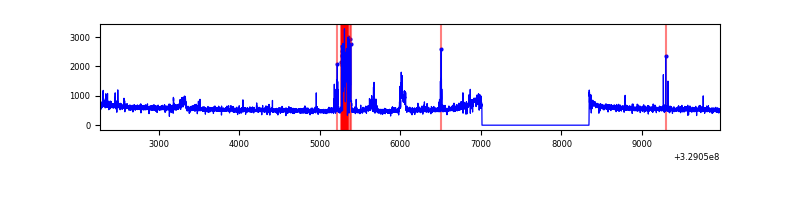 |
| D | 7699 | 6369 | 38 | 38 | 0.49% | 0.60% | 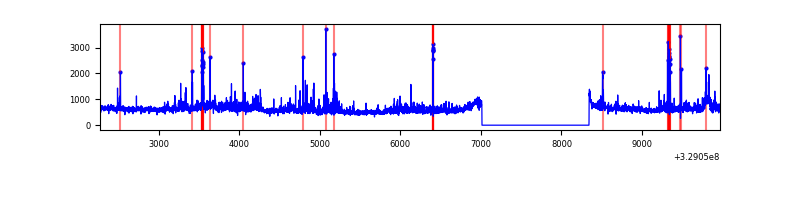 |
Top three noisy pixels from each quadrant. If the there are fewer than three noisy pixels in the level2.evt file, extra rows are filled as -1
| Pixel properties | Quadrant properties | ||||||
|---|---|---|---|---|---|---|---|
| Quadrant | DetID | PixID | Counts | Sigma | Mean | Median | Sigma |
| A | 15 | 173 | 67775 | 375.4 | 905 | 890 | 178.2 |
| A | 13 | 254 | 9841 | 50.24 | 905 | 890 | 178.2 |
| A | 0 | 226 | 7990 | 39.85 | 905 | 890 | 178.2 |
| B | 3 | 112 | 360985 | 2255.32 | 872 | 855 | 159.7 |
| B | 12 | 111 | 18619 | 111.25 | 872 | 855 | 159.7 |
| B | 11 | 111 | 16757 | 99.59 | 872 | 855 | 159.7 |
| C | 9 | 54 | 330539 | 1697.91 | 847 | 856 | 194.2 |
| C | 14 | 238 | 139804 | 715.6 | 847 | 856 | 194.2 |
| C | 3 | 233 | 14865 | 72.15 | 847 | 856 | 194.2 |
| D | 8 | 195 | 315877 | 1511.86 | 875 | 855 | 208.4 |
| D | 12 | 235 | 179052 | 855.2 | 875 | 855 | 208.4 |
| D | 12 | 233 | 172715 | 824.79 | 875 | 855 | 208.4 |
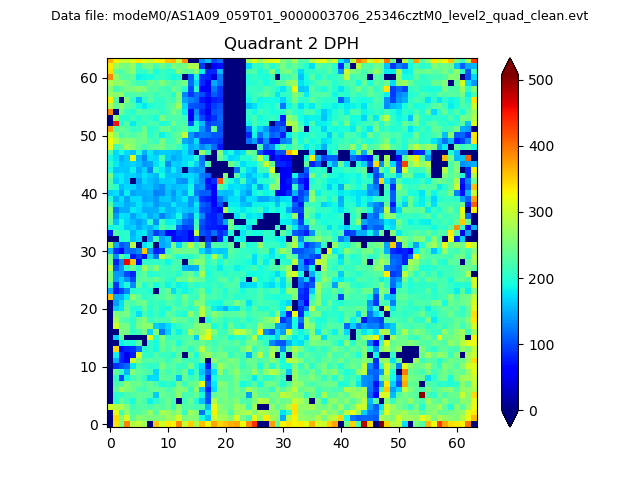
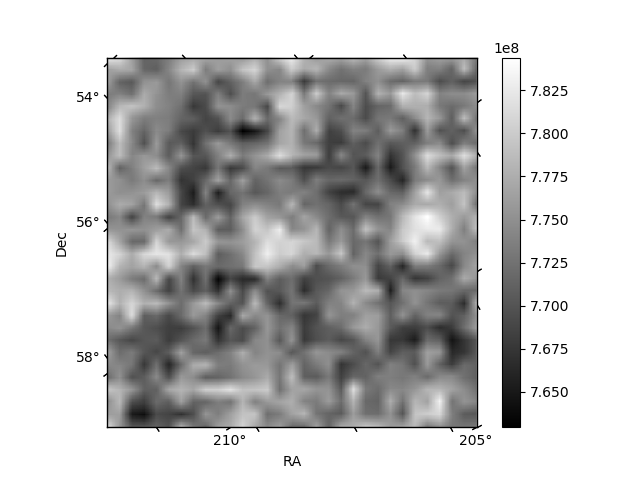
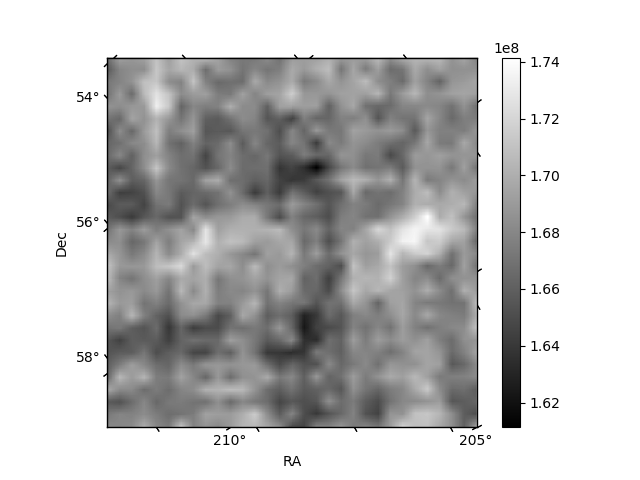
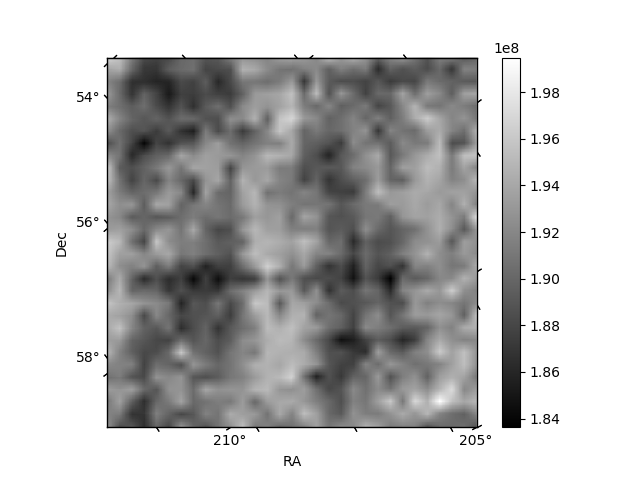
Histogram calculated using DETX and DETY for each event in the final _common_clean file
| Quadrant A | 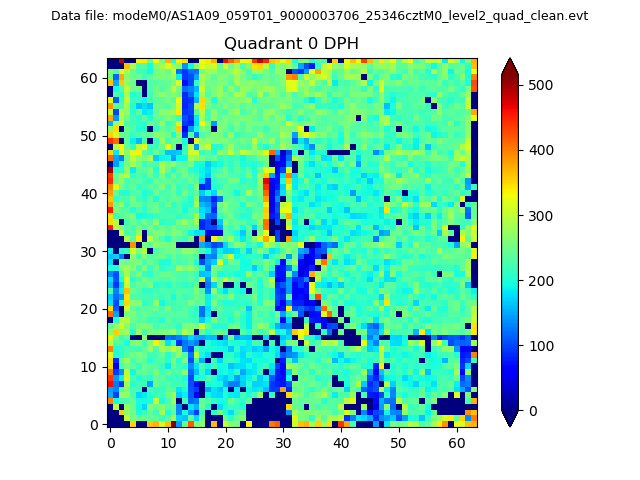 |
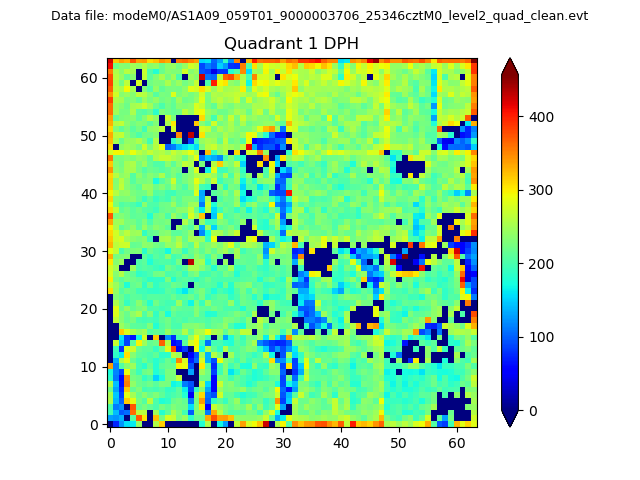 |
Quadrant B |
|---|---|---|---|
| Quadrant D | 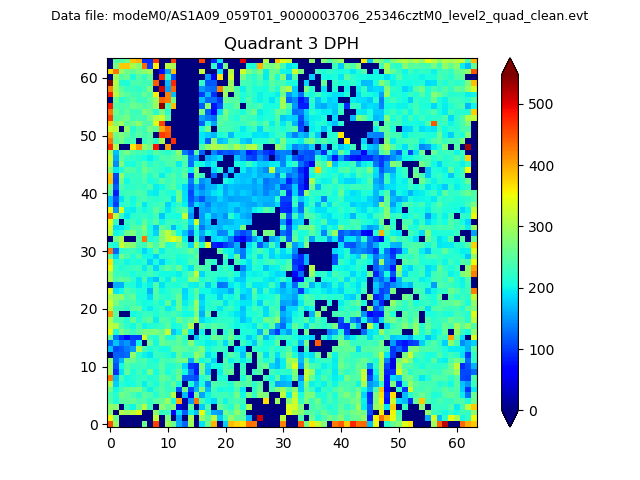 |
 |
Quadrant C |
| Plot type | Count rate plots | Images |
|---|---|---|
| Comparison with Poisson distribution Blue bars denote a histogram of data divided into 1 sec bins. Red curve is a Poisson curve with rate = median count rate of data. |
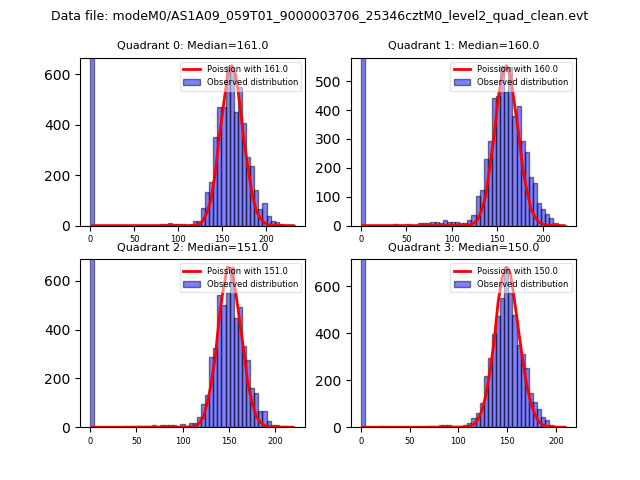 |
 |
| Quadrant-wise count rates Data is divided into 100 sec bins |
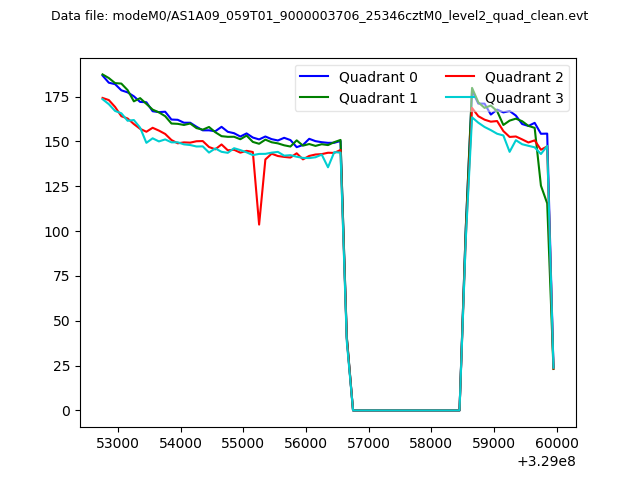 |
|
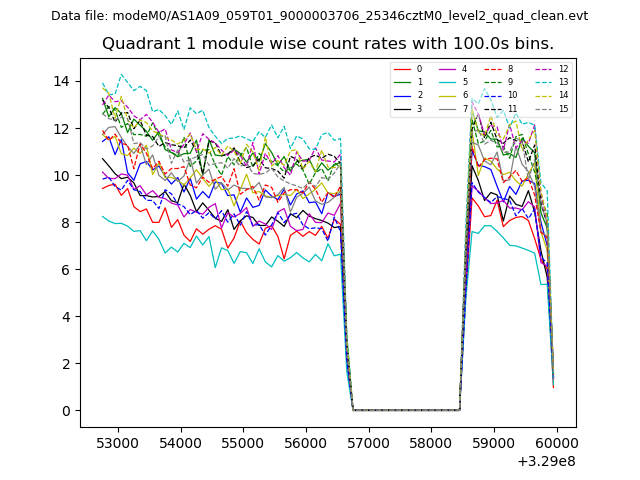
| Module-wise count rates for Quadrant A Data is divided into 100 sec bins |
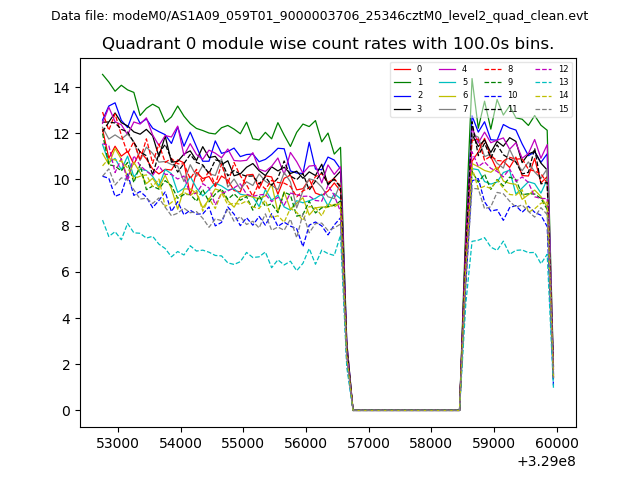 |
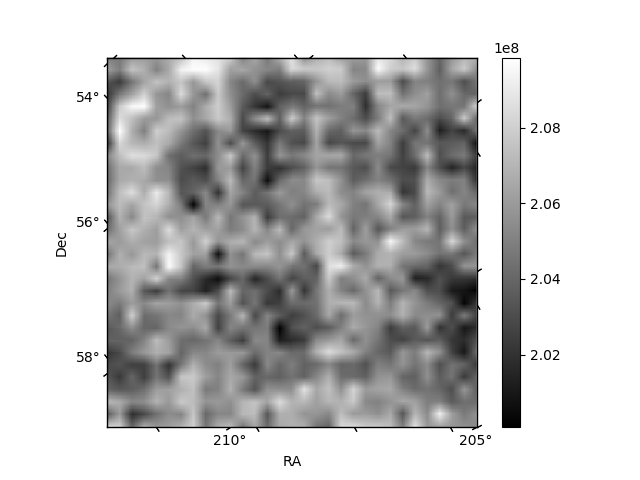 |
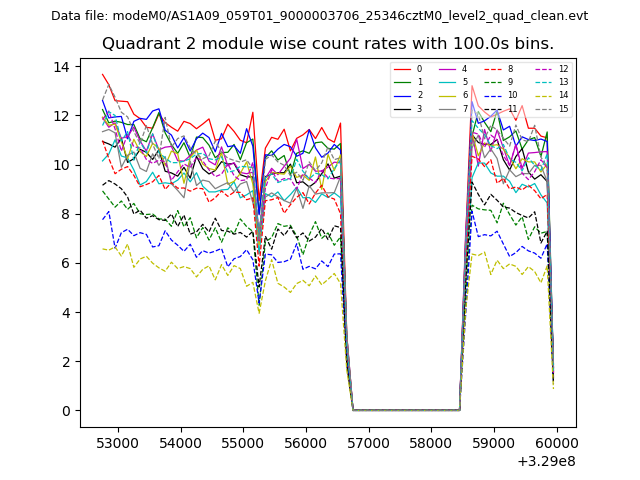
| Module-wise count rates for Quadrant B Data is divided into 100 sec bins |
 |
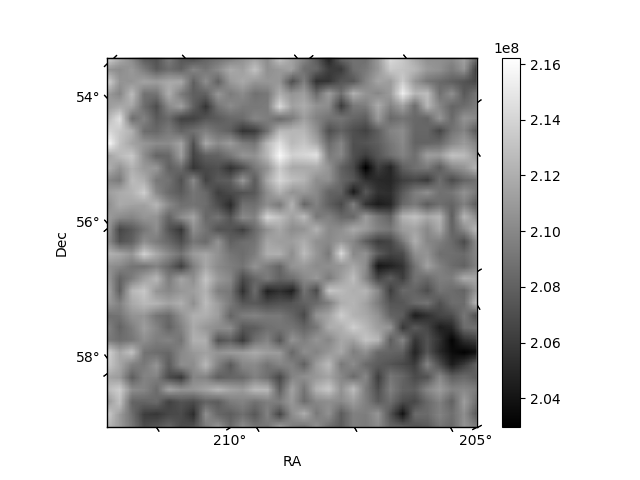 |
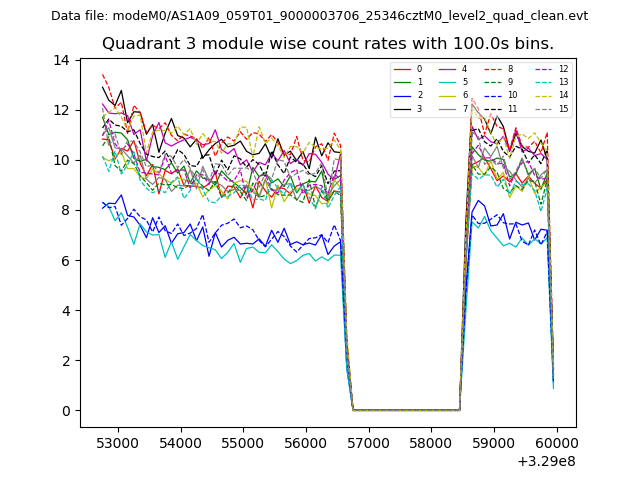
| Module-wise count rates for Quadrant C Data is divided into 100 sec bins |
 |
 |
| Module-wise count rates for Quadrant D Data is divided into 100 sec bins |
 |
 |
| Parameter | Plot |
|---|---|
| CZT HV Monitor | 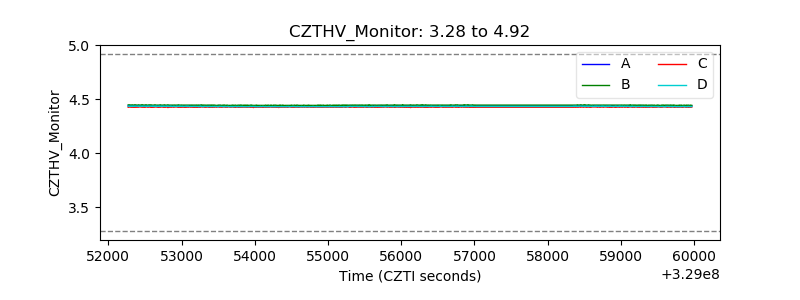 |
| D_VDD | 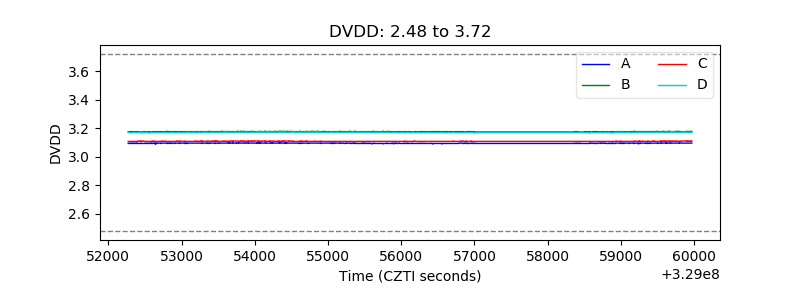 |
| Temperature 1 | 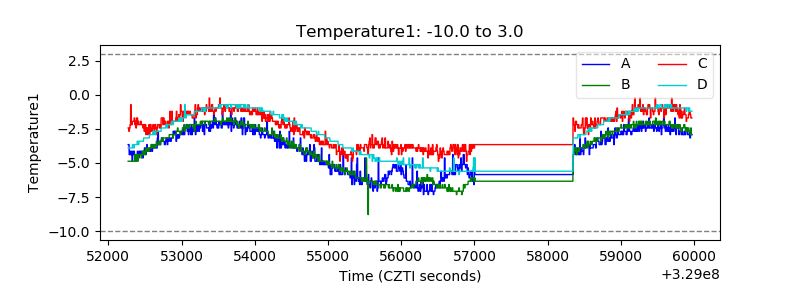 |
| Veto HV Monitor | 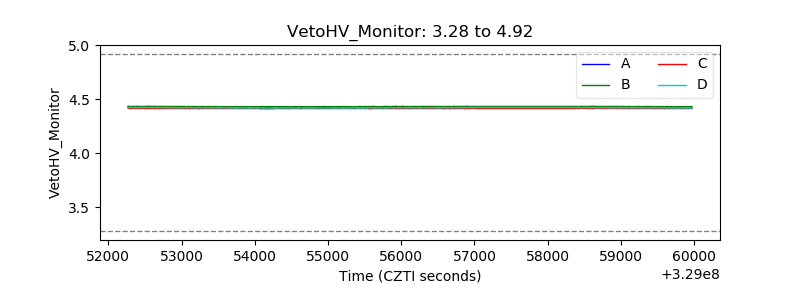 |
| Veto LLD | 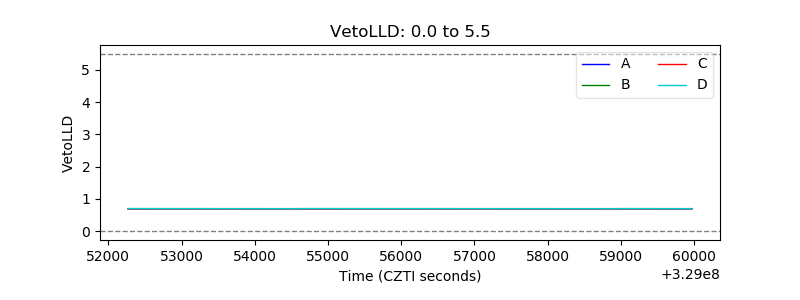 |
| Alpha Counter | 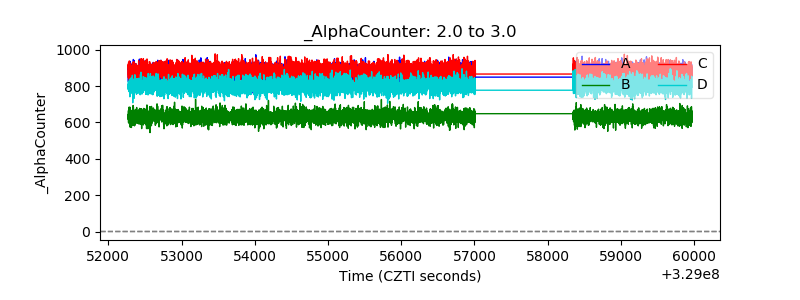 |
| _CPM_Rate | 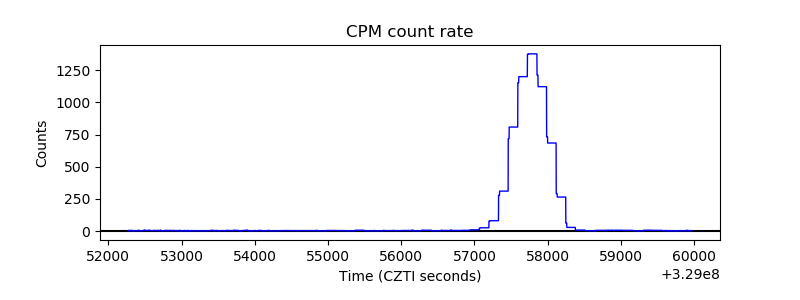 |
| CZT Counter | 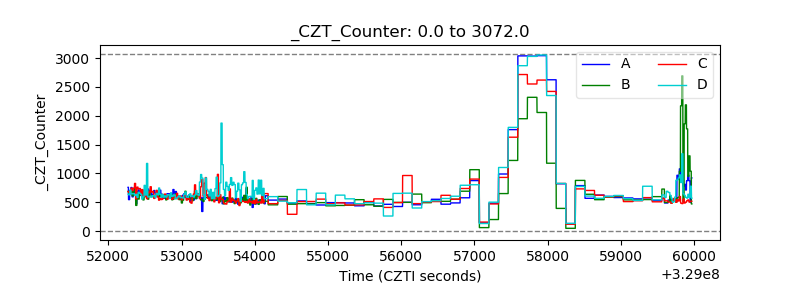 |
| +2.5 Volts monitor |  |
| +5 Volts monitor |  |
| _ROLL_ROT | 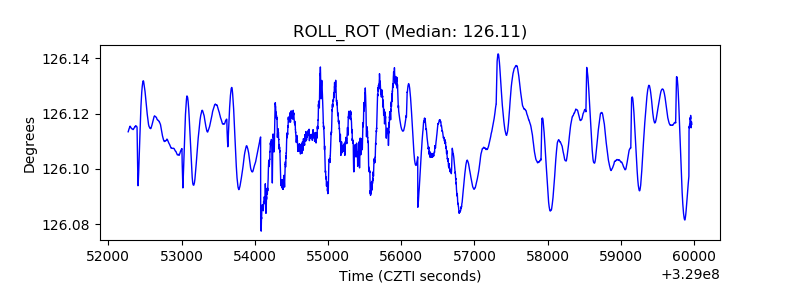 |
| _Roll_DEC | 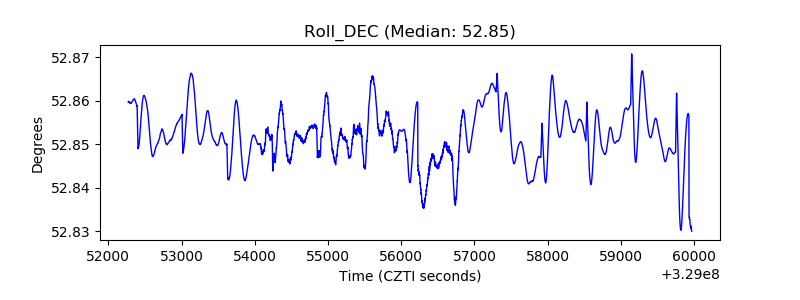 |
| _Roll_RA | 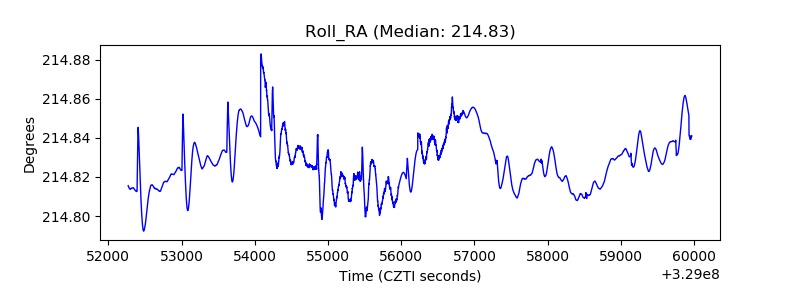 |
| Veto Counter | 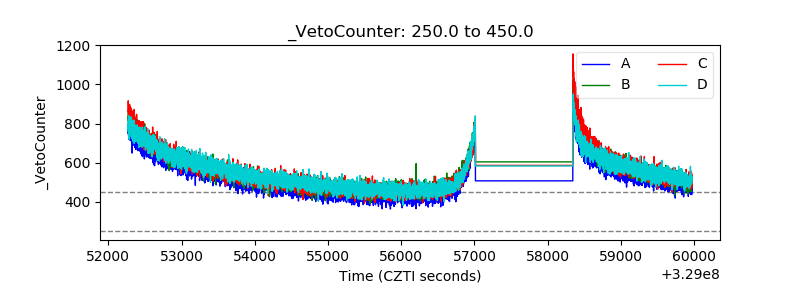 |