| Param | Original file | Final file |
|---|---|---|
| Filename | modeM0/AS1A09_059T01_9000003706_25347cztM0_level2.evt | modeM0/AS1A09_059T01_9000003706_25347cztM0_level2_quad_clean.evt |
| Size (bytes) | 505,108,800 | 118,313,280 |
| Size | 481.7 MB | 112.8 MB |
| Events in quadrant A | 3,754,010 | 811,314 |
| Events in quadrant B | 3,619,773 | 803,670 |
| Events in quadrant C | 3,447,894 | 771,475 |
| Events in quadrant D | 4,051,010 | 760,130 |
| Mode M0 | |||
|---|---|---|---|
| Quadrant | BADHDUFLAG | Total packets | Discarded packets |
| A | 0 | 15440 | 0 |
| B | 0 | 14569 | 0 |
| C | 0 | 13939 | 0 |
| D | 0 | 16263 | 0 |
| Mode M9 | |||
|---|---|---|---|
| Quadrant | BADHDUFLAG | Total packets | Discarded packets |
| A | 0 | 12 | 0 |
| B | 0 | 12 | 0 |
| C | 0 | 12 | 0 |
| D | 0 | 12 | 0 |
| Quadrant | Total seconds | Saturated seconds | Saturation percentage |
|---|---|---|---|
| A | 6264 | 97 | 1.548531% |
| B | 6264 | 255 | 4.070881% |
| C | 6264 | 152 | 2.426564% |
| D | 6264 | 134 | 2.139208% |
Noise dominated data is calculated using 1-second bins in cleaned event files. If a bin has >2000 counts, and if more than 50% of those come from <1% of pixels, then it is considered to be noise-dominated and hence unusable.
| Quadrant | # 1 sec bins | Bins with >0 counts | Bins with >2000 counts | High rate bins dominated by noise | Noise dominated (total time) | Noise dominated (detector-on time) | Marked lightcurve |
|---|---|---|---|---|---|---|---|
| A | 7429 | 6265 | 0 | 0 | 0.00% | 0.00% | 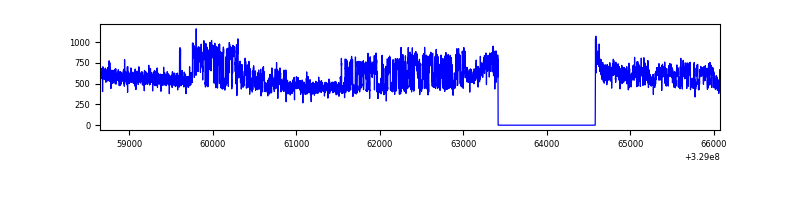 |
| B | 7429 | 6265 | 105 | 105 | 1.41% | 1.68% | 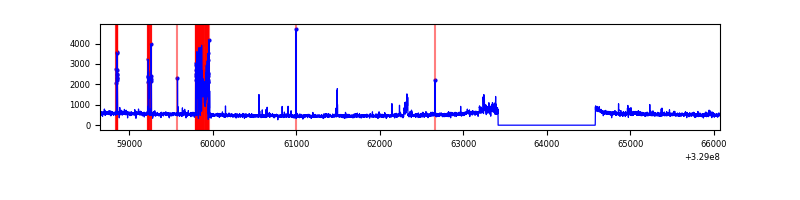 |
| C | 7429 | 6265 | 12 | 12 | 0.16% | 0.19% | 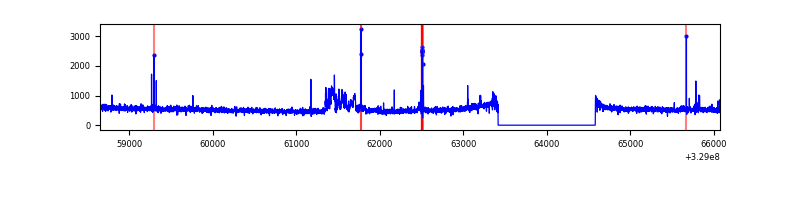 |
| D | 7429 | 6265 | 50 | 50 | 0.67% | 0.80% | 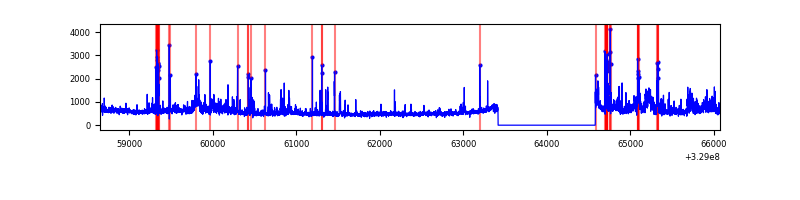 |
Top three noisy pixels from each quadrant. If the there are fewer than three noisy pixels in the level2.evt file, extra rows are filled as -1
| Pixel properties | Quadrant properties | ||||||
|---|---|---|---|---|---|---|---|
| Quadrant | DetID | PixID | Counts | Sigma | Mean | Median | Sigma |
| A | 15 | 173 | 554465 | 3357.46 | 830 | 814 | 164.9 |
| A | 13 | 254 | 9407 | 52.11 | 830 | 814 | 164.9 |
| A | 3 | 137 | 7146 | 38.4 | 830 | 814 | 164.9 |
| B | 3 | 112 | 435399 | 2876.77 | 806 | 788 | 151.1 |
| B | 12 | 111 | 17860 | 113.0 | 806 | 788 | 151.1 |
| B | 11 | 111 | 15849 | 99.69 | 806 | 788 | 151.1 |
| C | 9 | 54 | 214906 | 1174.84 | 791 | 797 | 182.2 |
| C | 14 | 238 | 127508 | 695.28 | 791 | 797 | 182.2 |
| C | 0 | 207 | 14837 | 77.04 | 791 | 797 | 182.2 |
| D | 8 | 195 | 510856 | 2660.42 | 808 | 787 | 191.7 |
| D | 7 | 238 | 129092 | 669.21 | 808 | 787 | 191.7 |
| D | 12 | 233 | 123969 | 642.49 | 808 | 787 | 191.7 |
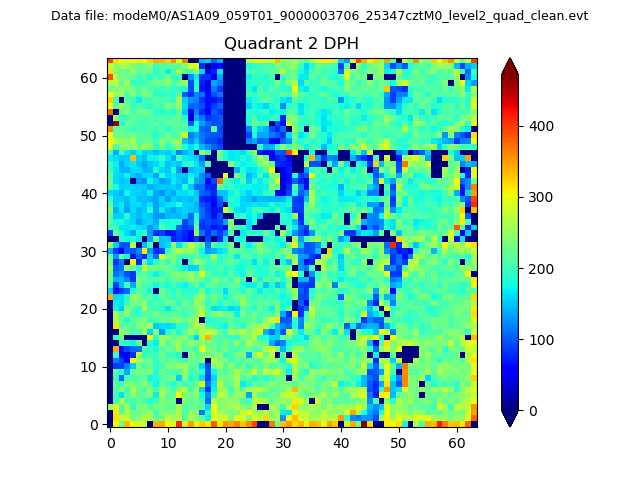
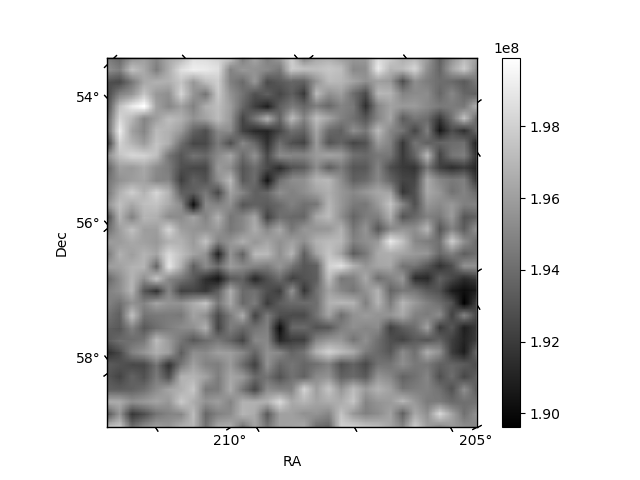
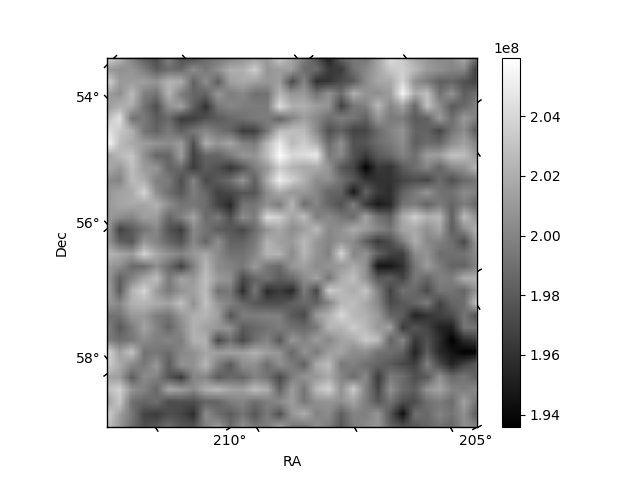
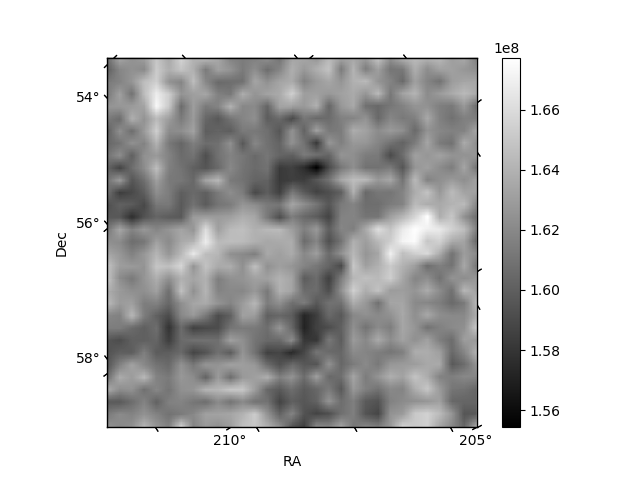
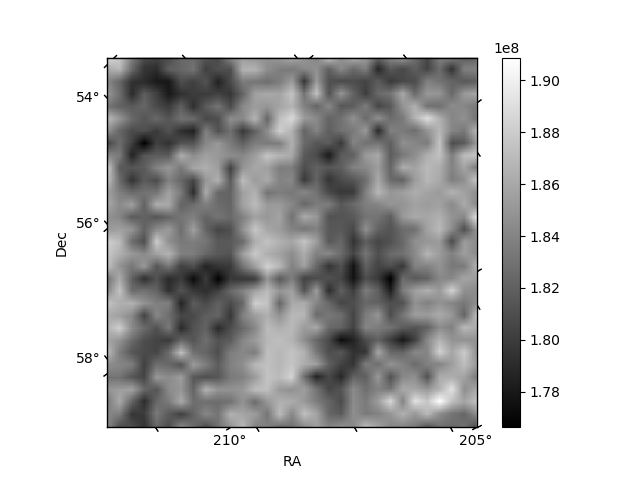
Histogram calculated using DETX and DETY for each event in the final _common_clean file
| Quadrant A | 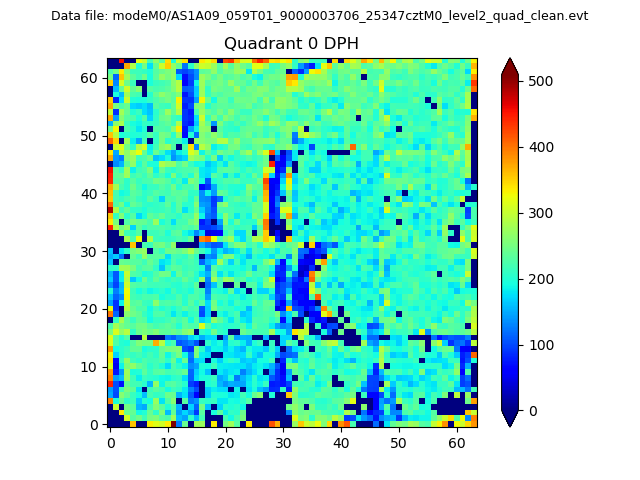 |
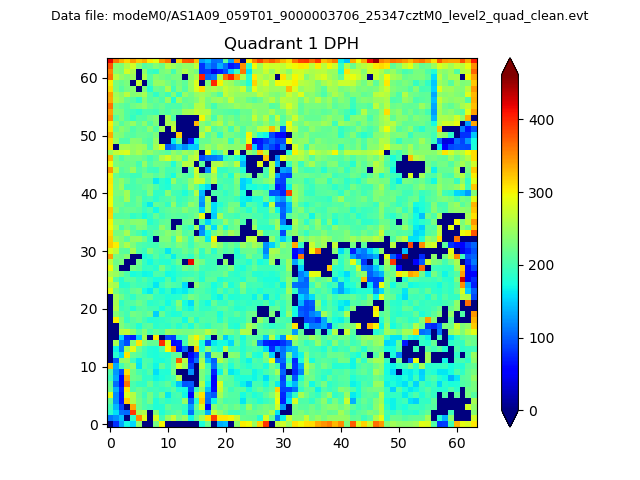 |
Quadrant B |
|---|---|---|---|
| Quadrant D | 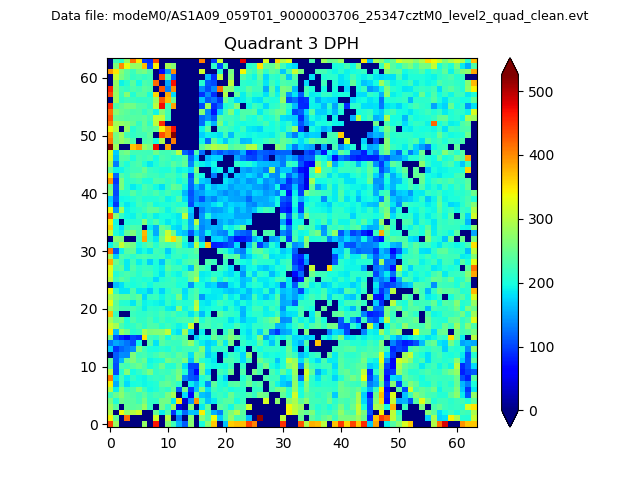 |
 |
Quadrant C |
| Plot type | Count rate plots | Images |
|---|---|---|
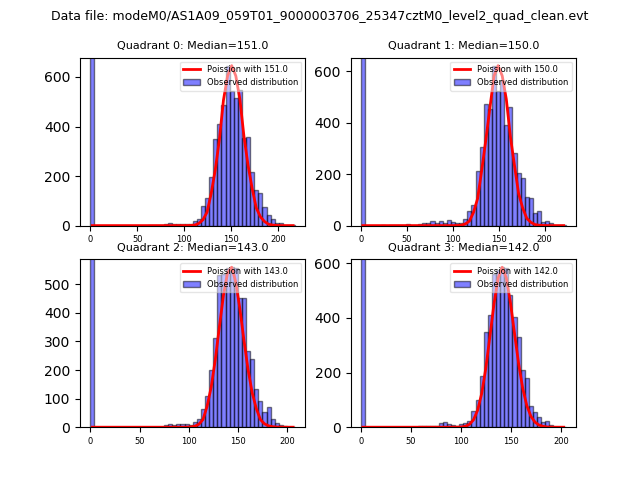
| Comparison with Poisson distribution Blue bars denote a histogram of data divided into 1 sec bins. Red curve is a Poisson curve with rate = median count rate of data. |
 |
 |
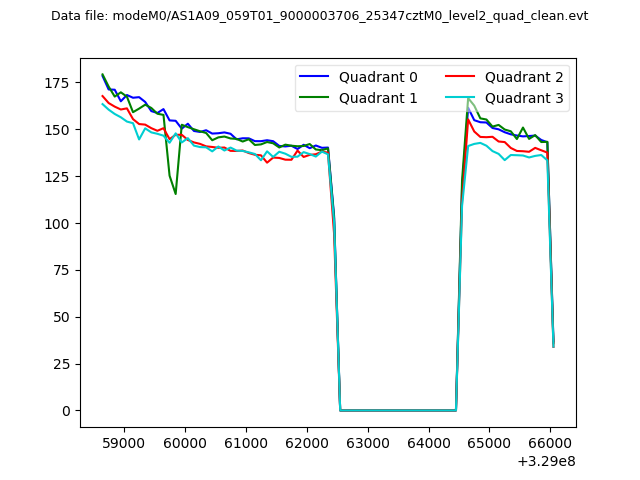
| Quadrant-wise count rates Data is divided into 100 sec bins |
 |
|
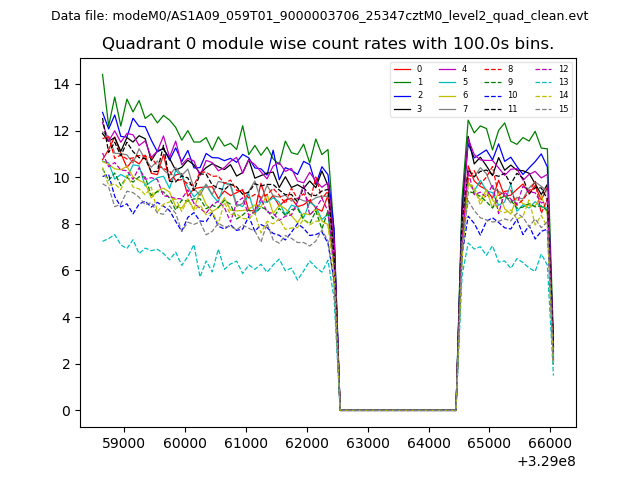
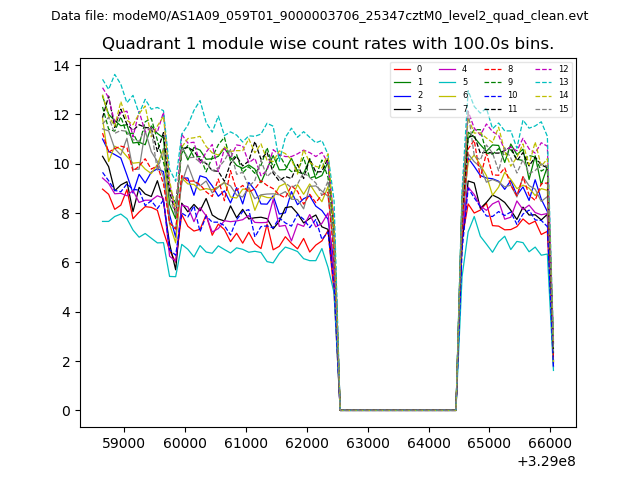
| Module-wise count rates for Quadrant A Data is divided into 100 sec bins |
 |
 |
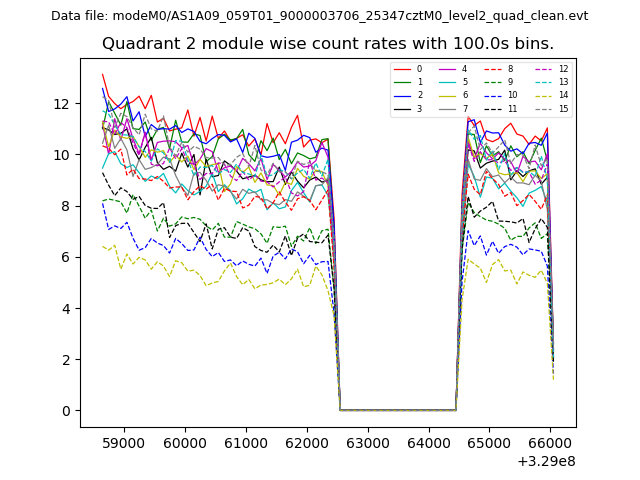
| Module-wise count rates for Quadrant B Data is divided into 100 sec bins |
 |
 |
| Module-wise count rates for Quadrant C Data is divided into 100 sec bins |
 |
 |
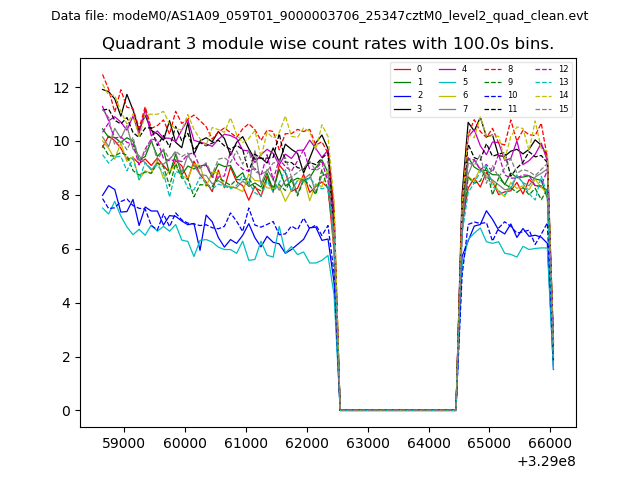
| Module-wise count rates for Quadrant D Data is divided into 100 sec bins |
 |
 |
| Parameter | Plot |
|---|---|
| CZT HV Monitor | 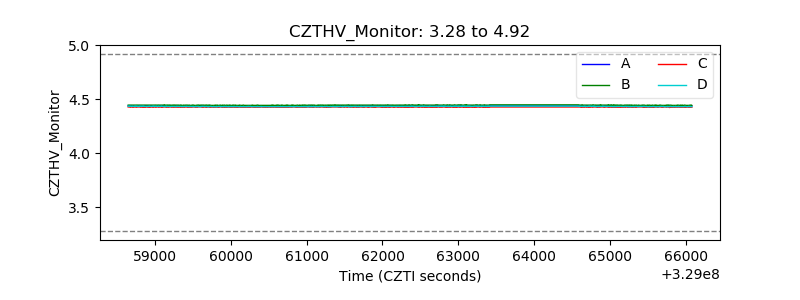 |
| D_VDD | 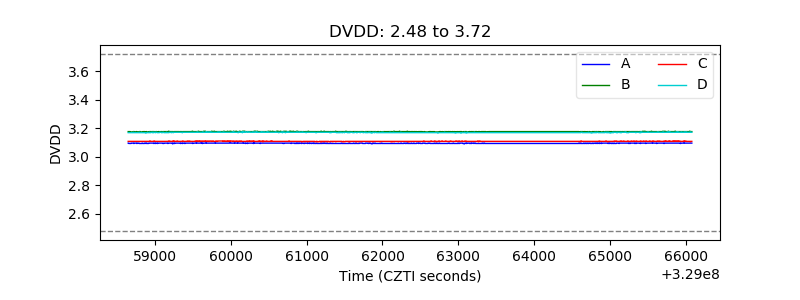 |
| Temperature 1 | 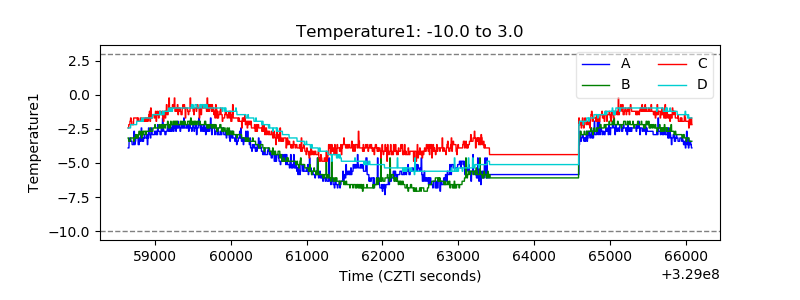 |
| Veto HV Monitor | 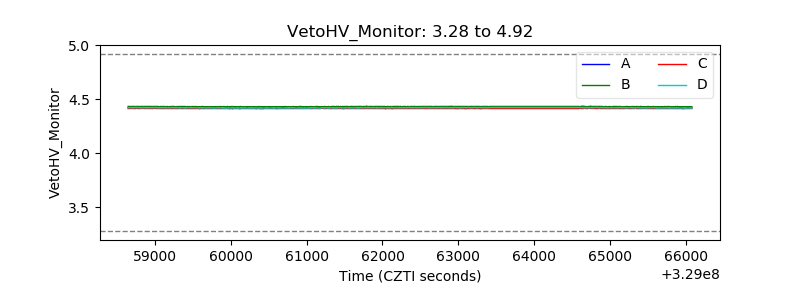 |
| Veto LLD | 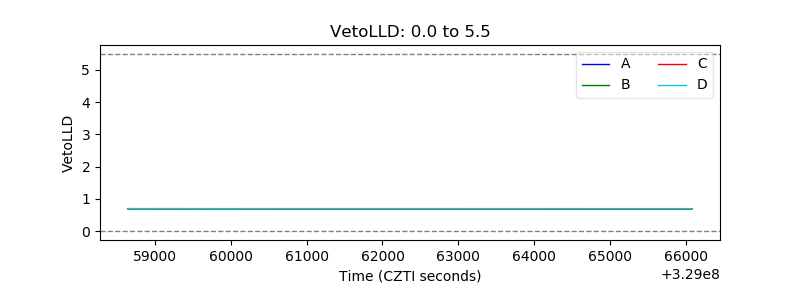 |
| Alpha Counter | 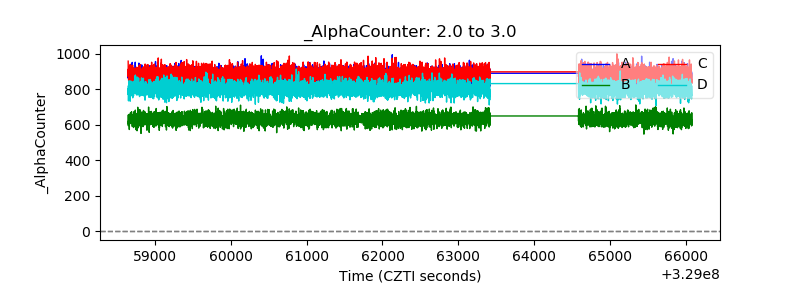 |
| _CPM_Rate | 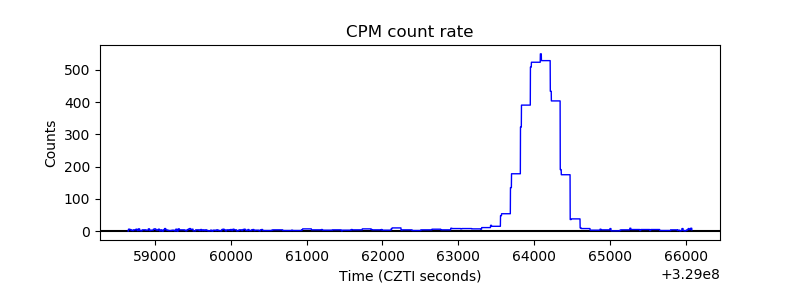 |
| CZT Counter | 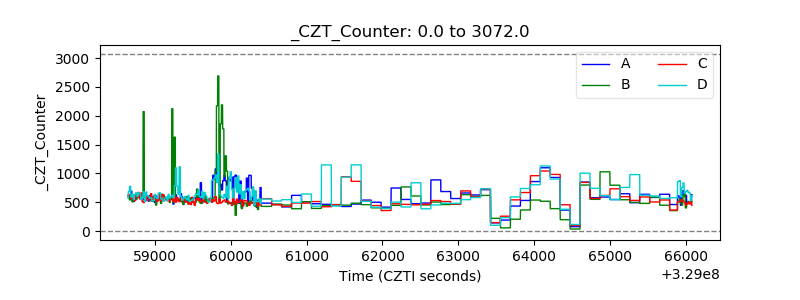 |
| +2.5 Volts monitor |  |
| +5 Volts monitor |  |
| _ROLL_ROT | 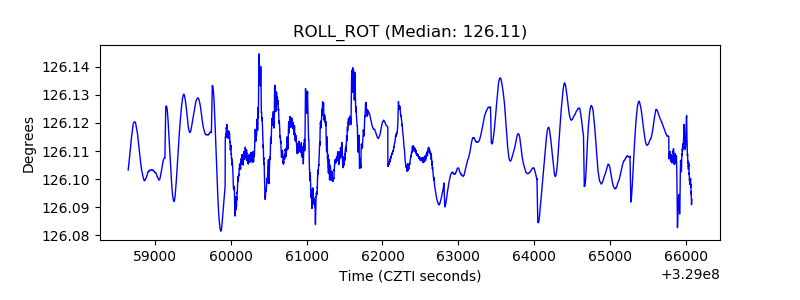 |
| _Roll_DEC | 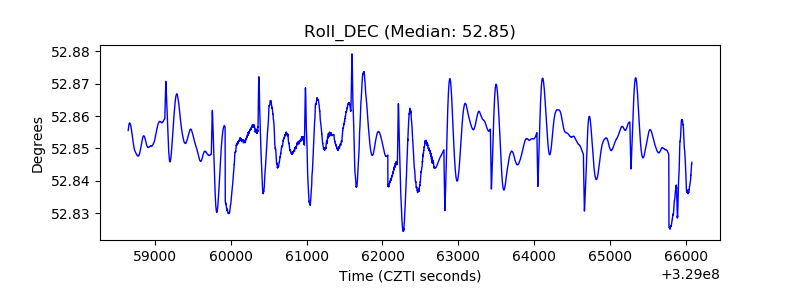 |
| _Roll_RA | 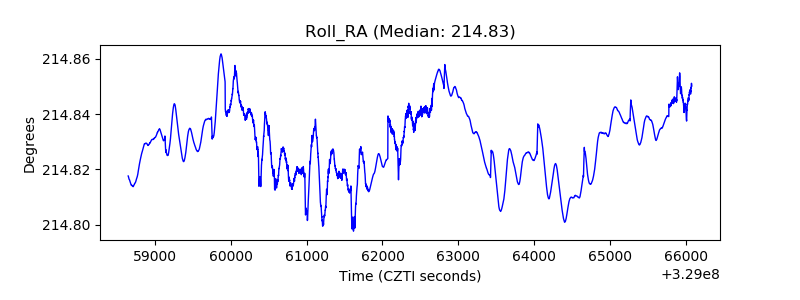 |
| Veto Counter | 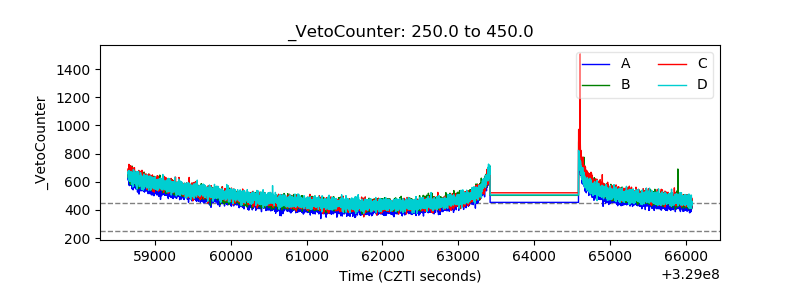 |