| Param | Original file | Final file |
|---|---|---|
| Filename | modeM0/AS1A09_059T01_9000003706_25348cztM0_level2.evt | modeM0/AS1A09_059T01_9000003706_25348cztM0_level2_quad_clean.evt |
| Size (bytes) | 511,162,560 | 107,856,000 |
| Size | 487.5 MB | 102.9 MB |
| Events in quadrant A | 3,706,909 | 717,022 |
| Events in quadrant B | 3,423,920 | 717,331 |
| Events in quadrant C | 3,368,816 | 687,336 |
| Events in quadrant D | 4,522,188 | 673,658 |
| Mode M0 | |||
|---|---|---|---|
| Quadrant | BADHDUFLAG | Total packets | Discarded packets |
| A | 0 | 15679 | 0 |
| B | 0 | 14325 | 0 |
| C | 0 | 14078 | 0 |
| D | 0 | 17978 | 0 |
| Mode M9 | |||
|---|---|---|---|
| Quadrant | BADHDUFLAG | Total packets | Discarded packets |
| A | 0 | 8 | 0 |
| B | 0 | 8 | 0 |
| C | 0 | 8 | 0 |
| D | 0 | 8 | 0 |
| Quadrant | Total seconds | Saturated seconds | Saturation percentage |
|---|---|---|---|
| A | 6766 | 82 | 1.211942% |
| B | 6767 | 85 | 1.256096% |
| C | 6767 | 126 | 1.861977% |
| D | 6766 | 160 | 2.364765% |
Noise dominated data is calculated using 1-second bins in cleaned event files. If a bin has >2000 counts, and if more than 50% of those come from <1% of pixels, then it is considered to be noise-dominated and hence unusable.
| Quadrant | # 1 sec bins | Bins with >0 counts | Bins with >2000 counts | High rate bins dominated by noise | Noise dominated (total time) | Noise dominated (detector-on time) | Marked lightcurve |
|---|---|---|---|---|---|---|---|
| A | 7546 | 6767 | 0 | 0 | 0.00% | 0.00% | 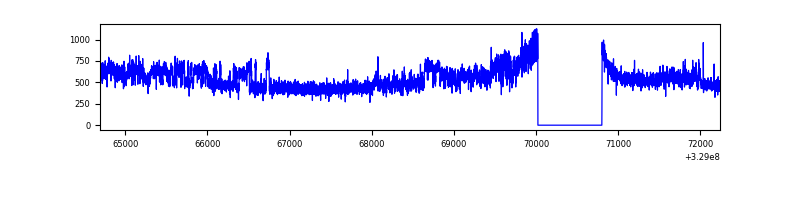 |
| B | 7547 | 6768 | 0 | 0 | 0.00% | 0.00% | 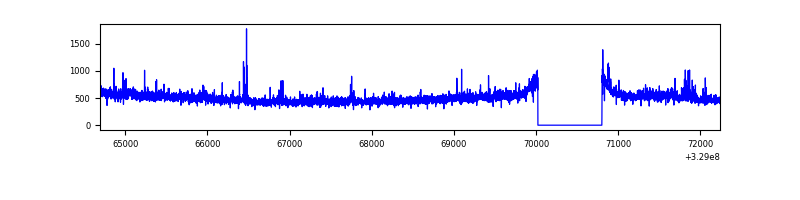 |
| C | 7547 | 6768 | 1 | 1 | 0.01% | 0.01% | 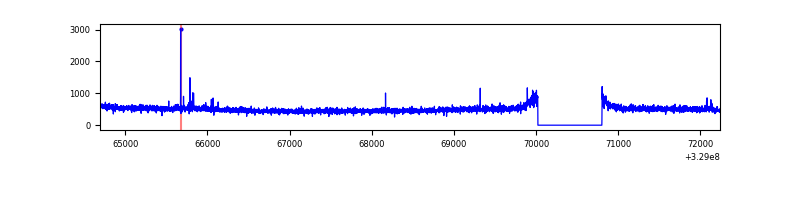 |
| D | 7546 | 6766 | 60 | 60 | 0.80% | 0.89% | 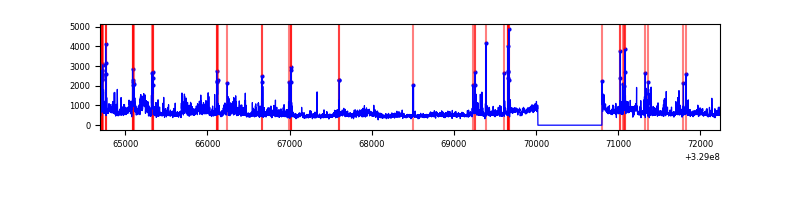 |
Top three noisy pixels from each quadrant. If the there are fewer than three noisy pixels in the level2.evt file, extra rows are filled as -1
| Pixel properties | Quadrant properties | ||||||
|---|---|---|---|---|---|---|---|
| Quadrant | DetID | PixID | Counts | Sigma | Mean | Median | Sigma |
| A | 15 | 173 | 410258 | 2416.94 | 855 | 838 | 169.4 |
| A | 13 | 254 | 9776 | 52.76 | 855 | 838 | 169.4 |
| A | 3 | 137 | 7610 | 39.98 | 855 | 838 | 169.4 |
| B | 3 | 112 | 69362 | 429.4 | 842 | 821 | 159.6 |
| B | 12 | 111 | 19044 | 114.16 | 842 | 821 | 159.6 |
| B | 0 | 190 | 18247 | 109.17 | 842 | 821 | 159.6 |
| C | 14 | 238 | 131132 | 683.63 | 822 | 827 | 190.6 |
| C | 7 | 87 | 11432 | 55.64 | 822 | 827 | 190.6 |
| C | 9 | 54 | 10263 | 49.5 | 822 | 827 | 190.6 |
| D | 8 | 195 | 583909 | 2911.67 | 834 | 810 | 200.3 |
| D | 1 | 52 | 388925 | 1938.03 | 834 | 810 | 200.3 |
| D | 12 | 233 | 120599 | 598.16 | 834 | 810 | 200.3 |
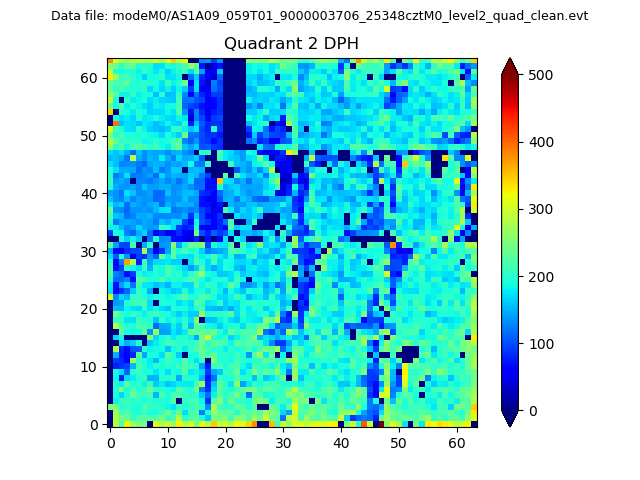
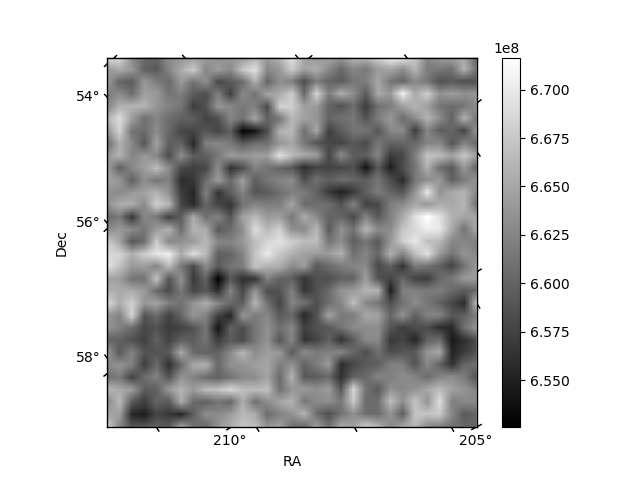
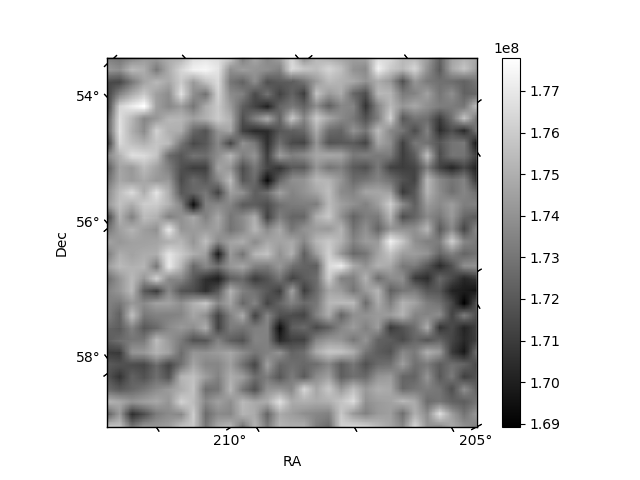
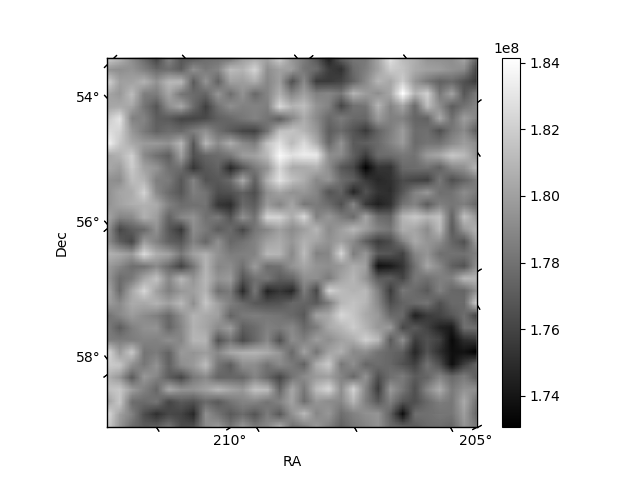
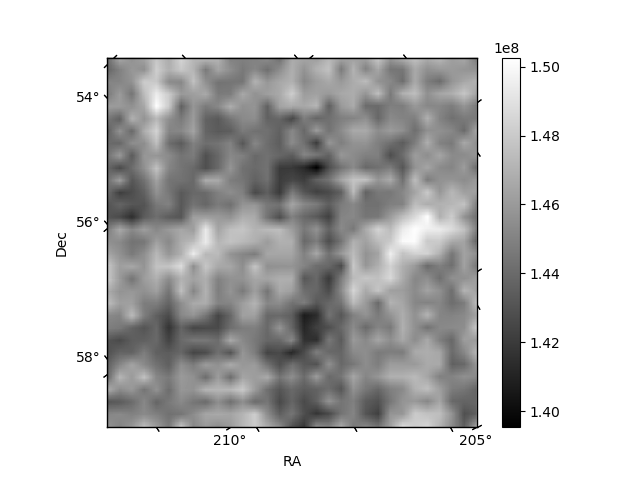
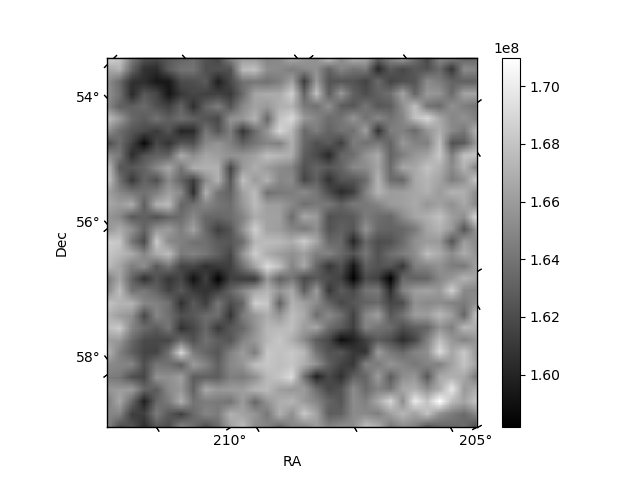
Histogram calculated using DETX and DETY for each event in the final _common_clean file
| Quadrant A | 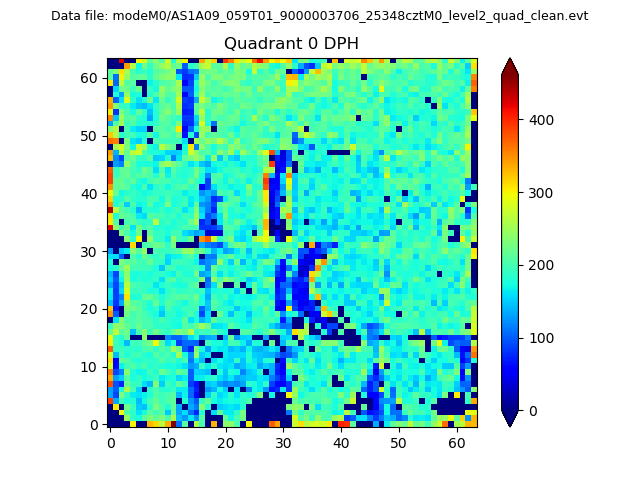 |
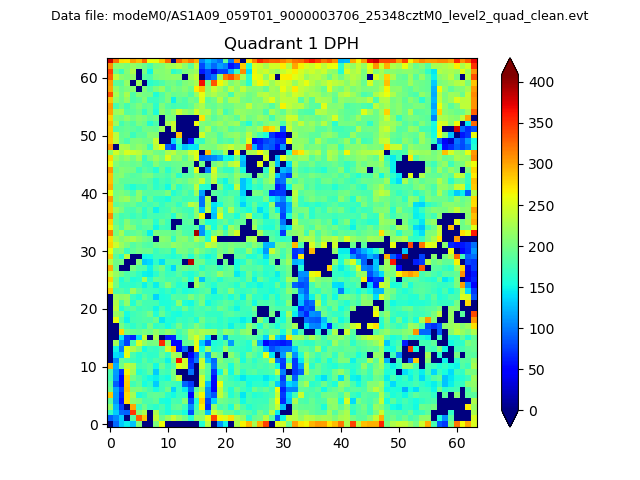 |
Quadrant B |
|---|---|---|---|
| Quadrant D | 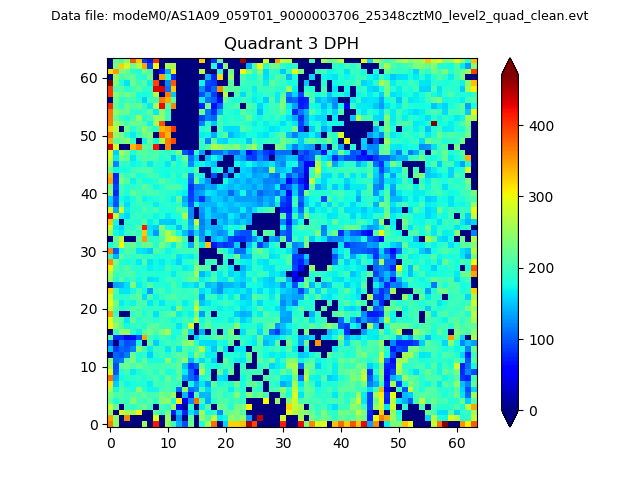 |
 |
Quadrant C |
| Plot type | Count rate plots | Images |
|---|---|---|
| Comparison with Poisson distribution Blue bars denote a histogram of data divided into 1 sec bins. Red curve is a Poisson curve with rate = median count rate of data. |
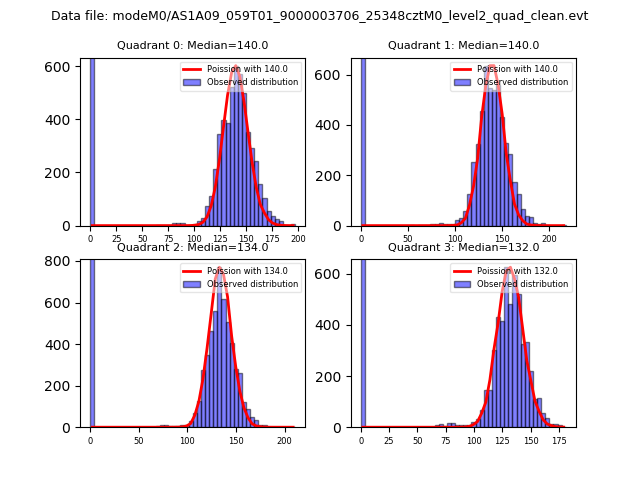 |
 |
| Quadrant-wise count rates Data is divided into 100 sec bins |
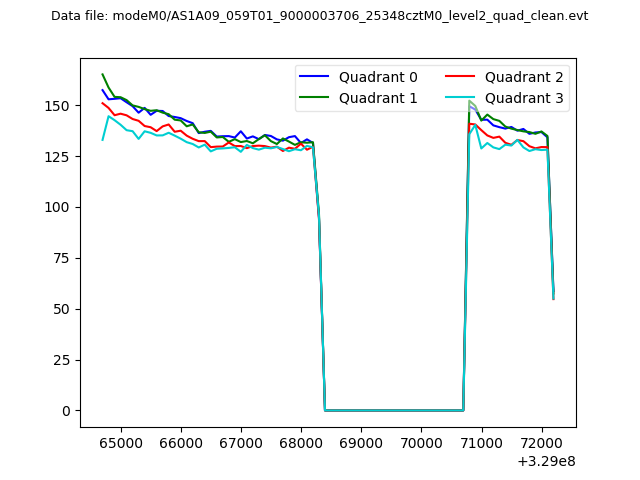 |
|
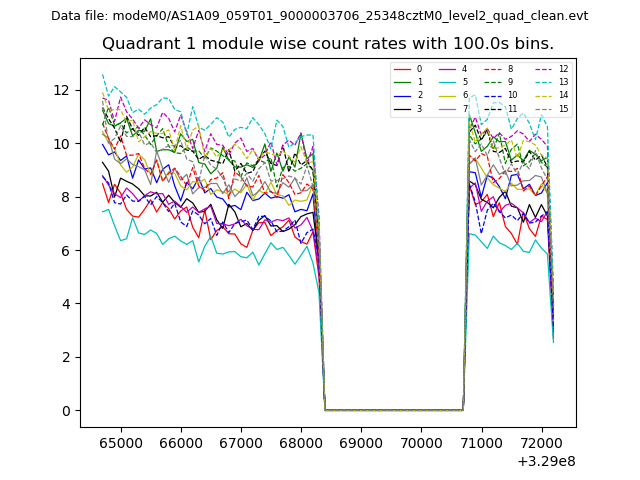
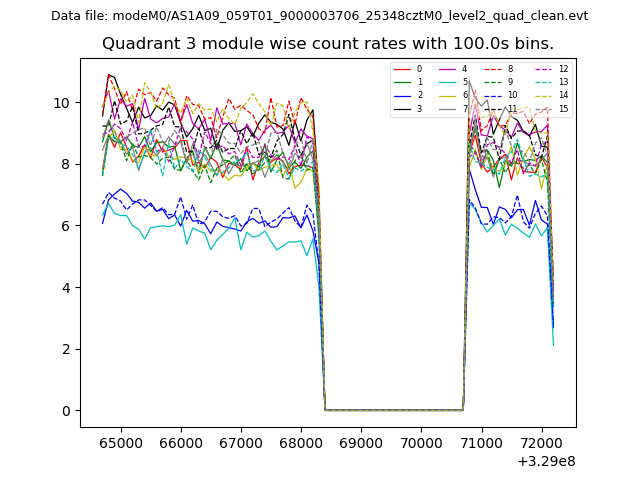
| Module-wise count rates for Quadrant A Data is divided into 100 sec bins |
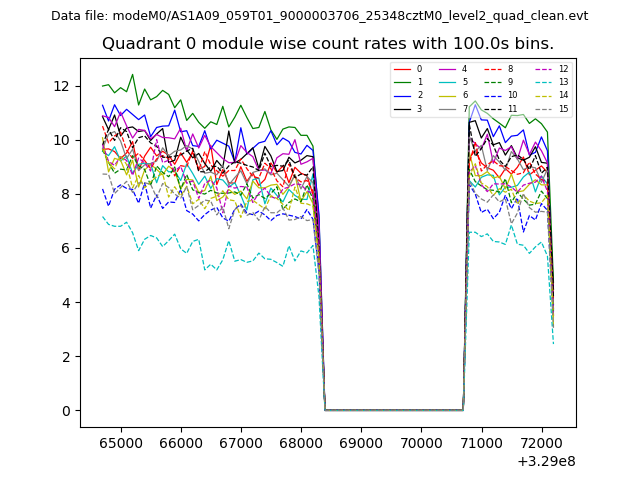 |
 |
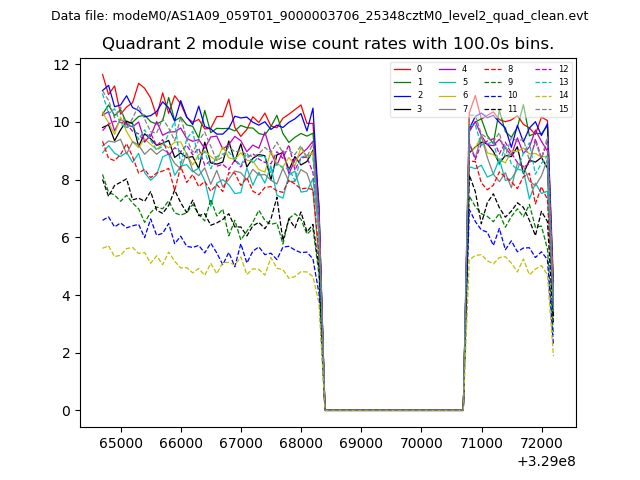
| Module-wise count rates for Quadrant B Data is divided into 100 sec bins |
 |
 |
| Module-wise count rates for Quadrant C Data is divided into 100 sec bins |
 |
 |
| Module-wise count rates for Quadrant D Data is divided into 100 sec bins |
 |
 |
| Parameter | Plot |
|---|---|
| CZT HV Monitor | 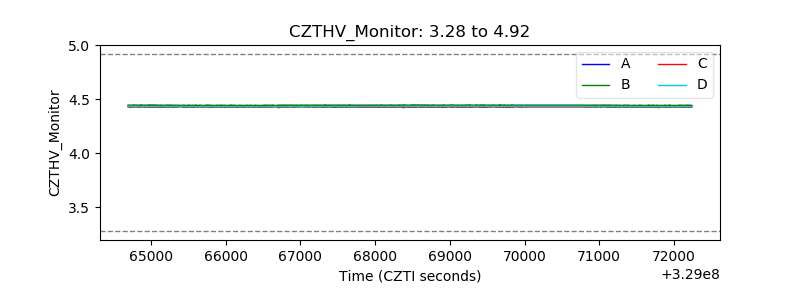 |
| D_VDD | 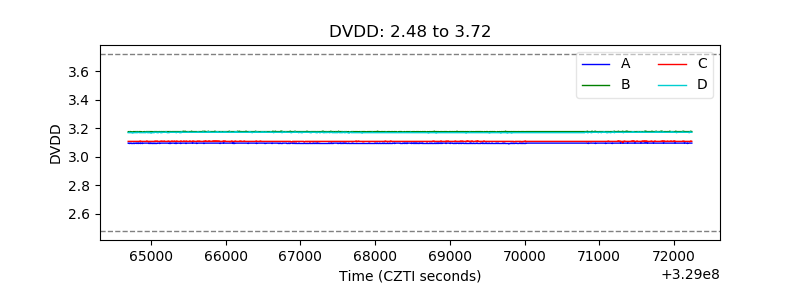 |
| Temperature 1 | 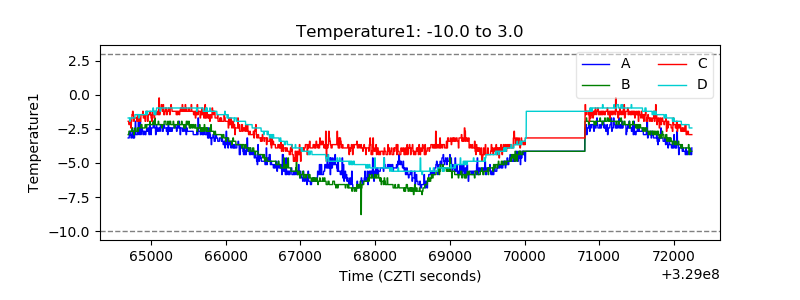 |
| Veto HV Monitor | 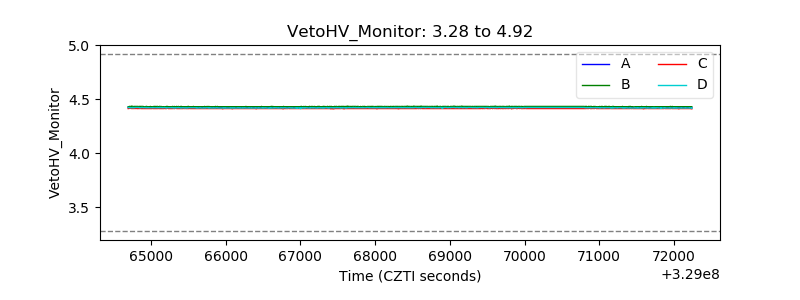 |
| Veto LLD | 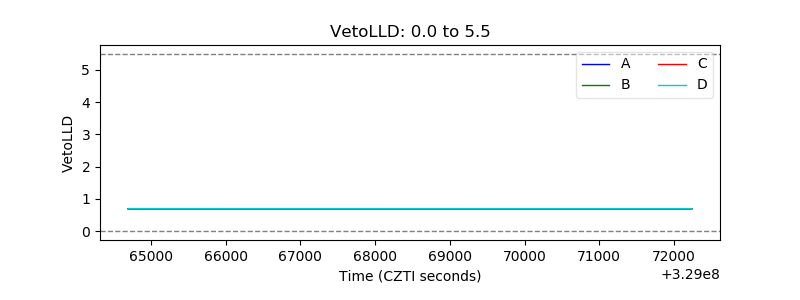 |
| Alpha Counter | 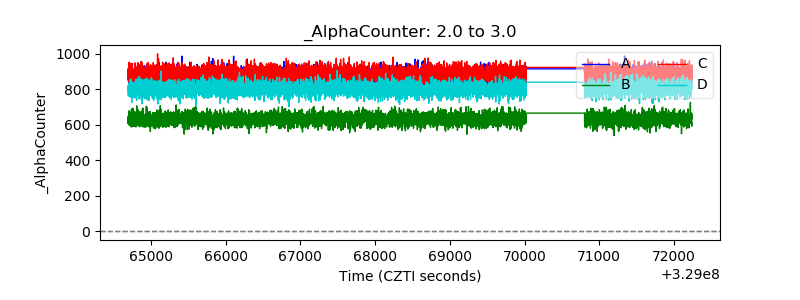 |
| _CPM_Rate | 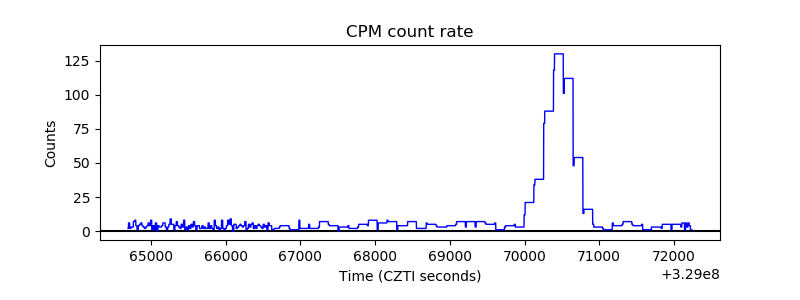 |
| CZT Counter | 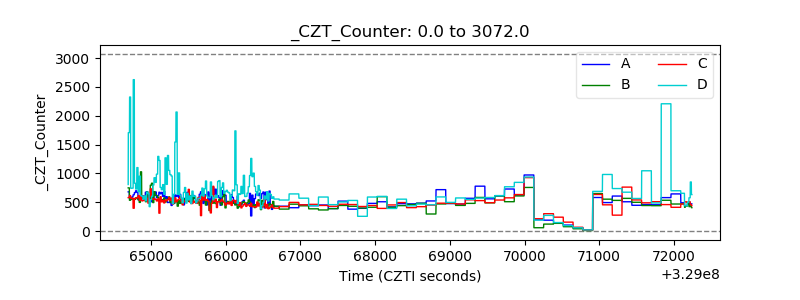 |
| +2.5 Volts monitor |  |
| +5 Volts monitor | 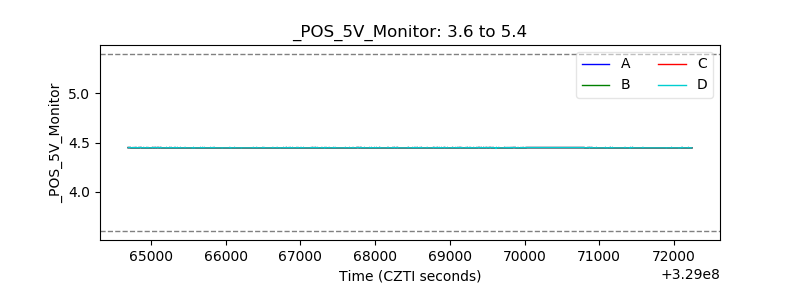 |
| _ROLL_ROT | 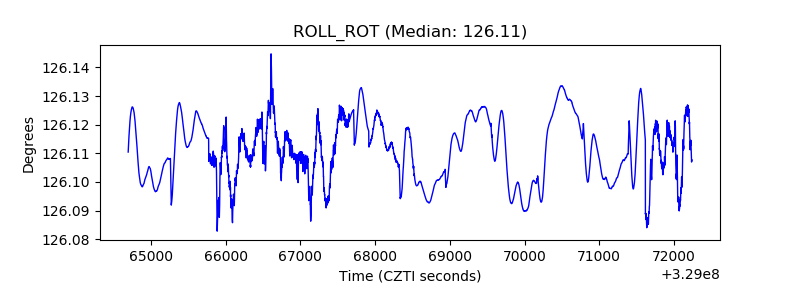 |
| _Roll_DEC |  |
| _Roll_RA | 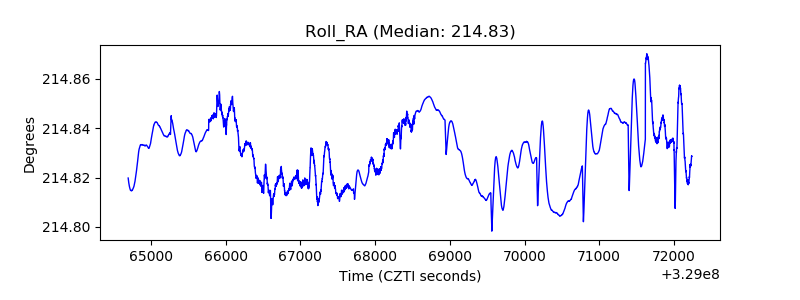 |
| Veto Counter | 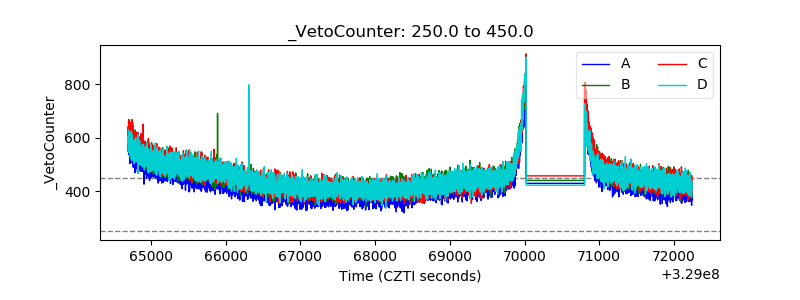 |