| Param | Original file | Final file |
|---|---|---|
| Filename | modeM0/AS1A09_059T01_9000003706_25349cztM0_level2.evt | modeM0/AS1A09_059T01_9000003706_25349cztM0_level2_quad_clean.evt |
| Size (bytes) | 558,264,960 | 108,311,040 |
| Size | 532.4 MB | 103.3 MB |
| Events in quadrant A | 3,531,406 | 719,358 |
| Events in quadrant B | 3,633,032 | 718,424 |
| Events in quadrant C | 3,876,200 | 688,616 |
| Events in quadrant D | 5,376,010 | 650,445 |
| Mode M0 | |||
|---|---|---|---|
| Quadrant | BADHDUFLAG | Total packets | Discarded packets |
| A | 0 | 15187 | 0 |
| B | 0 | 15384 | 0 |
| C | 0 | 16046 | 0 |
| D | 0 | 20912 | 0 |
| Mode M9 | |||
|---|---|---|---|
| Quadrant | BADHDUFLAG | Total packets | Discarded packets |
| A | 0 | 4 | 0 |
| B | 0 | 5 | 0 |
| C | 0 | 5 | 0 |
| D | 0 | 5 | 0 |
| Quadrant | Total seconds | Saturated seconds | Saturation percentage |
|---|---|---|---|
| A | 7230 | 46 | 0.636238% |
| B | 7230 | 77 | 1.065007% |
| C | 7230 | 169 | 2.337483% |
| D | 7230 | 499 | 6.901798% |
Noise dominated data is calculated using 1-second bins in cleaned event files. If a bin has >2000 counts, and if more than 50% of those come from <1% of pixels, then it is considered to be noise-dominated and hence unusable.
| Quadrant | # 1 sec bins | Bins with >0 counts | Bins with >2000 counts | High rate bins dominated by noise | Noise dominated (total time) | Noise dominated (detector-on time) | Marked lightcurve |
|---|---|---|---|---|---|---|---|
| A | 7615 | 7232 | 0 | 0 | 0.00% | 0.00% | 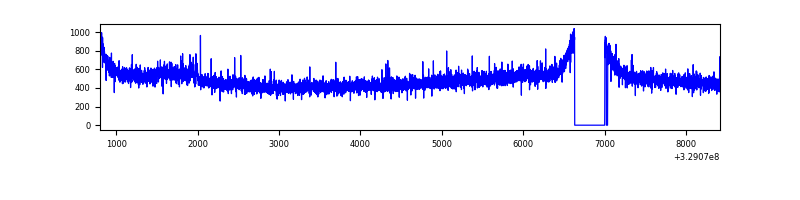 |
| B | 7615 | 7232 | 0 | 0 | 0.00% | 0.00% | 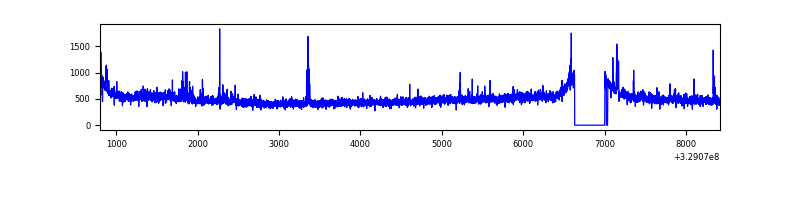 |
| C | 7615 | 7232 | 54 | 54 | 0.71% | 0.75% | 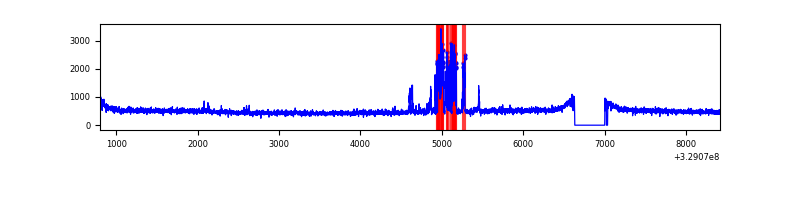 |
| D | 7615 | 7231 | 369 | 369 | 4.85% | 5.10% | 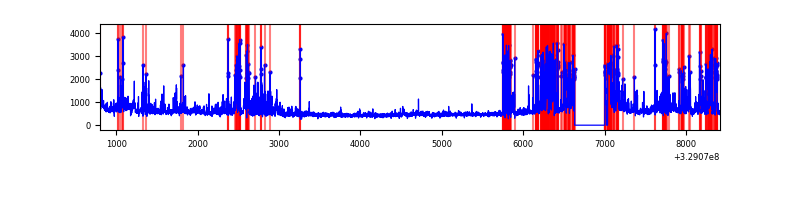 |
Top three noisy pixels from each quadrant. If the there are fewer than three noisy pixels in the level2.evt file, extra rows are filled as -1
| Pixel properties | Quadrant properties | ||||||
|---|---|---|---|---|---|---|---|
| Quadrant | DetID | PixID | Counts | Sigma | Mean | Median | Sigma |
| A | 15 | 173 | 45347 | 245.83 | 903 | 883 | 180.9 |
| A | 13 | 254 | 11214 | 57.12 | 903 | 883 | 180.9 |
| A | 3 | 137 | 8297 | 40.99 | 903 | 883 | 180.9 |
| B | 3 | 112 | 68522 | 396.6 | 891 | 866 | 170.6 |
| B | 0 | 190 | 31461 | 179.35 | 891 | 866 | 170.6 |
| B | 0 | 229 | 21880 | 123.18 | 891 | 866 | 170.6 |
| C | 7 | 87 | 348201 | 1720.37 | 863 | 868 | 201.9 |
| C | 14 | 238 | 137025 | 674.4 | 863 | 868 | 201.9 |
| C | 9 | 54 | 17772 | 83.73 | 863 | 868 | 201.9 |
| D | 1 | 52 | 1261993 | 6109.48 | 853 | 829 | 206.4 |
| D | 12 | 233 | 426313 | 2061.18 | 853 | 829 | 206.4 |
| D | 8 | 195 | 242064 | 1168.62 | 853 | 829 | 206.4 |
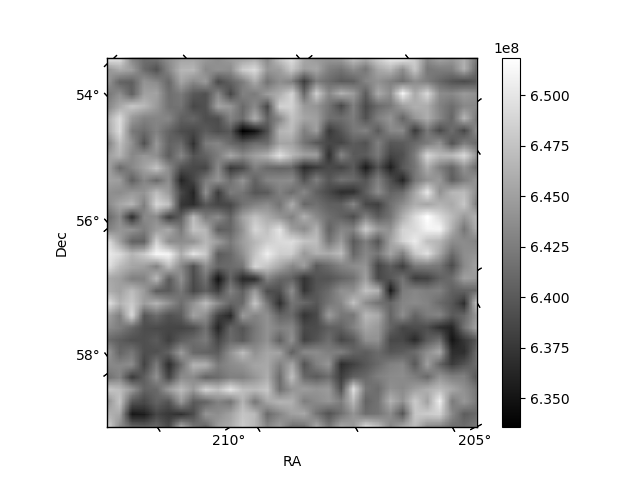
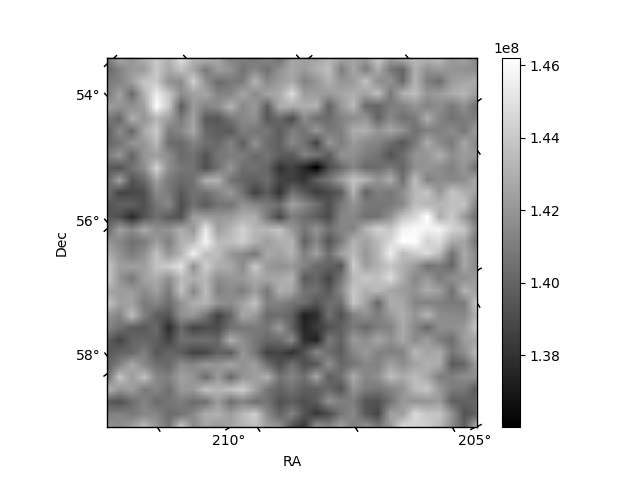
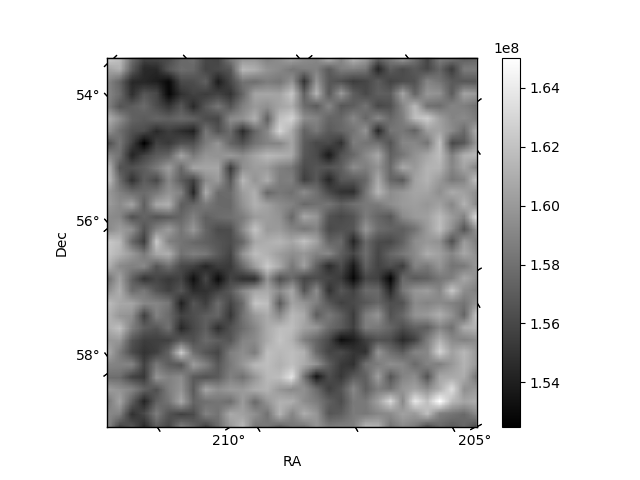
Histogram calculated using DETX and DETY for each event in the final _common_clean file
| Quadrant A | 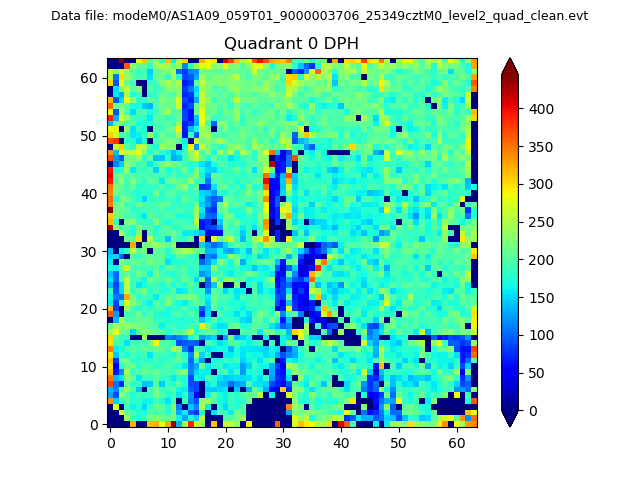 |
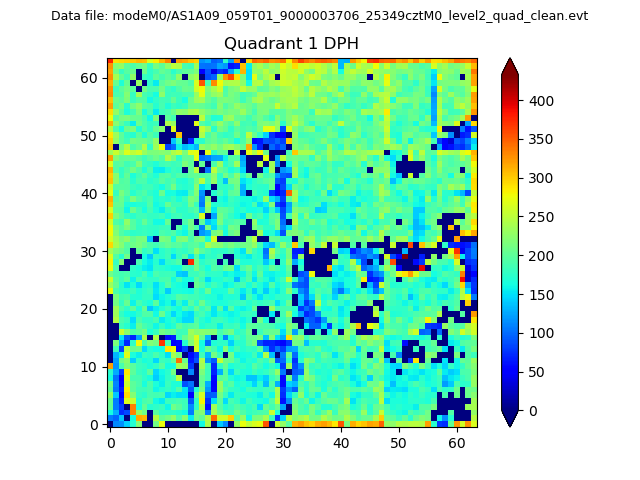 |
Quadrant B |
|---|---|---|---|
| Quadrant D | 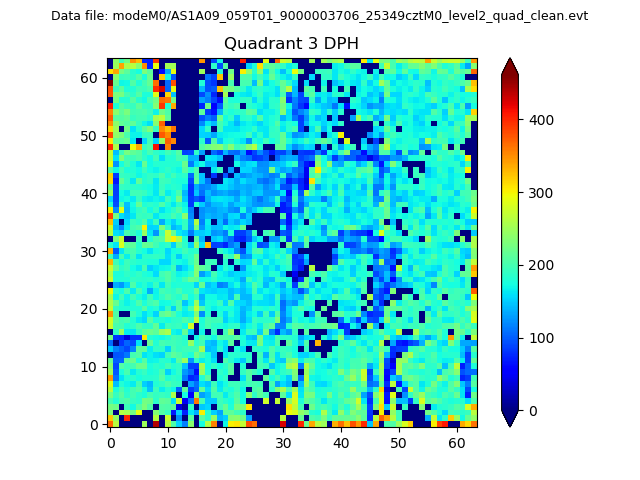 |
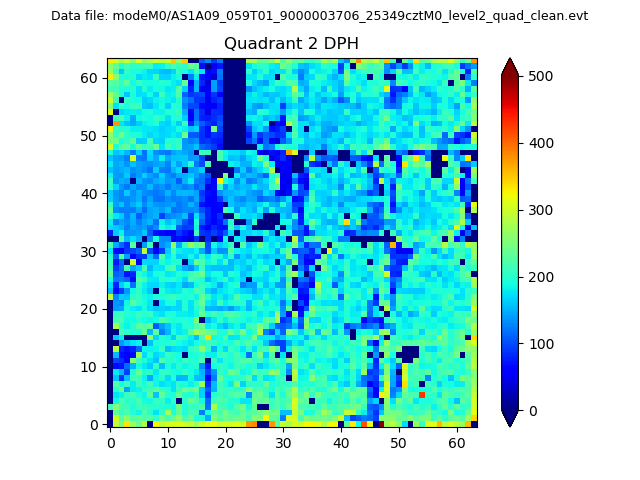 |
Quadrant C |
| Plot type | Count rate plots | Images |
|---|---|---|
| Comparison with Poisson distribution Blue bars denote a histogram of data divided into 1 sec bins. Red curve is a Poisson curve with rate = median count rate of data. |
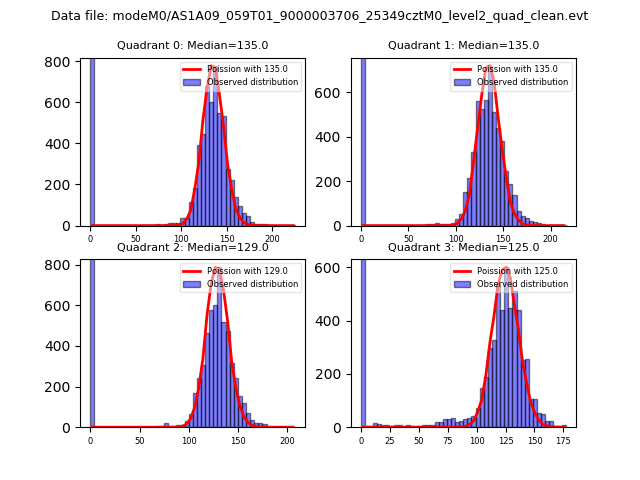 |
 |
| Quadrant-wise count rates Data is divided into 100 sec bins |
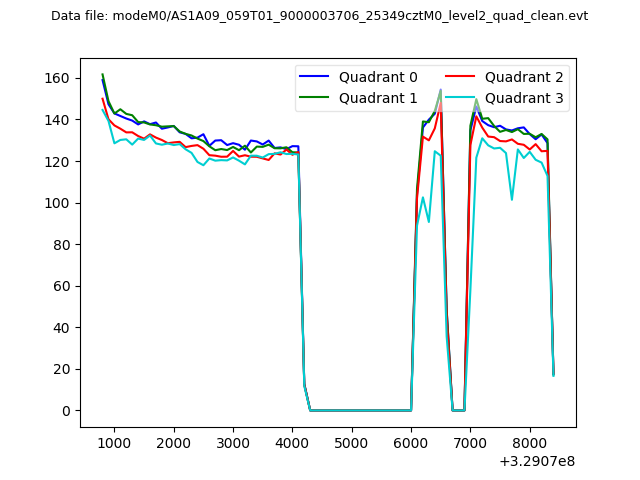 |
|
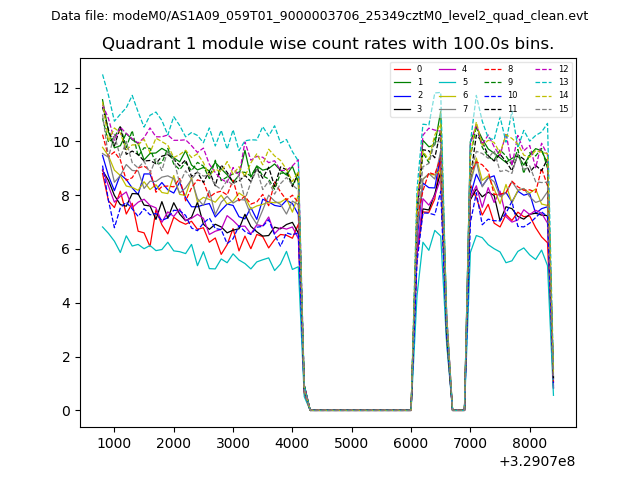
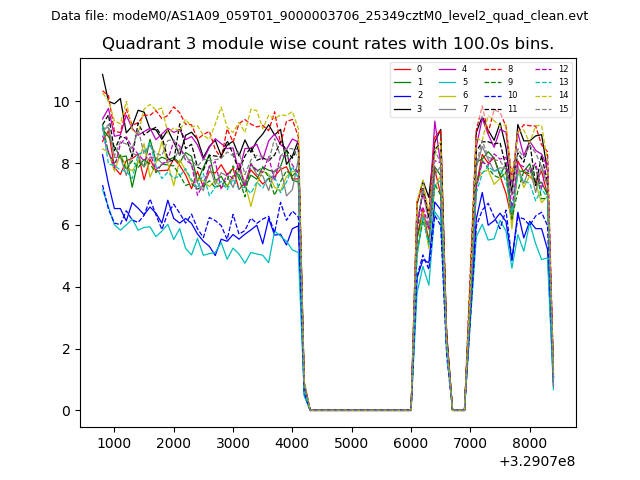
| Module-wise count rates for Quadrant A Data is divided into 100 sec bins |
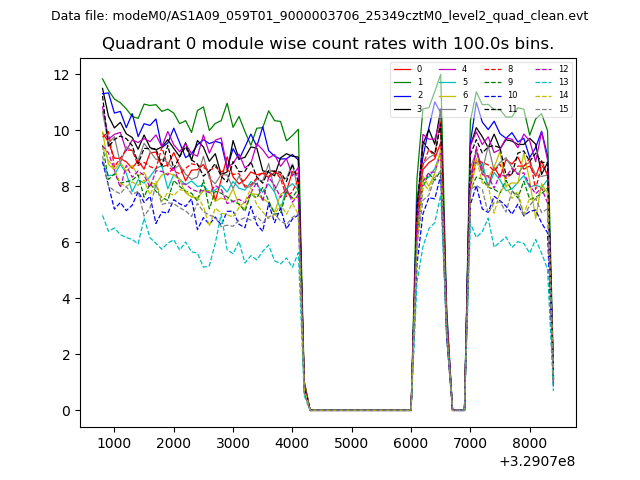 |
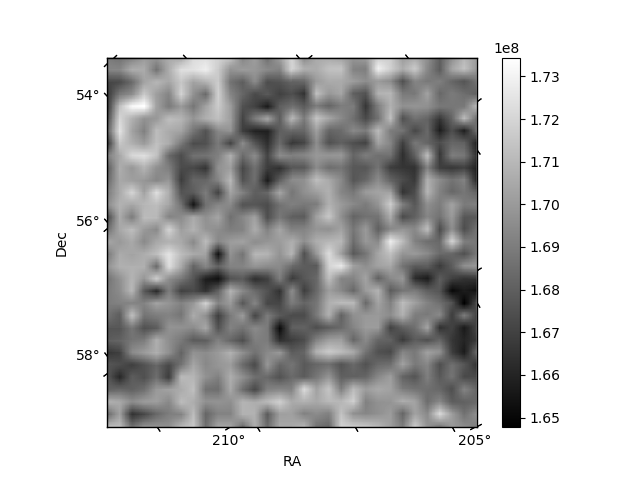 |
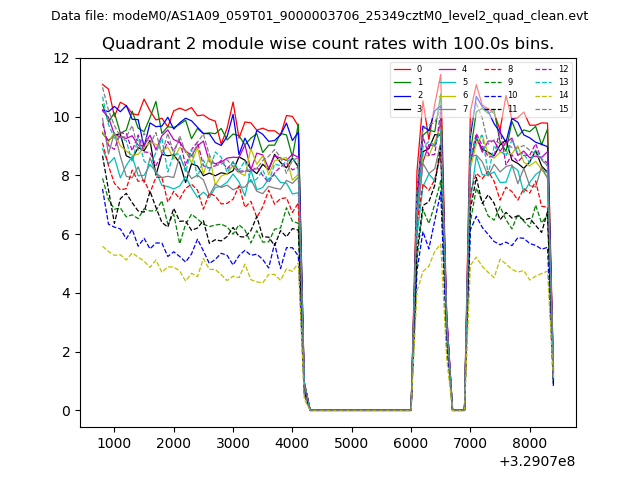
| Module-wise count rates for Quadrant B Data is divided into 100 sec bins |
 |
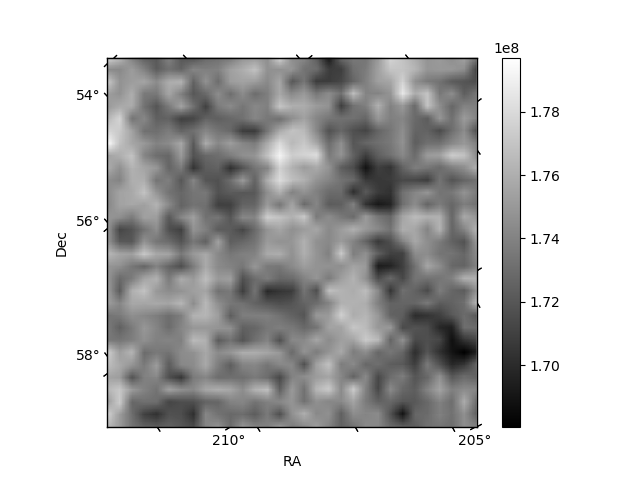 |
| Module-wise count rates for Quadrant C Data is divided into 100 sec bins |
 |
 |
| Module-wise count rates for Quadrant D Data is divided into 100 sec bins |
 |
 |
| Parameter | Plot |
|---|---|
| CZT HV Monitor | 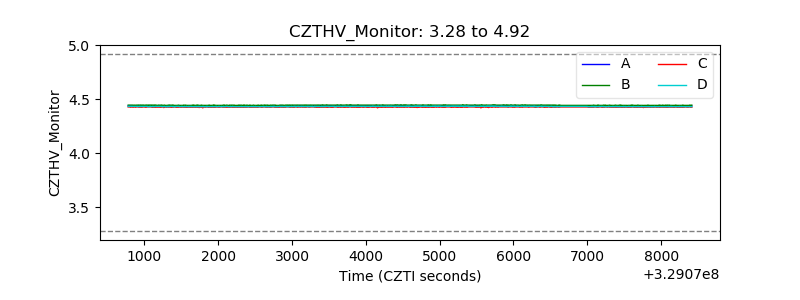 |
| D_VDD | 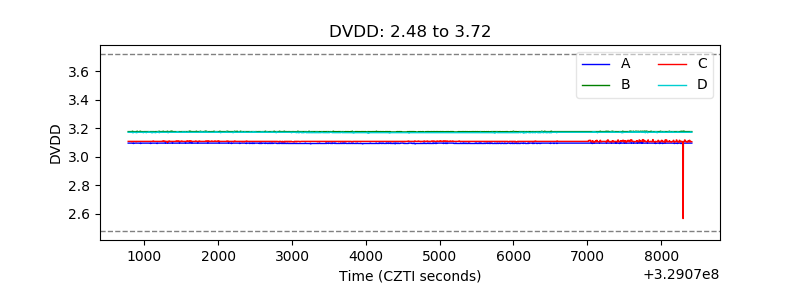 |
| Temperature 1 | 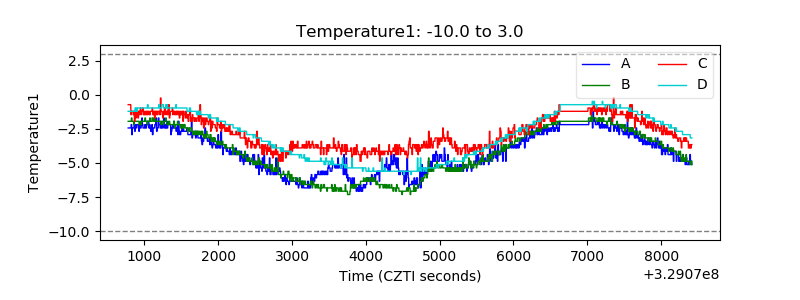 |
| Veto HV Monitor | 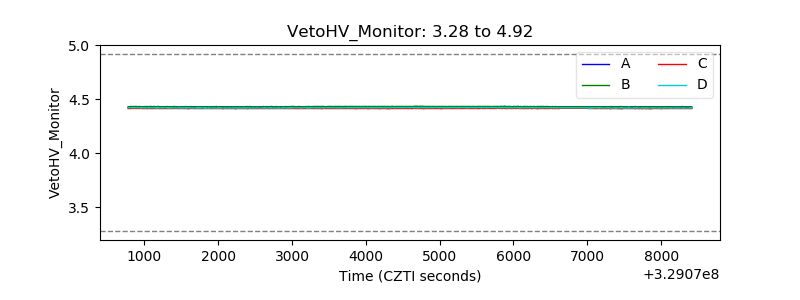 |
| Veto LLD | 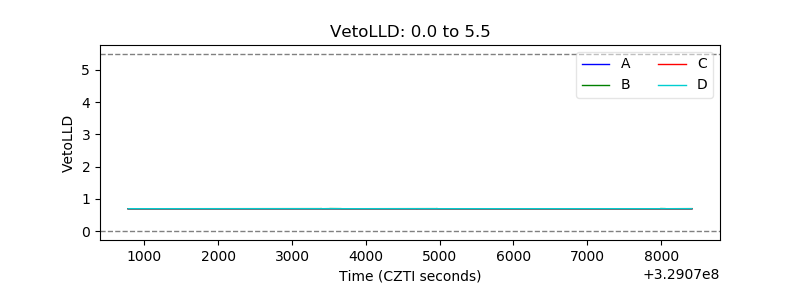 |
| Alpha Counter |  |
| _CPM_Rate | 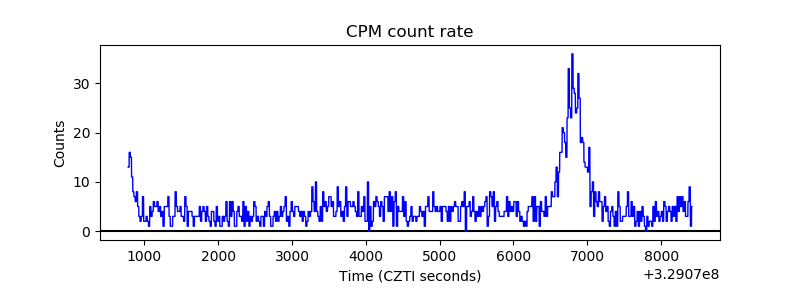 |
| CZT Counter | 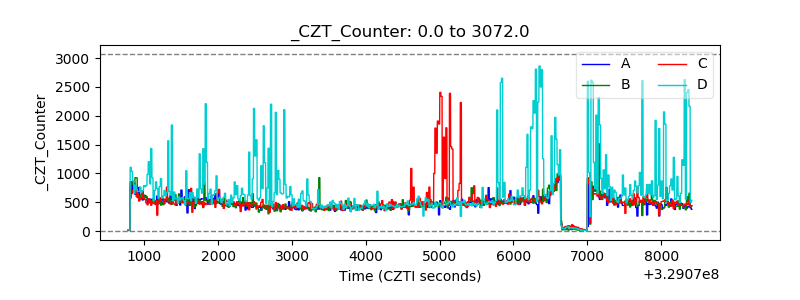 |
| +2.5 Volts monitor |  |
| +5 Volts monitor |  |
| _ROLL_ROT | 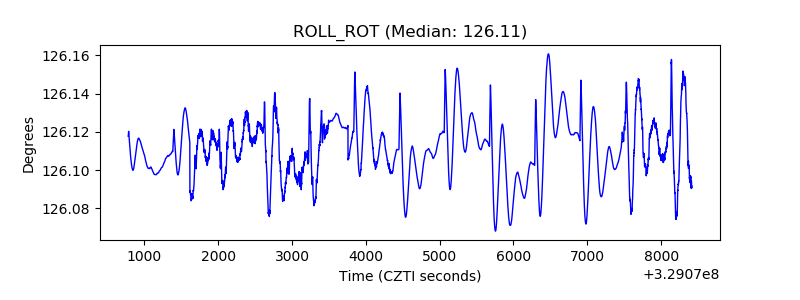 |
| _Roll_DEC | 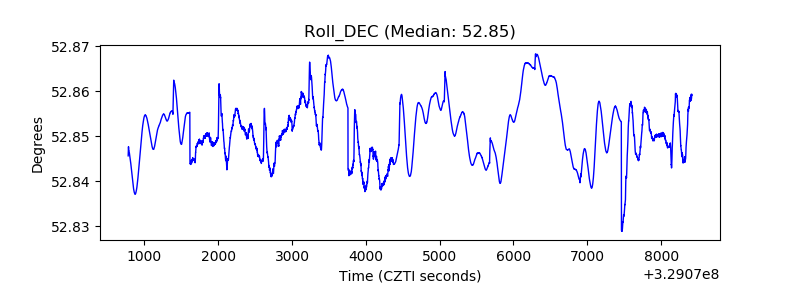 |
| _Roll_RA | 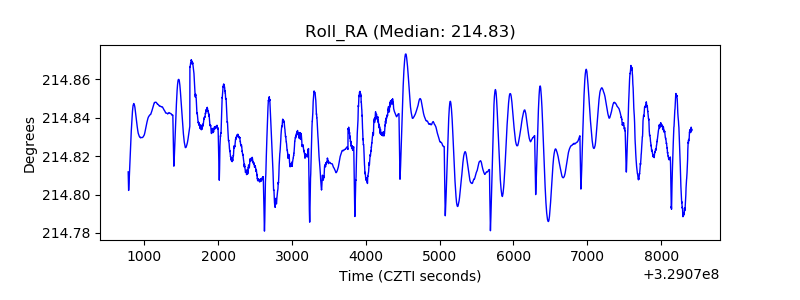 |
| Veto Counter | 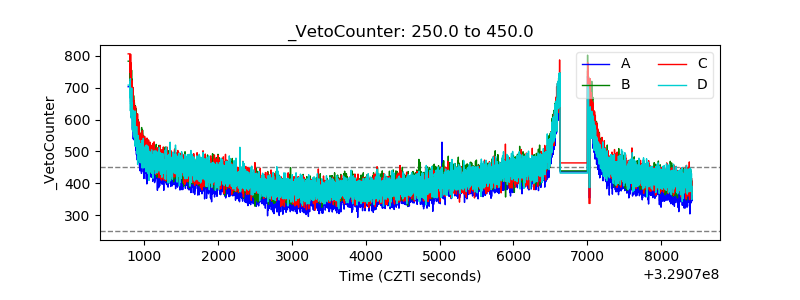 |