| Param | Original file | Final file |
|---|---|---|
| Filename | modeM0/AS1A09_059T01_9000003706_25350cztM0_level2.evt | modeM0/AS1A09_059T01_9000003706_25350cztM0_level2_quad_clean.evt |
| Size (bytes) | 584,576,640 | 118,514,880 |
| Size | 557.5 MB | 113.0 MB |
| Events in quadrant A | 3,781,718 | 783,098 |
| Events in quadrant B | 3,992,282 | 787,890 |
| Events in quadrant C | 4,094,990 | 751,943 |
| Events in quadrant D | 5,305,357 | 723,186 |
| Mode M0 | |||
|---|---|---|---|
| Quadrant | BADHDUFLAG | Total packets | Discarded packets |
| A | 0 | 16456 | 0 |
| B | 0 | 17021 | 0 |
| C | 0 | 17148 | 0 |
| D | 0 | 21053 | 0 |
| Mode M9 | |||
|---|---|---|---|
| Quadrant | BADHDUFLAG | Total packets | Discarded packets |
| A | 0 | 6 | 0 |
| B | 0 | 6 | 0 |
| C | 0 | 6 | 0 |
| D | 0 | 6 | 0 |
| Quadrant | Total seconds | Saturated seconds | Saturation percentage |
|---|---|---|---|
| A | 7811 | 81 | 1.036999% |
| B | 7810 | 135 | 1.728553% |
| C | 7810 | 169 | 2.163892% |
| D | 7811 | 346 | 4.429650% |
Noise dominated data is calculated using 1-second bins in cleaned event files. If a bin has >2000 counts, and if more than 50% of those come from <1% of pixels, then it is considered to be noise-dominated and hence unusable.
| Quadrant | # 1 sec bins | Bins with >0 counts | Bins with >2000 counts | High rate bins dominated by noise | Noise dominated (total time) | Noise dominated (detector-on time) | Marked lightcurve |
|---|---|---|---|---|---|---|---|
| A | 8386 | 7814 | 7 | 7 | 0.08% | 0.09% | 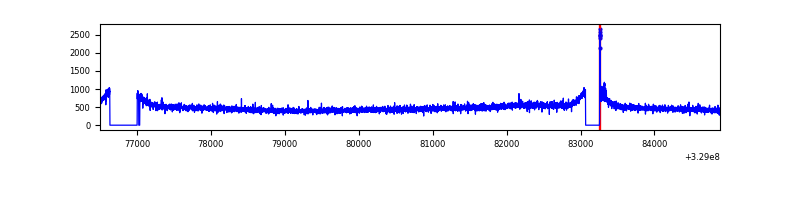 |
| B | 8385 | 7813 | 0 | 0 | 0.00% | 0.00% | 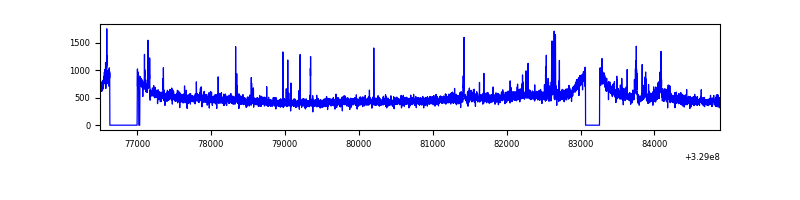 |
| C | 8385 | 7812 | 12 | 12 | 0.14% | 0.15% | 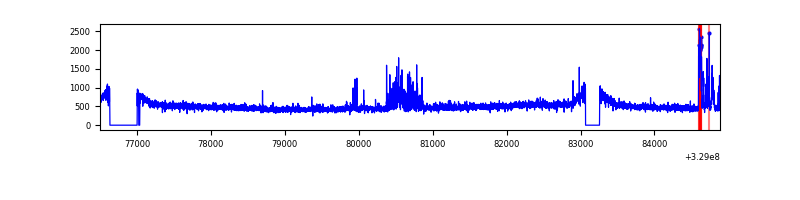 |
| D | 8386 | 7813 | 236 | 236 | 2.81% | 3.02% | 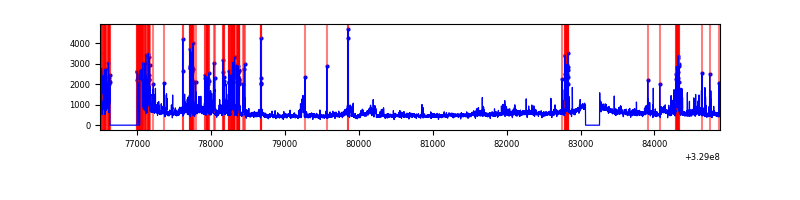 |
Top three noisy pixels from each quadrant. If the there are fewer than three noisy pixels in the level2.evt file, extra rows are filled as -1
| Pixel properties | Quadrant properties | ||||||
|---|---|---|---|---|---|---|---|
| Quadrant | DetID | PixID | Counts | Sigma | Mean | Median | Sigma |
| A | 8 | 192 | 22330 | 108.4 | 972 | 951 | 197.2 |
| A | 13 | 254 | 11879 | 55.41 | 972 | 951 | 197.2 |
| A | 3 | 137 | 9213 | 41.89 | 972 | 951 | 197.2 |
| B | 3 | 112 | 99319 | 532.01 | 963 | 938 | 184.9 |
| B | 5 | 235 | 35560 | 187.22 | 963 | 938 | 184.9 |
| B | 0 | 229 | 29203 | 152.85 | 963 | 938 | 184.9 |
| C | 7 | 87 | 150023 | 678.64 | 934 | 940 | 219.7 |
| C | 14 | 238 | 146097 | 660.77 | 934 | 940 | 219.7 |
| C | 9 | 54 | 132753 | 600.03 | 934 | 940 | 219.7 |
| D | 1 | 52 | 793173 | 3507.72 | 930 | 901 | 225.9 |
| D | 12 | 233 | 340172 | 1502.09 | 930 | 901 | 225.9 |
| D | 9 | 35 | 255739 | 1128.27 | 930 | 901 | 225.9 |
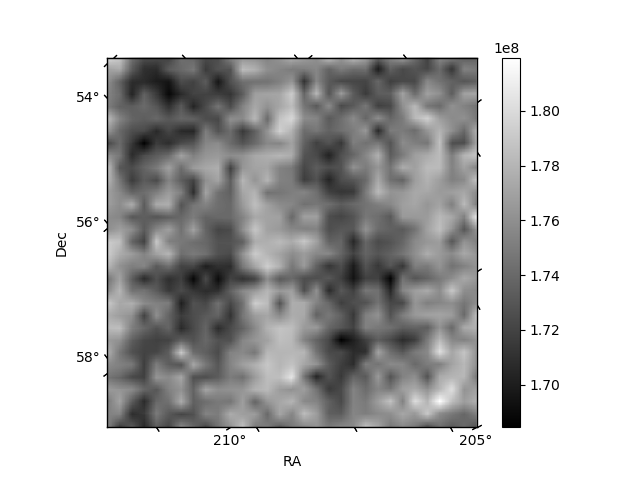
Histogram calculated using DETX and DETY for each event in the final _common_clean file
| Quadrant A | 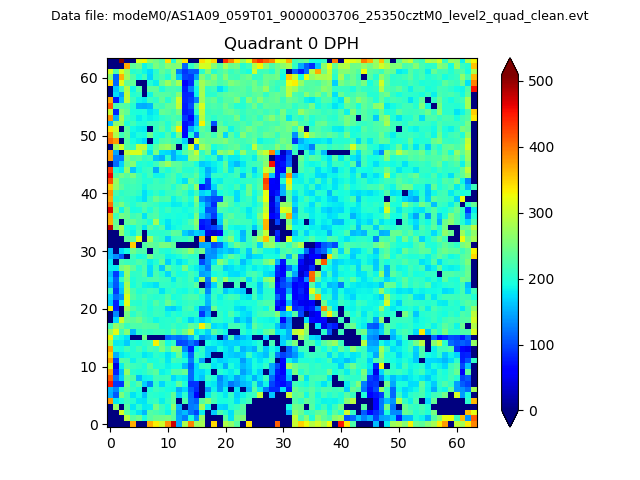 |
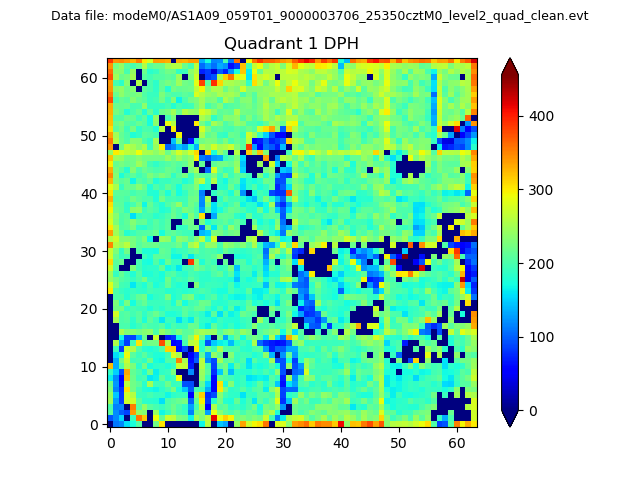 |
Quadrant B |
|---|---|---|---|
| Quadrant D | 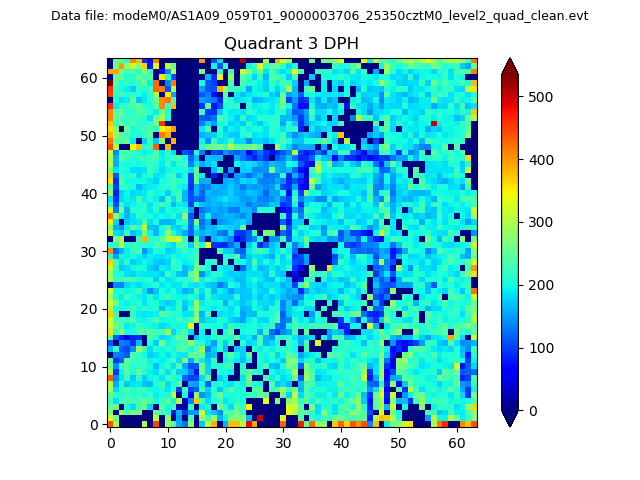 |
 |
Quadrant C |
| Plot type | Count rate plots | Images |
|---|---|---|
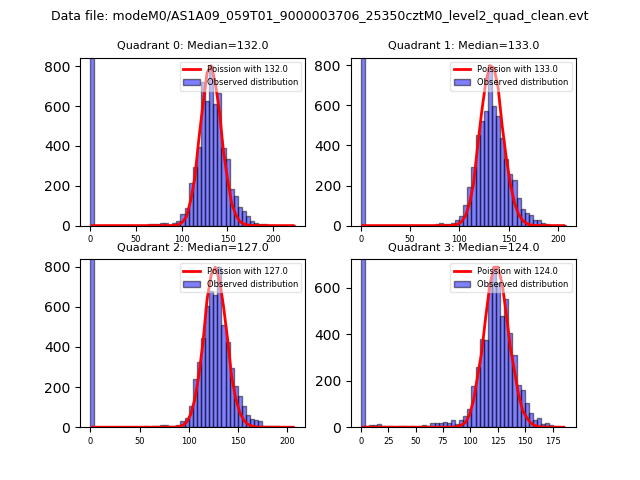
| Comparison with Poisson distribution Blue bars denote a histogram of data divided into 1 sec bins. Red curve is a Poisson curve with rate = median count rate of data. |
 |
 |
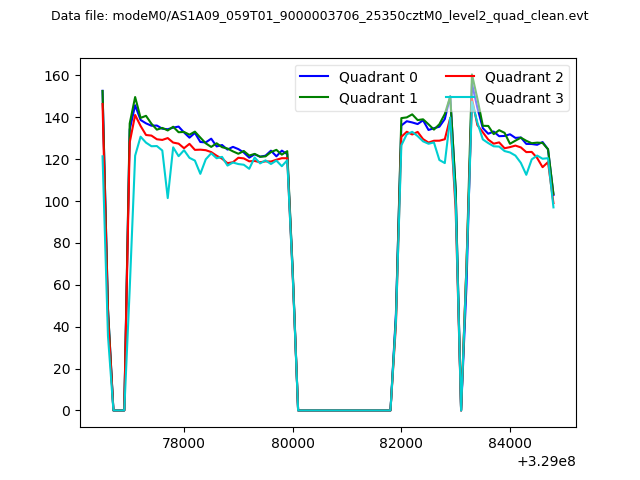
| Quadrant-wise count rates Data is divided into 100 sec bins |
 |
|
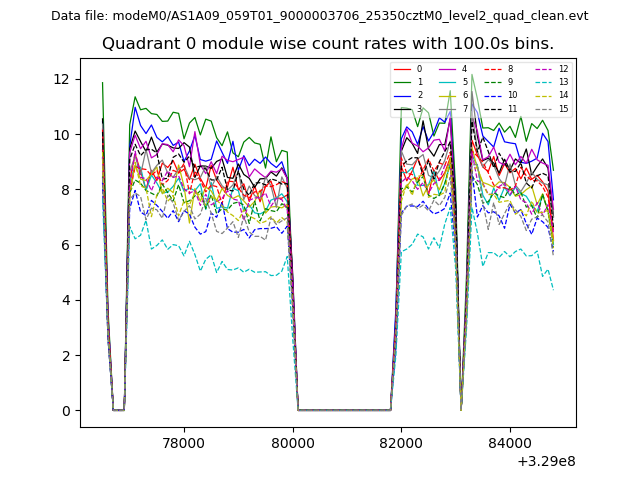
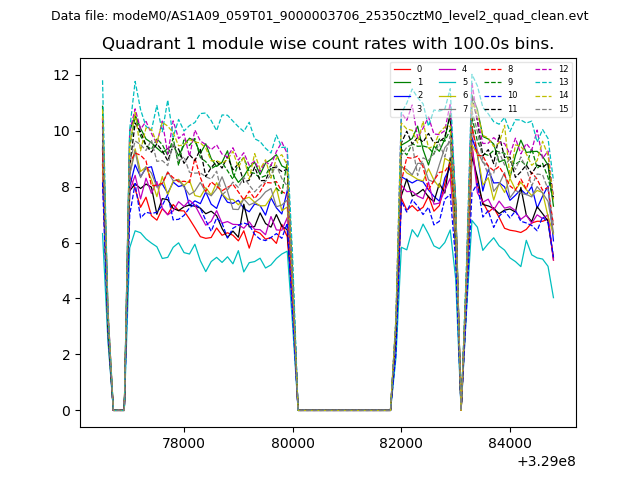
| Module-wise count rates for Quadrant A Data is divided into 100 sec bins |
 |
 |
| Module-wise count rates for Quadrant B Data is divided into 100 sec bins |
 |
 |
| Module-wise count rates for Quadrant C Data is divided into 100 sec bins |
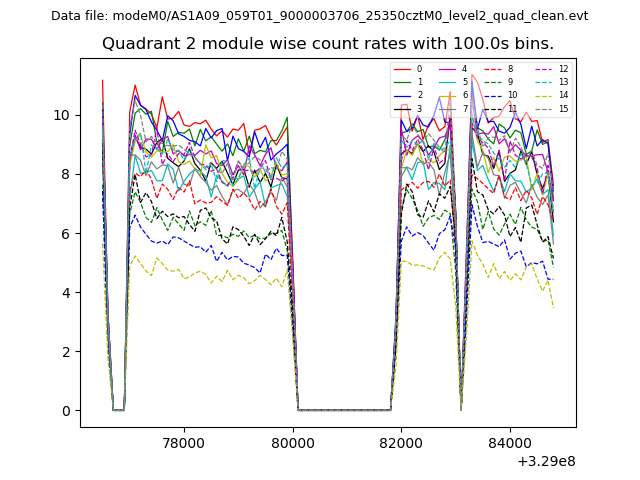 |
 |
| Module-wise count rates for Quadrant D Data is divided into 100 sec bins |
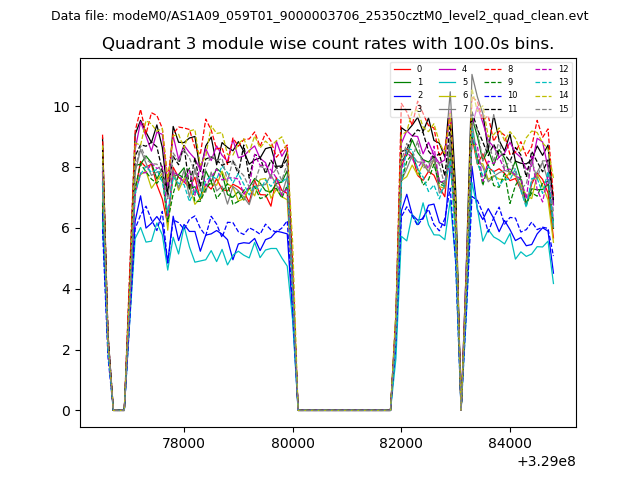 |
 |
| Parameter | Plot |
|---|---|
| CZT HV Monitor | 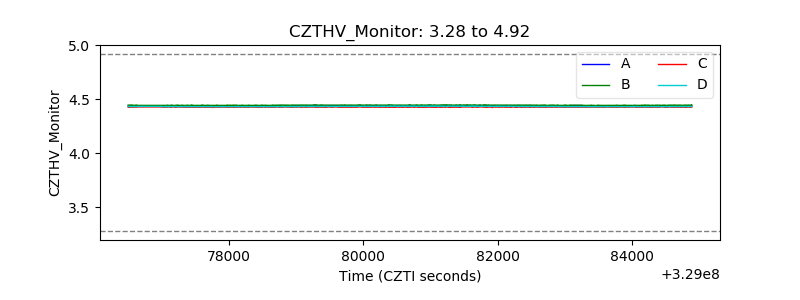 |
| D_VDD | 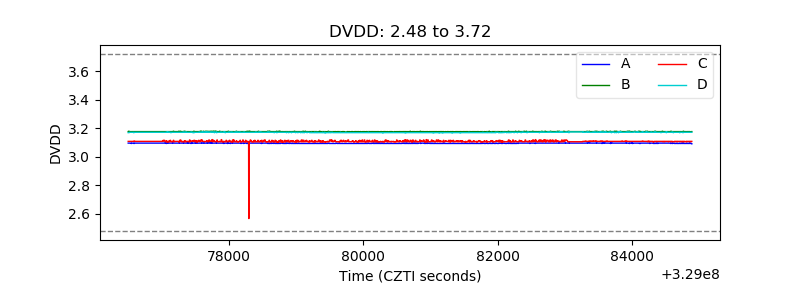 |
| Temperature 1 | 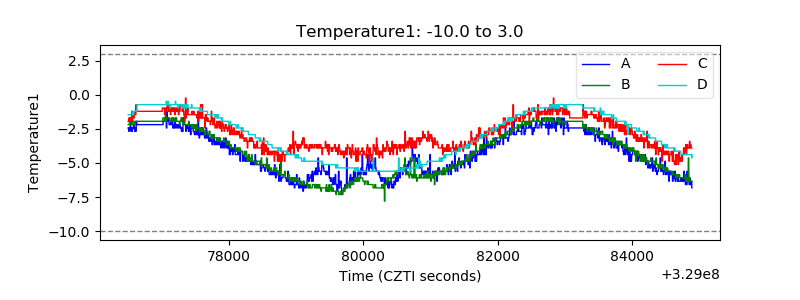 |
| Veto HV Monitor | 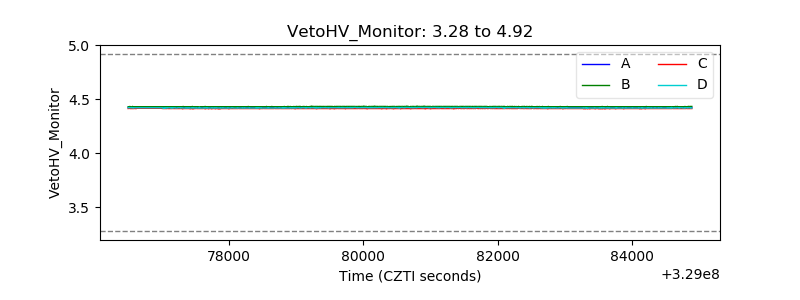 |
| Veto LLD | 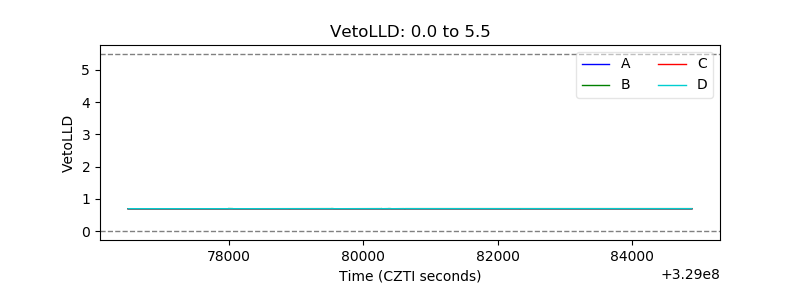 |
| Alpha Counter | 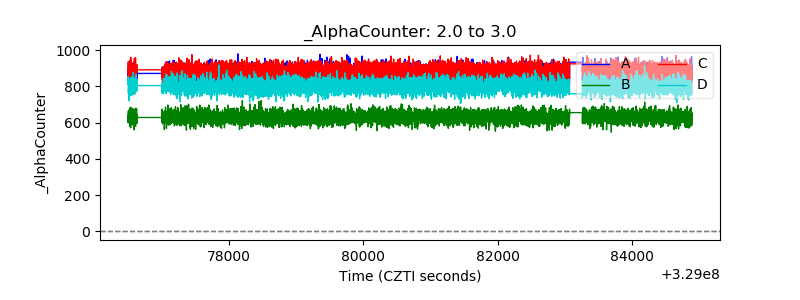 |
| _CPM_Rate | 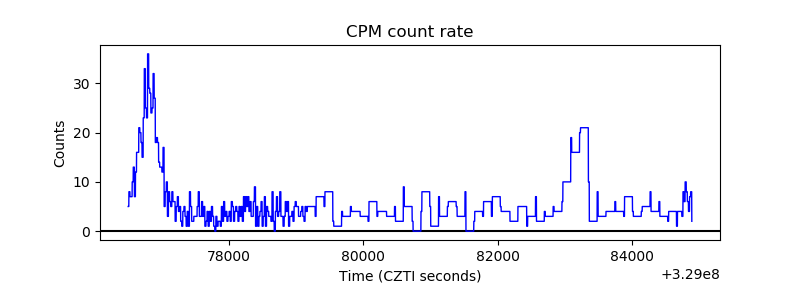 |
| CZT Counter | 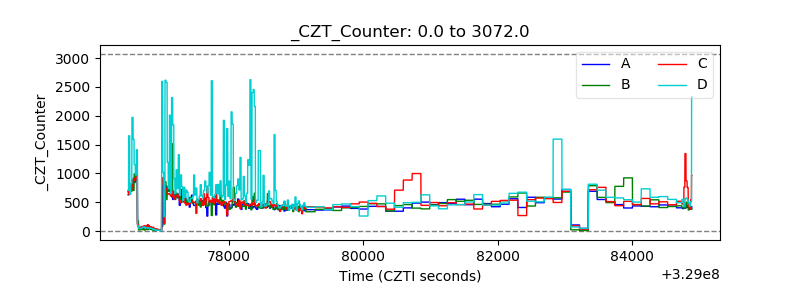 |
| +2.5 Volts monitor |  |
| +5 Volts monitor |  |
| _ROLL_ROT | 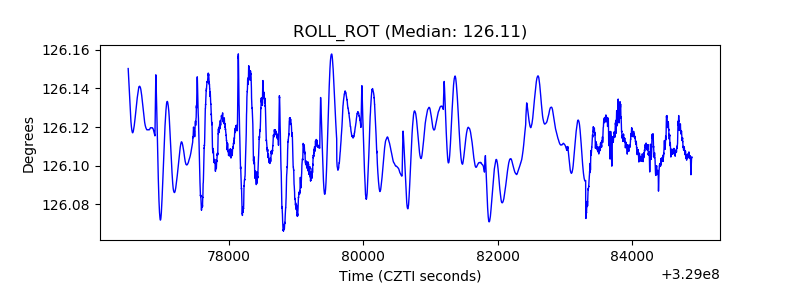 |
| _Roll_DEC |  |
| _Roll_RA | 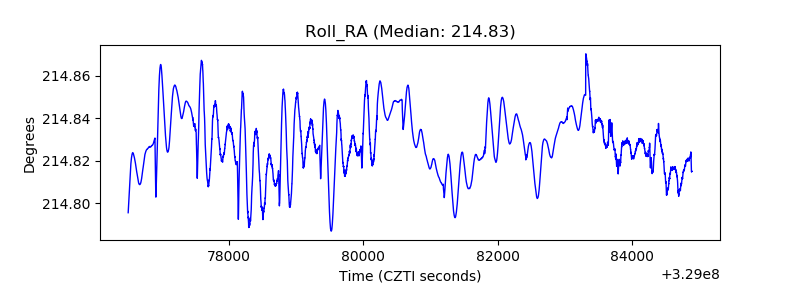 |
| Veto Counter | 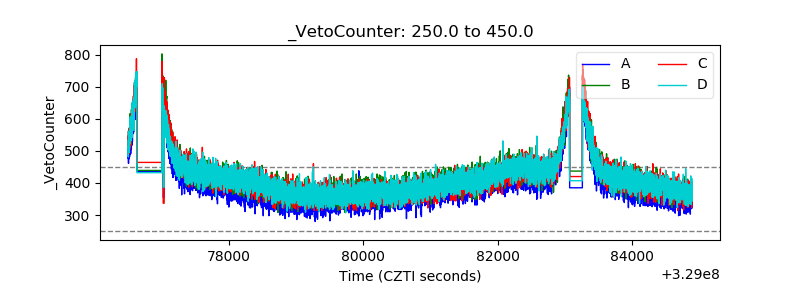 |