| Param | Original file | Final file |
|---|---|---|
| Filename | modeM0/AS1A09_059T01_9000003706_25351cztM0_level2.evt | modeM0/AS1A09_059T01_9000003706_25351cztM0_level2_quad_clean.evt |
| Size (bytes) | 559,774,080 | 112,968,000 |
| Size | 533.8 MB | 107.7 MB |
| Events in quadrant A | 3,561,173 | 741,727 |
| Events in quadrant B | 3,702,401 | 746,842 |
| Events in quadrant C | 4,053,215 | 713,502 |
| Events in quadrant D | 5,121,011 | 691,213 |
| Mode M0 | |||
|---|---|---|---|
| Quadrant | BADHDUFLAG | Total packets | Discarded packets |
| A | 0 | 15714 | 0 |
| B | 0 | 16085 | 0 |
| C | 0 | 17033 | 0 |
| D | 0 | 20293 | 0 |
| Mode M9 | |||
|---|---|---|---|
| Quadrant | BADHDUFLAG | Total packets | Discarded packets |
| A | 0 | 4 | 0 |
| B | 0 | 5 | 0 |
| C | 0 | 5 | 0 |
| D | 0 | 5 | 0 |
| Quadrant | Total seconds | Saturated seconds | Saturation percentage |
|---|---|---|---|
| A | 7588 | 48 | 0.632578% |
| B | 7588 | 66 | 0.869794% |
| C | 7588 | 153 | 2.016342% |
| D | 7588 | 324 | 4.269900% |
Noise dominated data is calculated using 1-second bins in cleaned event files. If a bin has >2000 counts, and if more than 50% of those come from <1% of pixels, then it is considered to be noise-dominated and hence unusable.
| Quadrant | # 1 sec bins | Bins with >0 counts | Bins with >2000 counts | High rate bins dominated by noise | Noise dominated (total time) | Noise dominated (detector-on time) | Marked lightcurve |
|---|---|---|---|---|---|---|---|
| A | 7938 | 7589 | 7 | 7 | 0.09% | 0.09% | 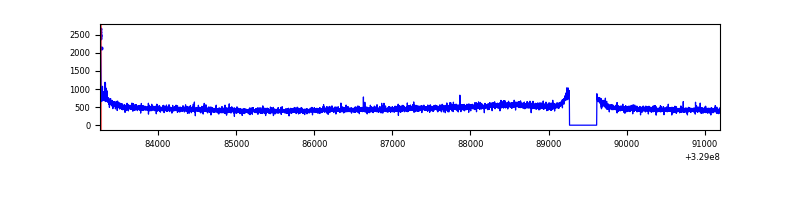 |
| B | 7938 | 7589 | 2 | 2 | 0.03% | 0.03% | 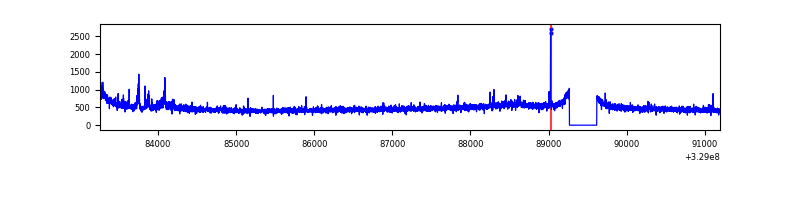 |
| C | 7938 | 7589 | 23 | 23 | 0.29% | 0.30% | 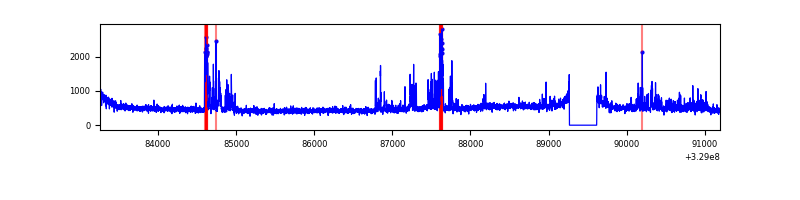 |
| D | 7938 | 7589 | 245 | 245 | 3.09% | 3.23% | 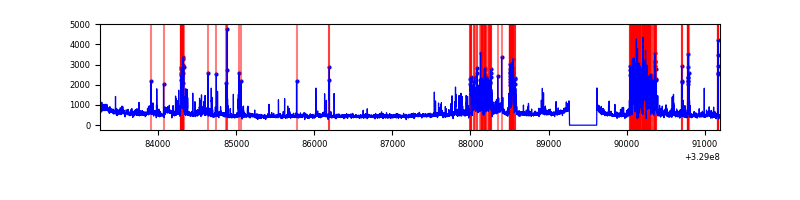 |
Top three noisy pixels from each quadrant. If the there are fewer than three noisy pixels in the level2.evt file, extra rows are filled as -1
| Pixel properties | Quadrant properties | ||||||
|---|---|---|---|---|---|---|---|
| Quadrant | DetID | PixID | Counts | Sigma | Mean | Median | Sigma |
| A | 8 | 192 | 25140 | 131.55 | 915 | 895 | 184.3 |
| A | 13 | 254 | 12344 | 62.12 | 915 | 895 | 184.3 |
| A | 3 | 137 | 8320 | 40.29 | 915 | 895 | 184.3 |
| B | 3 | 112 | 42757 | 241.53 | 909 | 885 | 173.4 |
| B | 5 | 235 | 31448 | 176.29 | 909 | 885 | 173.4 |
| B | 0 | 229 | 25360 | 141.18 | 909 | 885 | 173.4 |
| C | 9 | 54 | 351627 | 1692.55 | 882 | 888 | 207.2 |
| C | 14 | 238 | 141528 | 678.68 | 882 | 888 | 207.2 |
| C | 3 | 233 | 117732 | 563.85 | 882 | 888 | 207.2 |
| D | 12 | 233 | 1051570 | 4900.57 | 884 | 859 | 214.4 |
| D | 1 | 52 | 341263 | 1587.66 | 884 | 859 | 214.4 |
| D | 8 | 195 | 183672 | 852.65 | 884 | 859 | 214.4 |
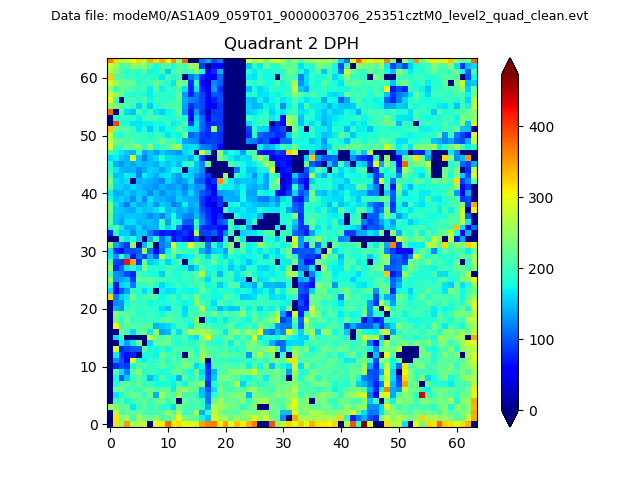
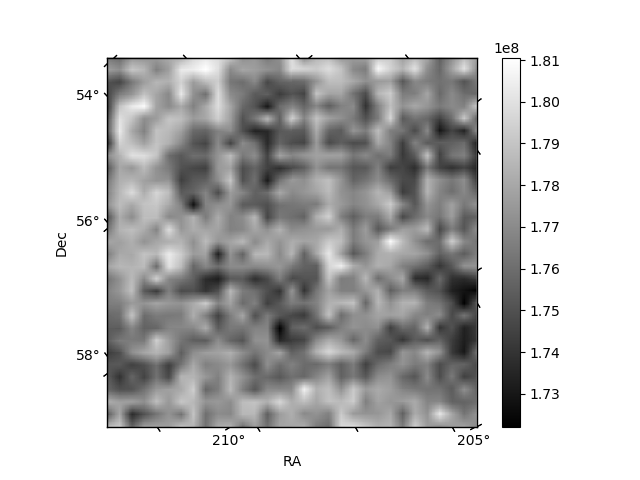
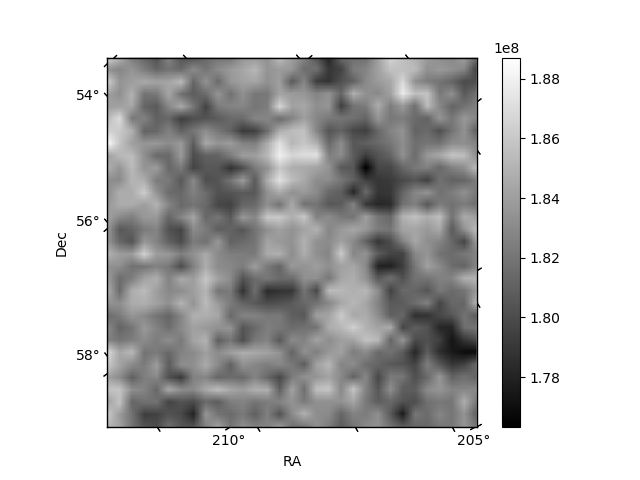
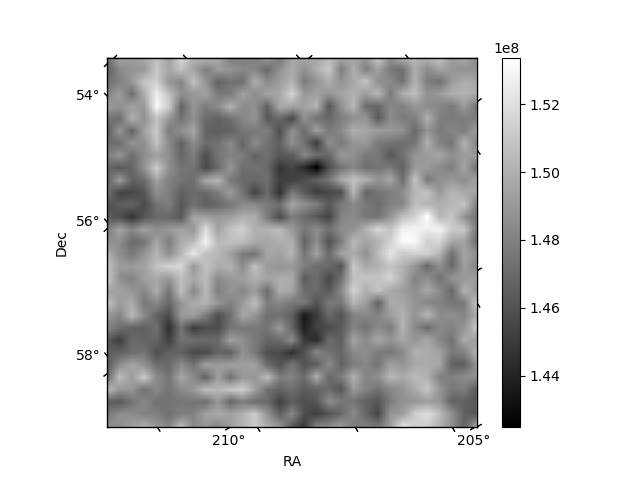
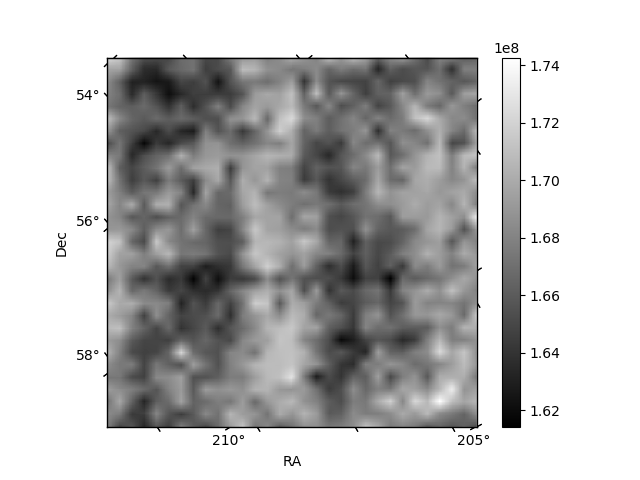
Histogram calculated using DETX and DETY for each event in the final _common_clean file
| Quadrant A |  |
 |
Quadrant B |
|---|---|---|---|
| Quadrant D | 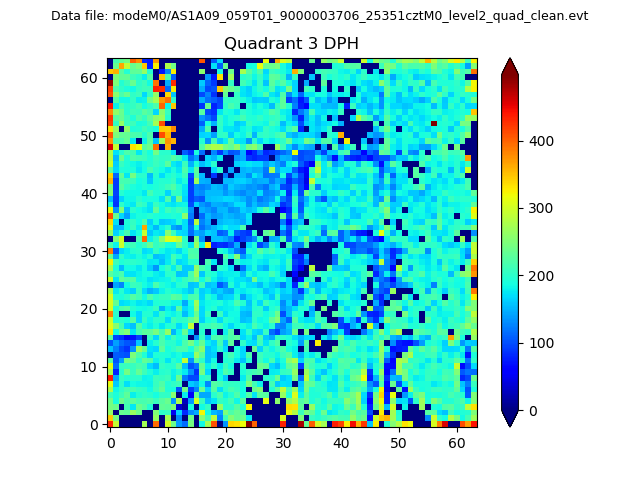 |
 |
Quadrant C |
| Plot type | Count rate plots | Images |
|---|---|---|
| Comparison with Poisson distribution Blue bars denote a histogram of data divided into 1 sec bins. Red curve is a Poisson curve with rate = median count rate of data. |
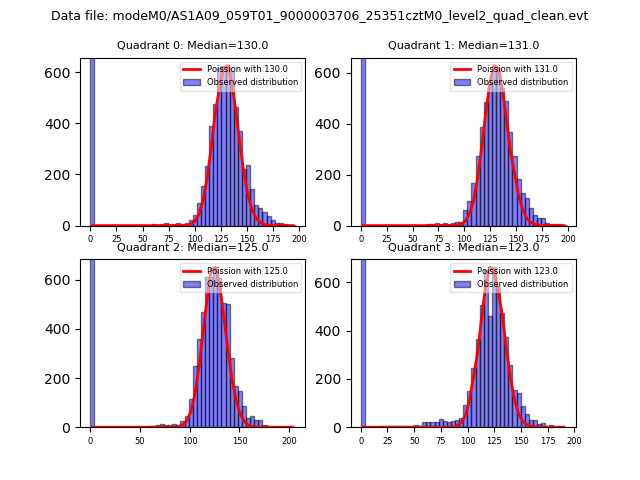 |
 |
| Quadrant-wise count rates Data is divided into 100 sec bins |
 |
|
| Module-wise count rates for Quadrant A Data is divided into 100 sec bins |
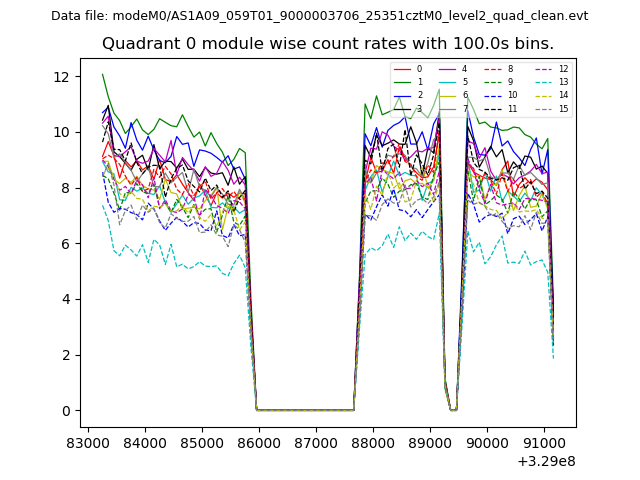 |
 |
| Module-wise count rates for Quadrant B Data is divided into 100 sec bins |
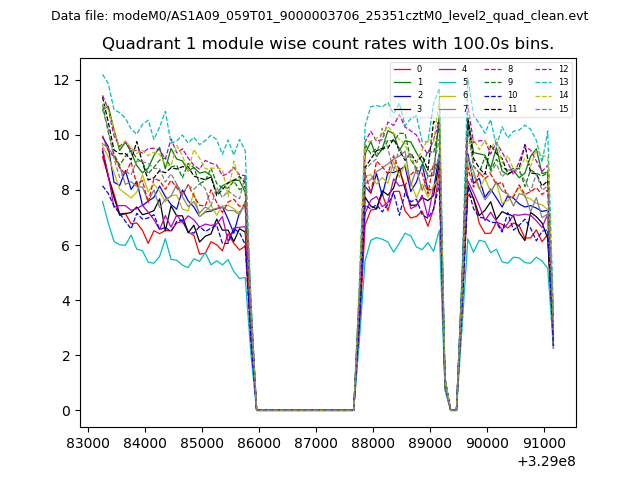 |
 |
| Module-wise count rates for Quadrant C Data is divided into 100 sec bins |
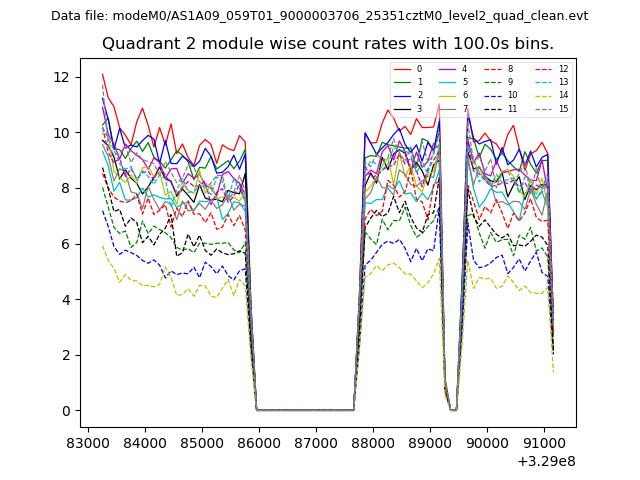 |
 |
| Module-wise count rates for Quadrant D Data is divided into 100 sec bins |
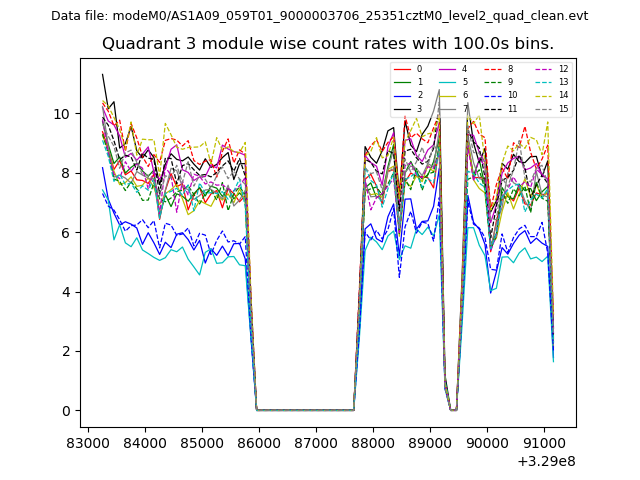 |
 |
| Parameter | Plot |
|---|---|
| CZT HV Monitor | 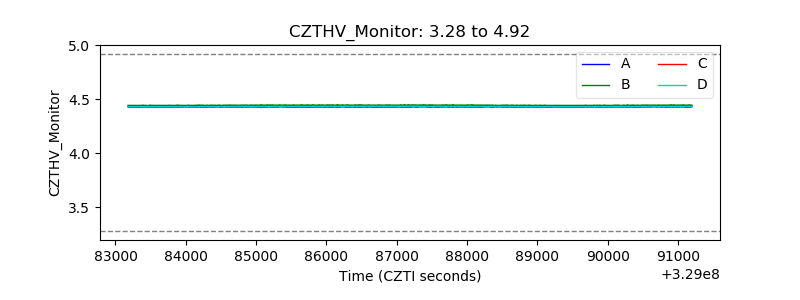 |
| D_VDD | 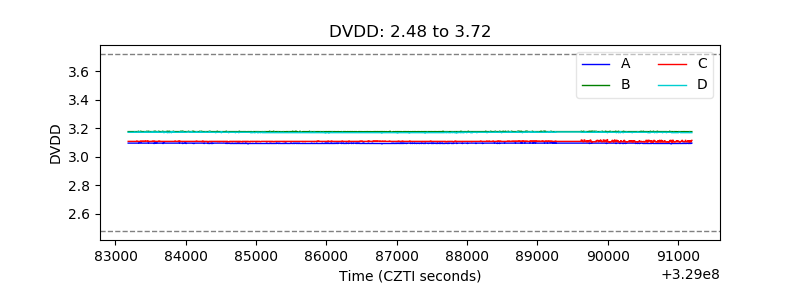 |
| Temperature 1 | 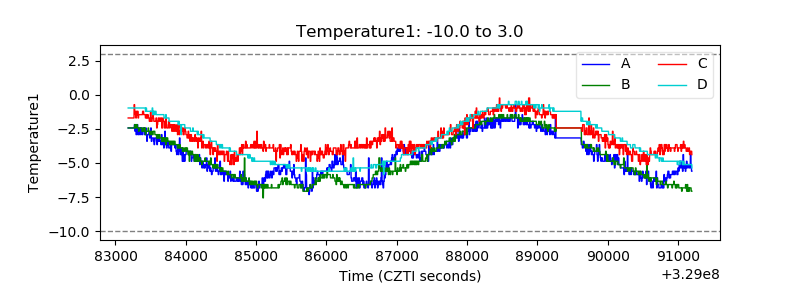 |
| Veto HV Monitor | 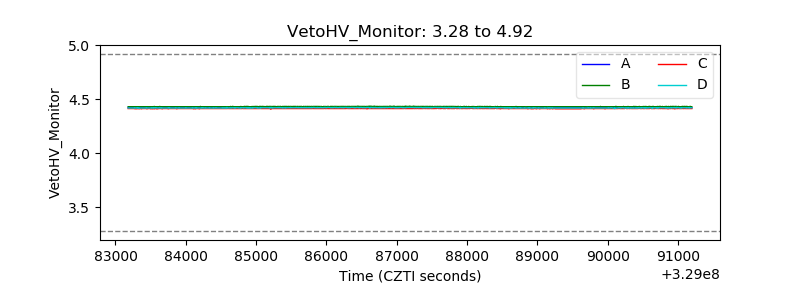 |
| Veto LLD |  |
| Alpha Counter | 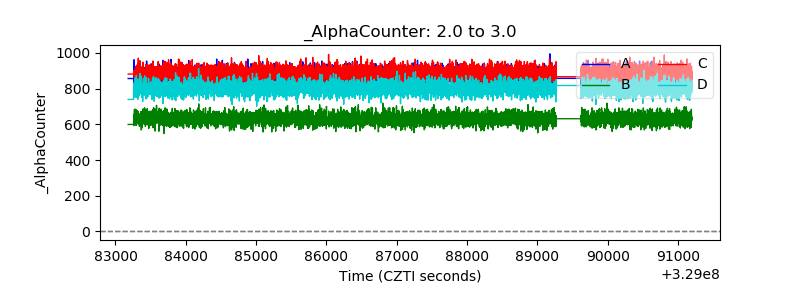 |
| _CPM_Rate |  |
| CZT Counter | 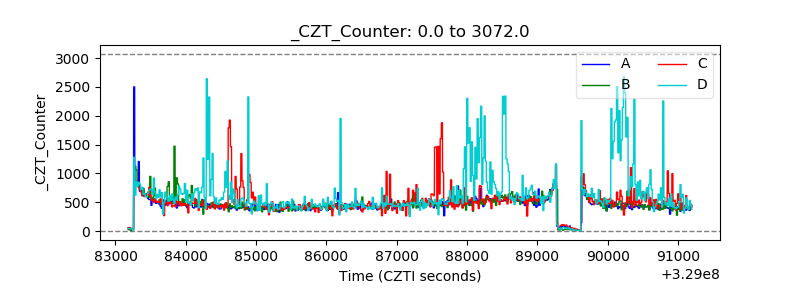 |
| +2.5 Volts monitor | 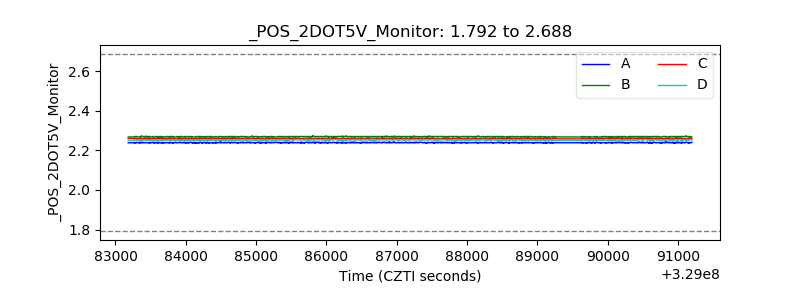 |
| +5 Volts monitor | 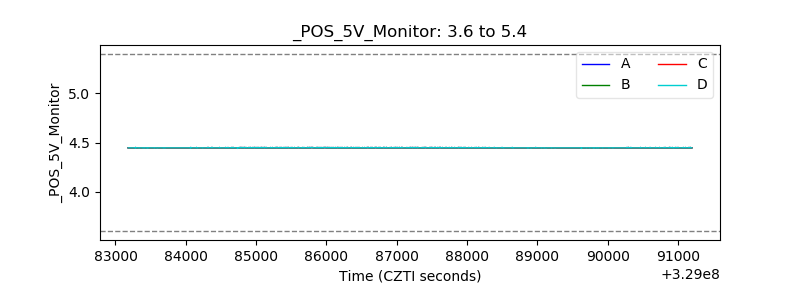 |
| _ROLL_ROT | 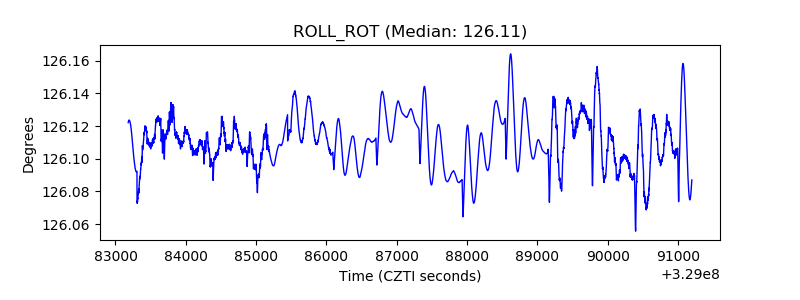 |
| _Roll_DEC | 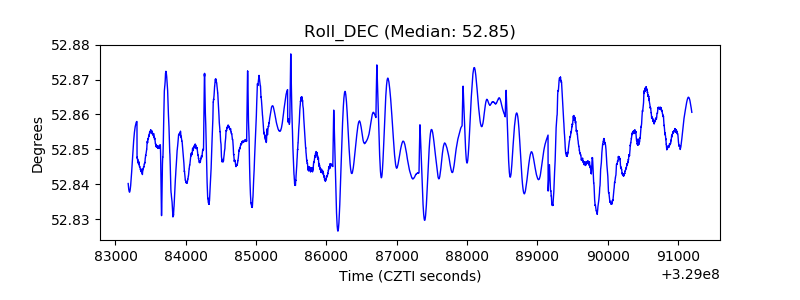 |
| _Roll_RA | 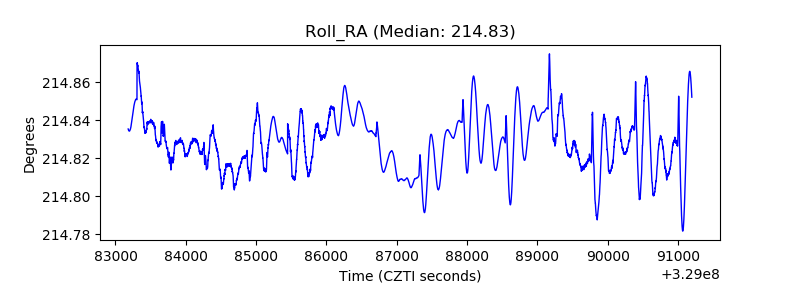 |
| Veto Counter | 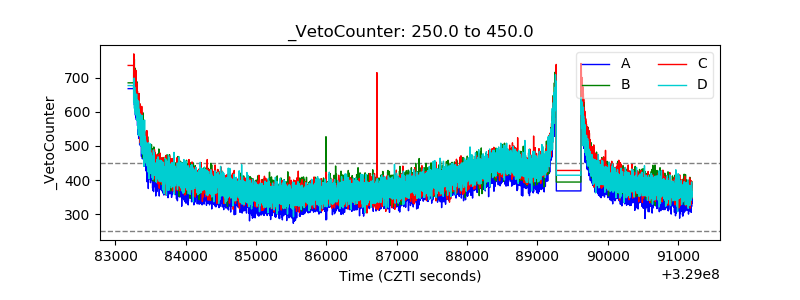 |